| Param | Original file | Final file |
|---|---|---|
| Filename | modeM0/AS1G06_051T01_9000000972_07122cztM0_level2.evt | modeM0/AS1G06_051T01_9000000972_07122cztM0_level2_quad_clean.evt |
| Size (bytes) | 163,094,400 | 42,474,240 |
| Size | 155.5 MB | 40.5 MB |
| Events in quadrant A | 1,130,158 | 282,686 |
| Events in quadrant B | 1,232,699 | 291,156 |
| Events in quadrant C | 1,136,622 | 284,541 |
| Events in quadrant D | 1,289,919 | 270,426 |
| Mode M9 | |||
|---|---|---|---|
| Quadrant | BADHDUFLAG | Total packets | Discarded packets |
| A | 0 | 12 | 0 |
| B | 0 | 12 | 0 |
| C | 0 | 12 | 0 |
| D | 0 | 12 | 0 |
| Mode SS | |||
|---|---|---|---|
| Quadrant | BADHDUFLAG | Total packets | Discarded packets |
| A | 0 | 44 | 0 |
| B | 0 | 44 | 0 |
| C | 0 | 44 | 0 |
| D | 0 | 44 | 0 |
| Mode M0 | |||
|---|---|---|---|
| Quadrant | BADHDUFLAG | Total packets | Discarded packets |
| A | 0 | 4715 | 2 |
| B | 0 | 5048 | 1 |
| C | 0 | 4734 | 1 |
| D | 0 | 5226 | 1 |
| Quadrant | Total seconds | Saturated seconds | Saturation percentage |
|---|---|---|---|
| A | 2175 | 103 | 4.735632% |
| B | 2175 | 110 | 5.057471% |
| C | 2175 | 54 | 2.482759% |
| D | 2175 | 101 | 4.643678% |
Noise dominated data is calculated using 1-second bins in cleaned event files. If a bin has >2000 counts, and if more than 50% of those come from <1% of pixels, then it is considered to be noise-dominated and hence unusable.
| Quadrant | # 1 sec bins | Bins with >0 counts | Bins with >2000 counts | High rate bins dominated by noise | Noise dominated (total time) | Noise dominated (detector-on time) | Marked lightcurve |
|---|---|---|---|---|---|---|---|
| A | 3325 | 2175 | 0 | 0 | 0.00% | 0.00% | 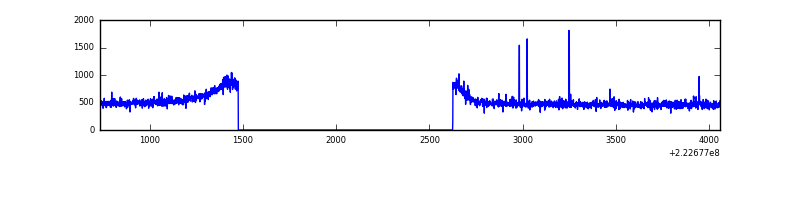 |
| B | 3325 | 2175 | 1 | 1 | 0.03% | 0.05% | 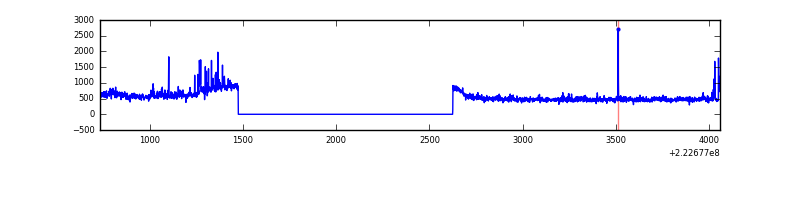 |
| C | 3325 | 2175 | 0 | 0 | 0.00% | 0.00% | 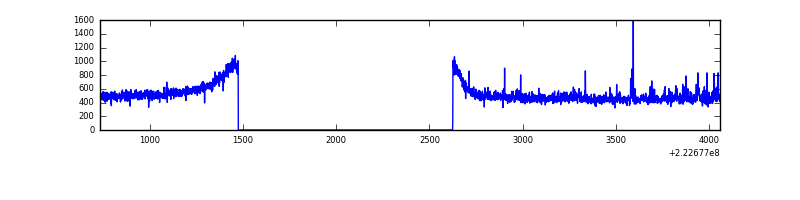 |
| D | 3325 | 2175 | 11 | 11 | 0.33% | 0.51% | 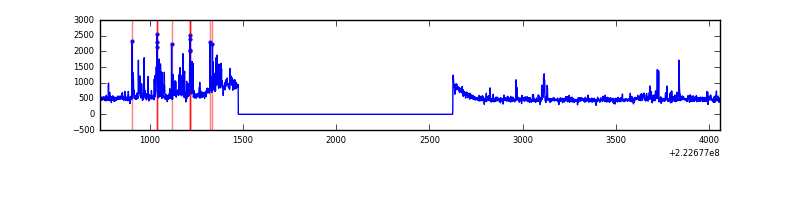 |
Top three noisy pixels from each quadrant. If the there are fewer than three noisy pixels in the level2.evt file, extra rows are filled as -1
| Pixel properties | Quadrant properties | ||||||
|---|---|---|---|---|---|---|---|
| Quadrant | DetID | PixID | Counts | Sigma | Mean | Median | Sigma |
| A | 14 | 111 | 7957 | 124.28 | 289 | 282 | 61.8 |
| A | 8 | 15 | 5387 | 82.67 | 289 | 282 | 61.8 |
| A | 15 | 223 | 3651 | 54.55 | 289 | 282 | 61.8 |
| B | 0 | 219 | 80401 | 1378.4 | 290 | 283 | 58.1 |
| B | 4 | 81 | 22800 | 387.4 | 290 | 283 | 58.1 |
| B | 12 | 111 | 5974 | 97.91 | 290 | 283 | 58.1 |
| C | 4 | 254 | 22149 | 325.75 | 280 | 281 | 67.1 |
| C | 9 | 68 | 15438 | 225.78 | 280 | 281 | 67.1 |
| C | 8 | 128 | 3110 | 42.14 | 280 | 281 | 67.1 |
| D | 2 | 216 | 149086 | 2134.83 | 278 | 268 | 69.7 |
| D | 8 | 195 | 70552 | 1008.24 | 278 | 268 | 69.7 |
| D | 13 | 137 | 17216 | 243.12 | 278 | 268 | 69.7 |
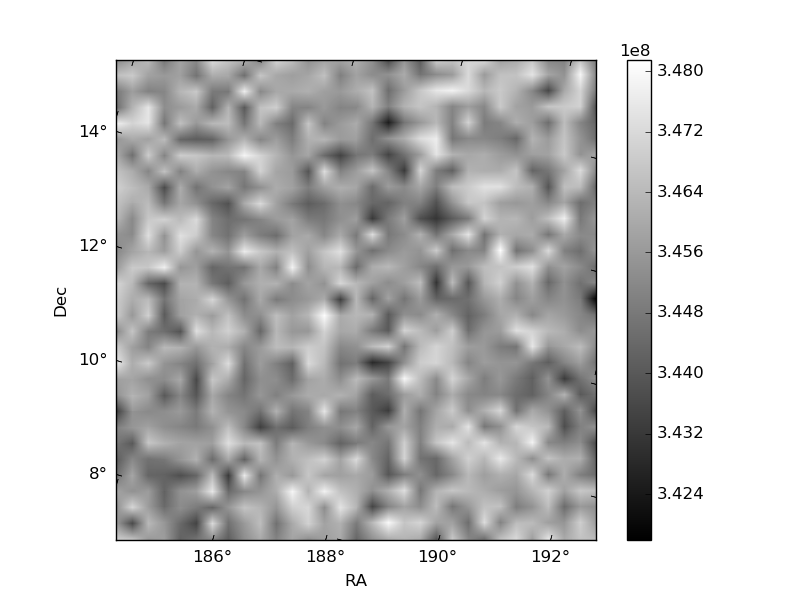
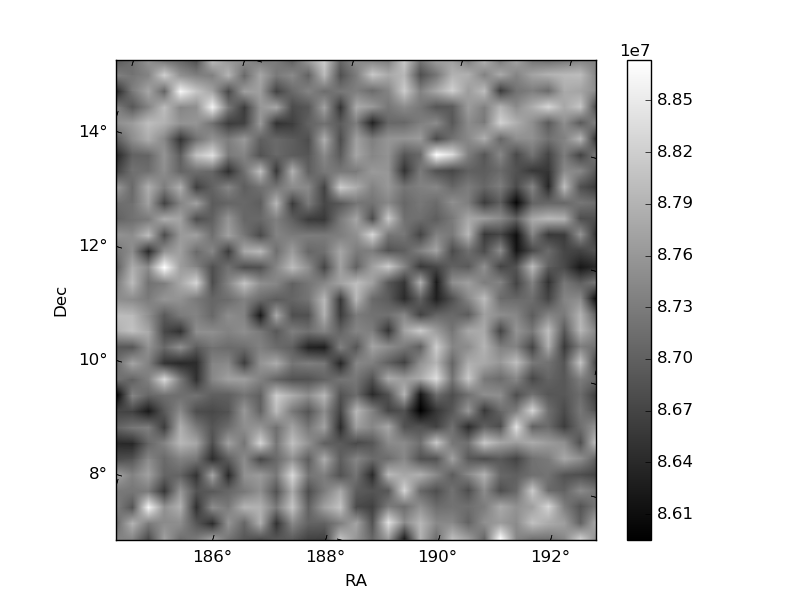
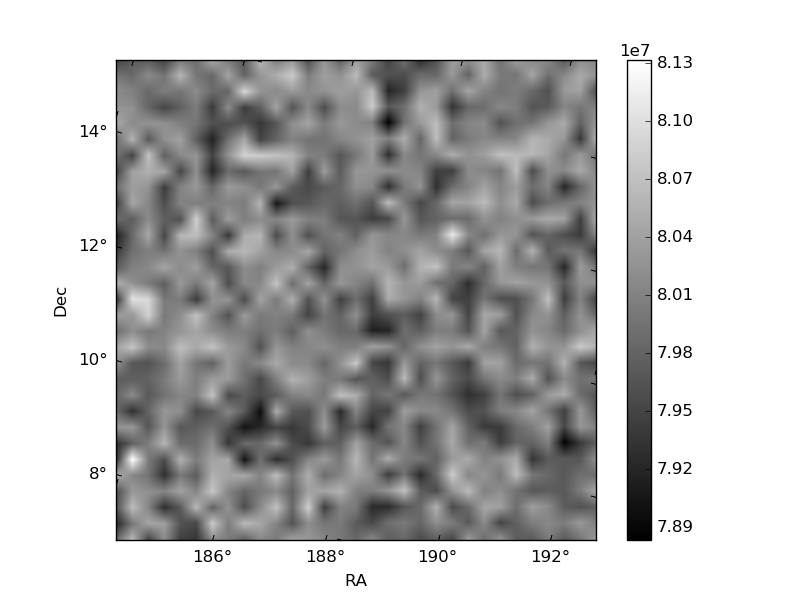
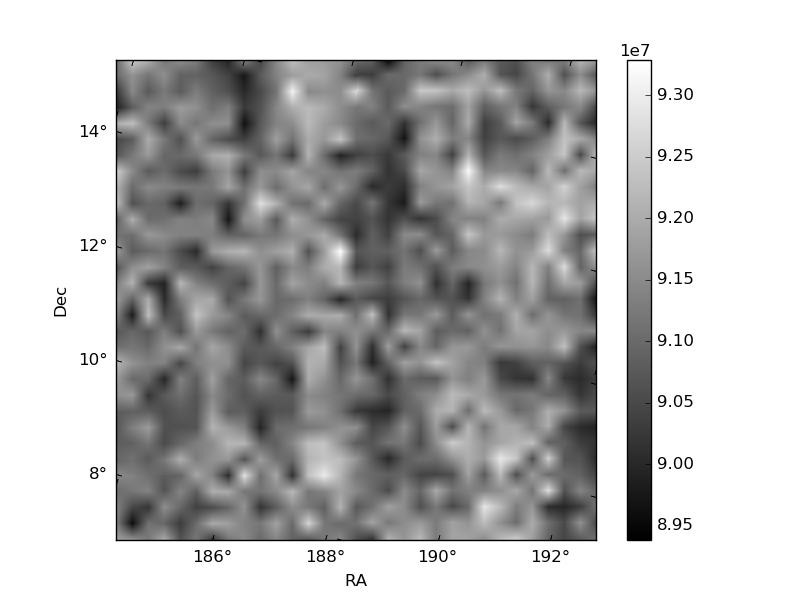
Histogram calculated using DETX and DETY for each event in the final _common_clean file
| Quadrant A | 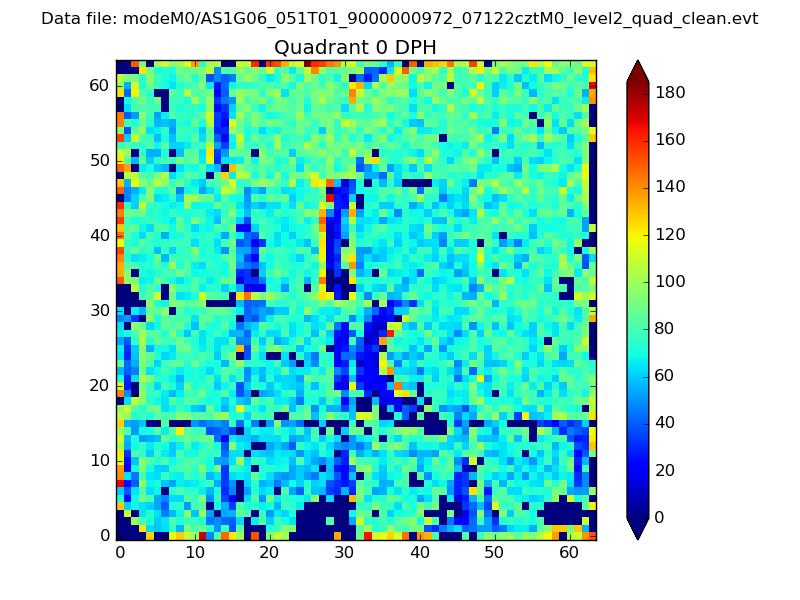 |
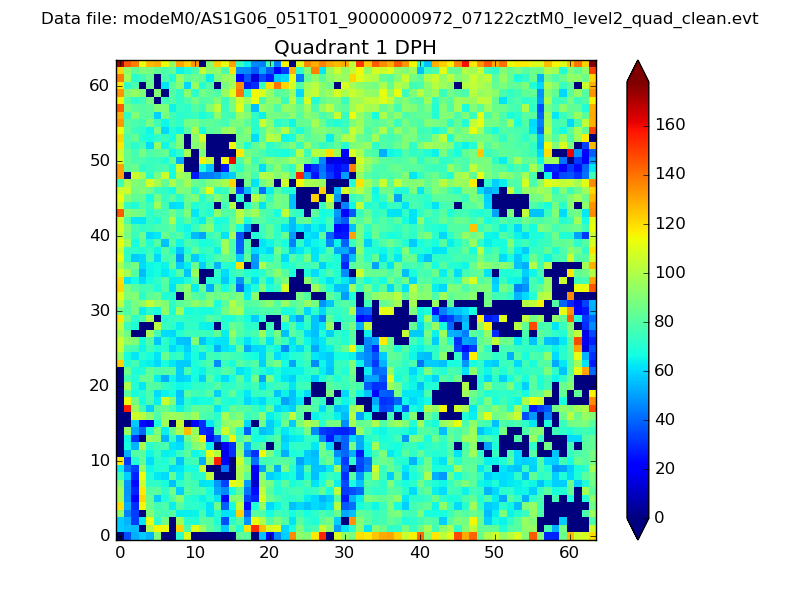 |
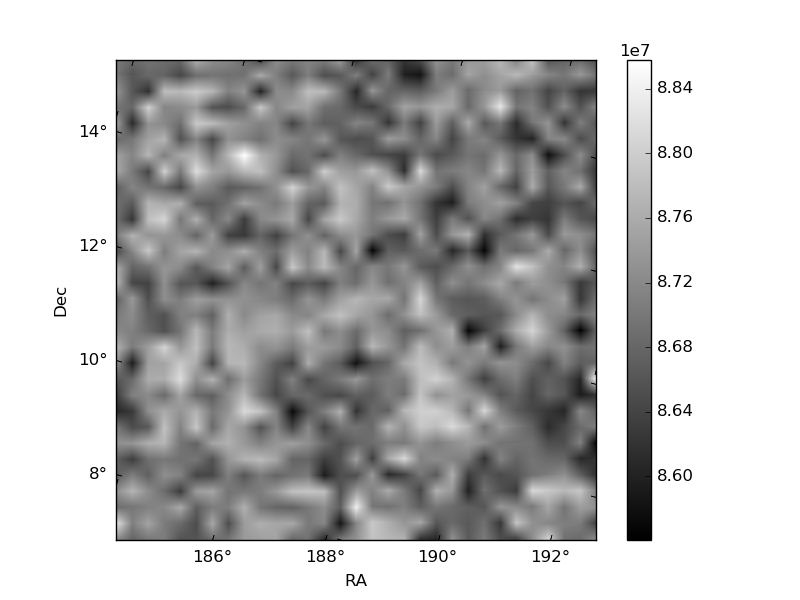
Quadrant B |
|---|---|---|---|
| Quadrant D | 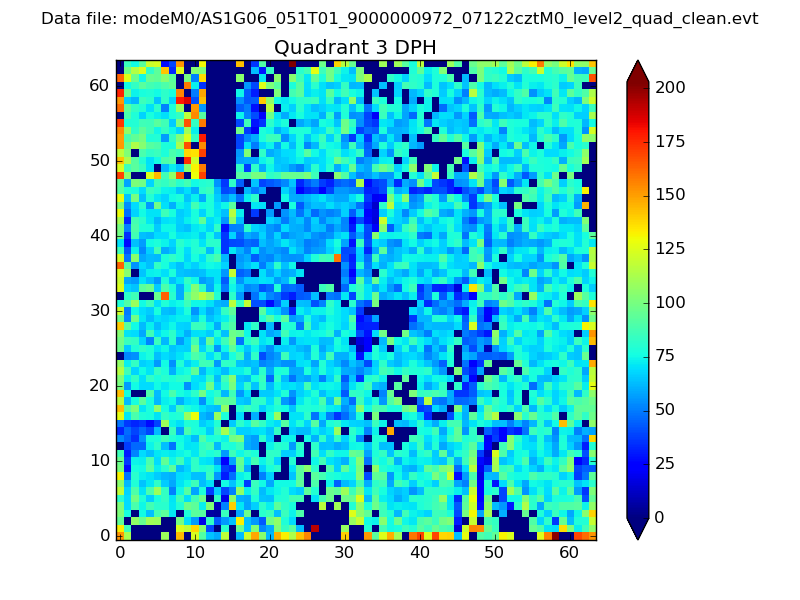 |
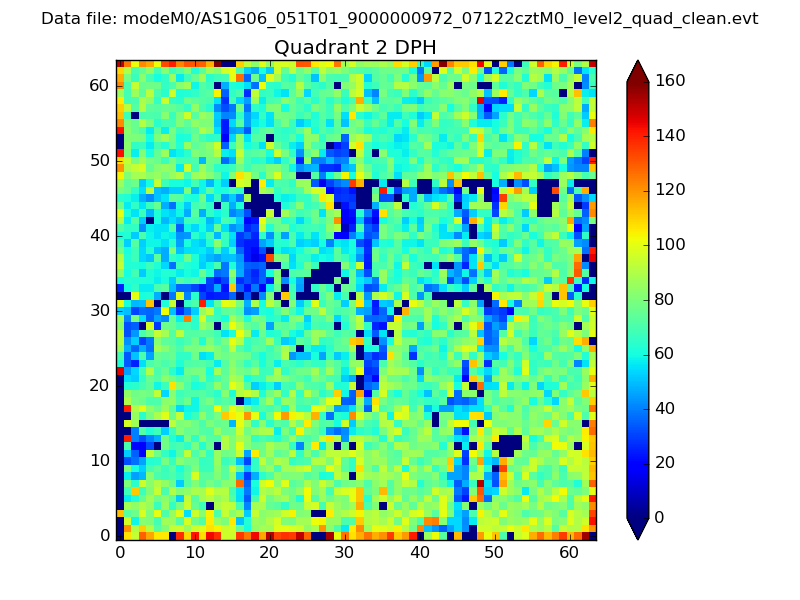 |
Quadrant C |
| Plot type | Count rate plots | Images |
|---|---|---|
| Comparison with Poisson distribution Blue bars denote a histogram of data divided into 1 sec bins. Red curve is a Poisson curve with rate = median count rate of data. |
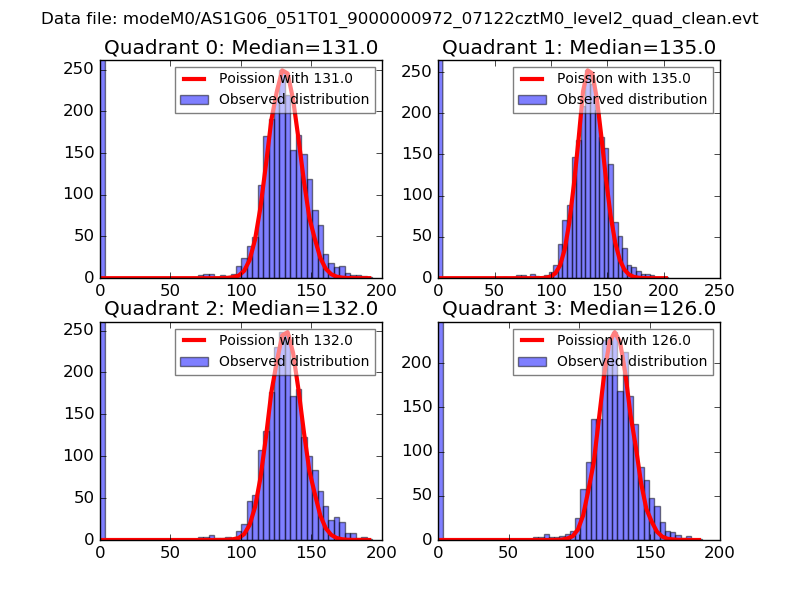 |
 |
| Quadrant-wise count rates Data is divided into 100 sec bins |
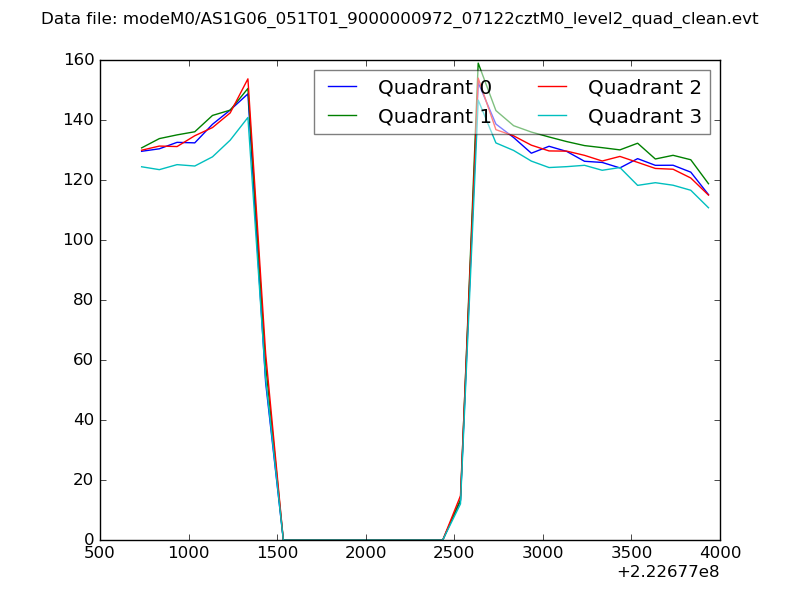 |
|
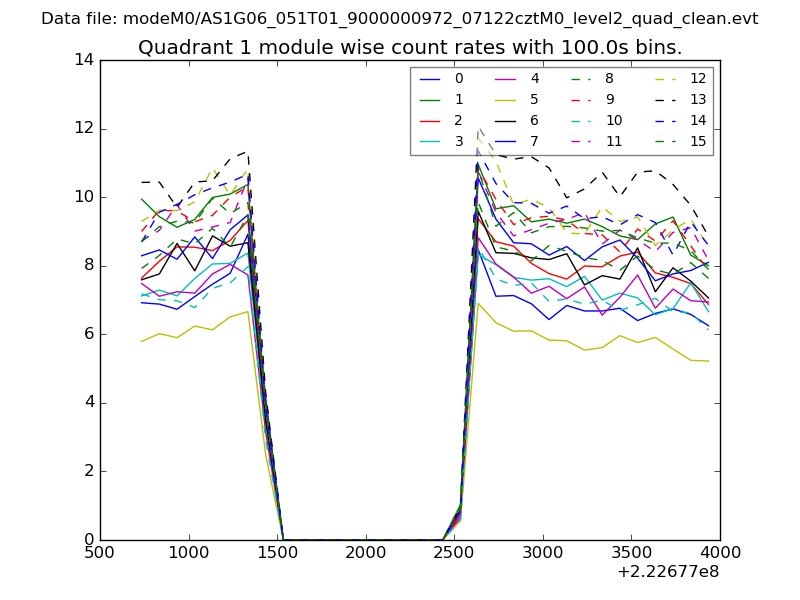
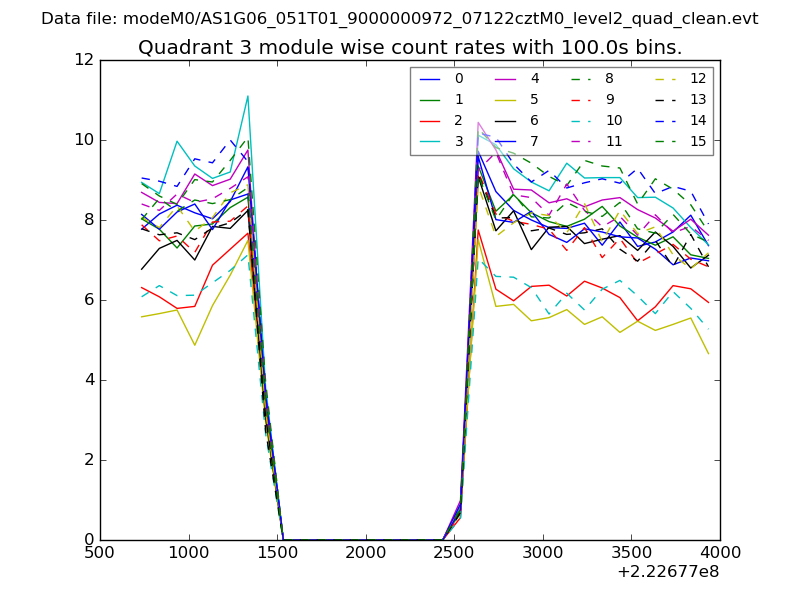
| Module-wise count rates for Quadrant A Data is divided into 100 sec bins |
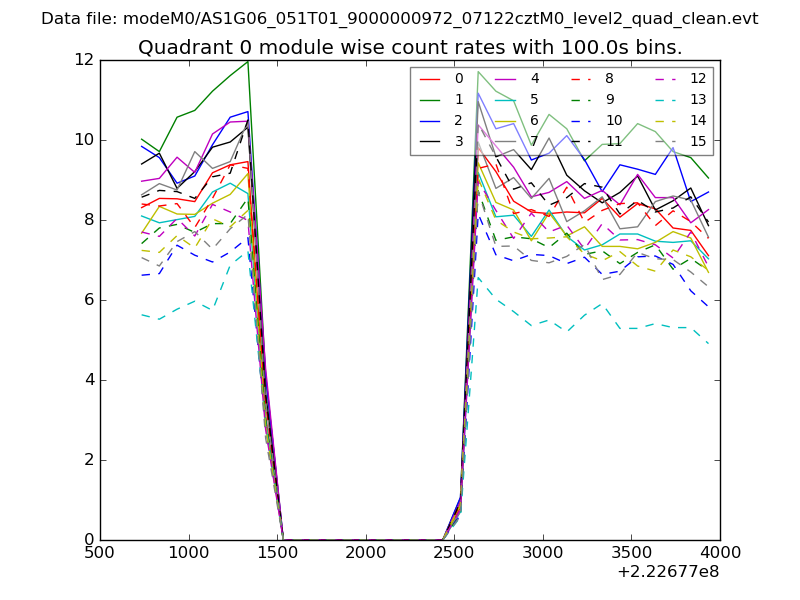 |
 |
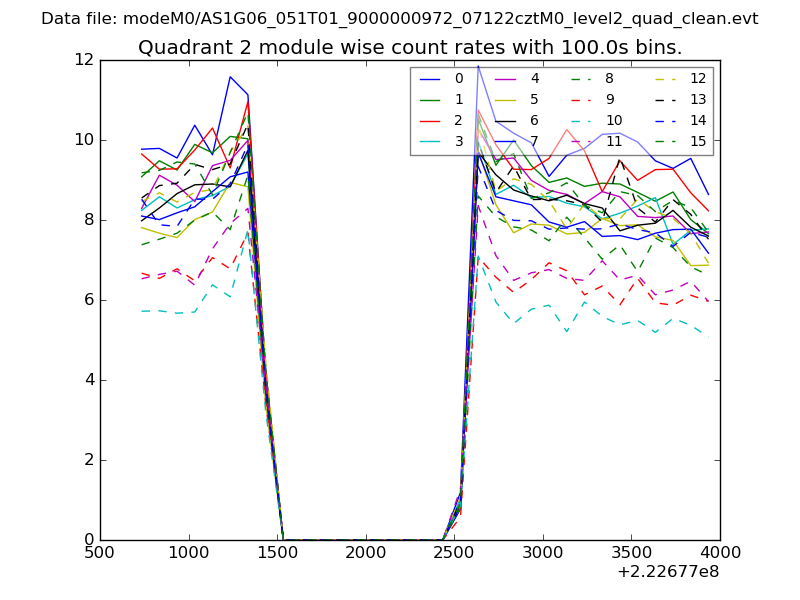
| Module-wise count rates for Quadrant B Data is divided into 100 sec bins |
 |
 |
| Module-wise count rates for Quadrant C Data is divided into 100 sec bins |
 |
 |
| Module-wise count rates for Quadrant D Data is divided into 100 sec bins |
 |
 |
| Parameter | Plot |
|---|---|
| CZT HV Monitor | 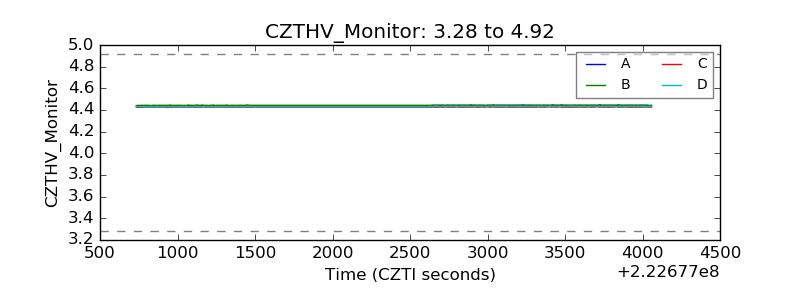 |
| D_VDD | 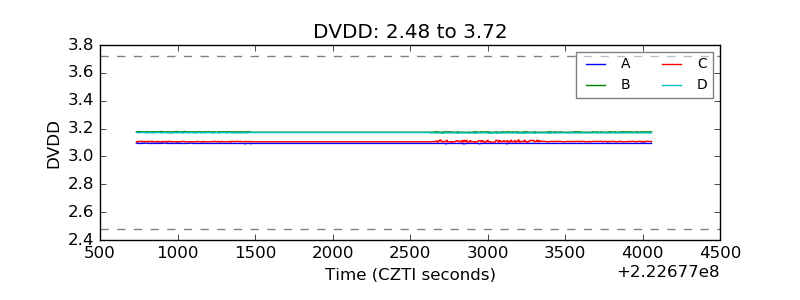 |
| Temperature 1 | 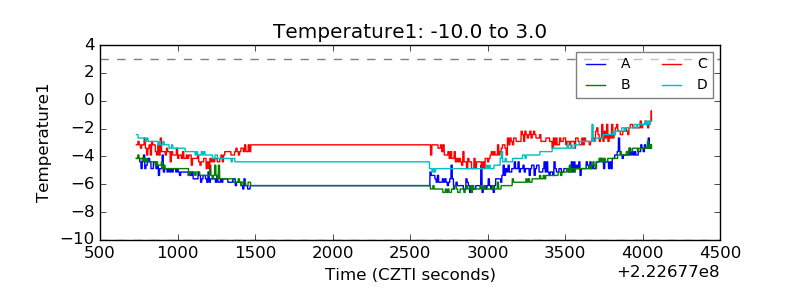 |
| Veto HV Monitor | 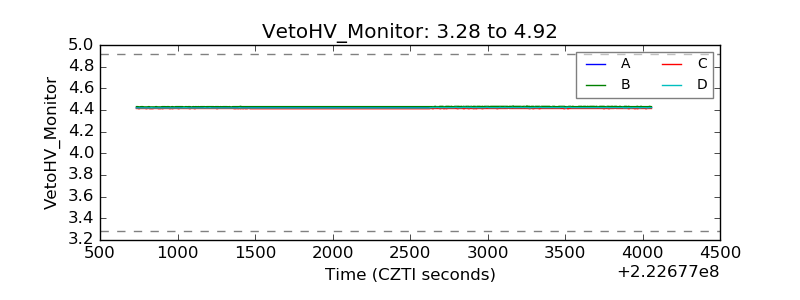 |
| Veto LLD | 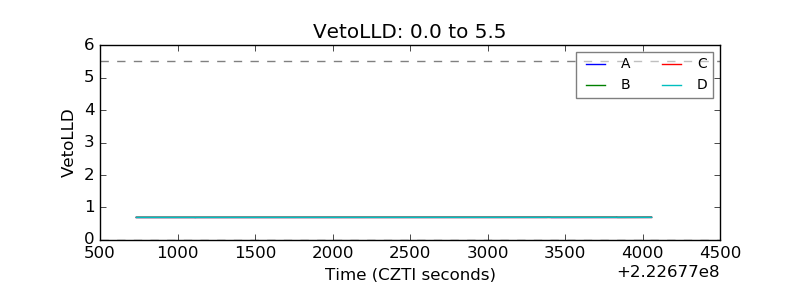 |
| Alpha Counter | 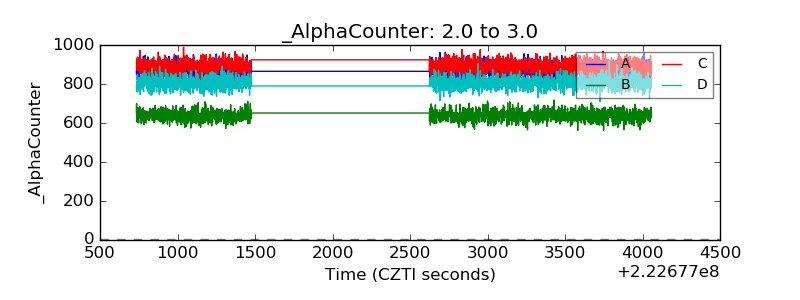 |
| _CPM_Rate | 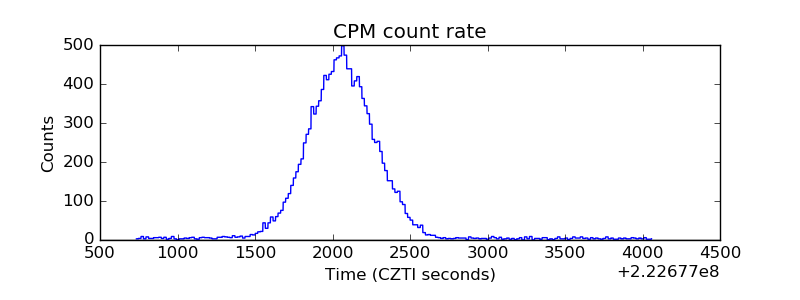 |
| CZT Counter | 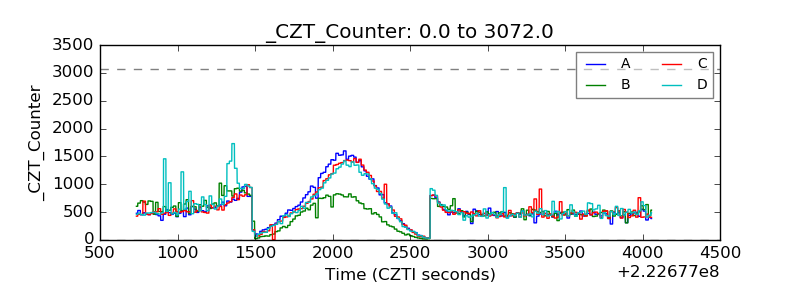 |
| +2.5 Volts monitor |  |
| +5 Volts monitor |  |
| _ROLL_ROT | 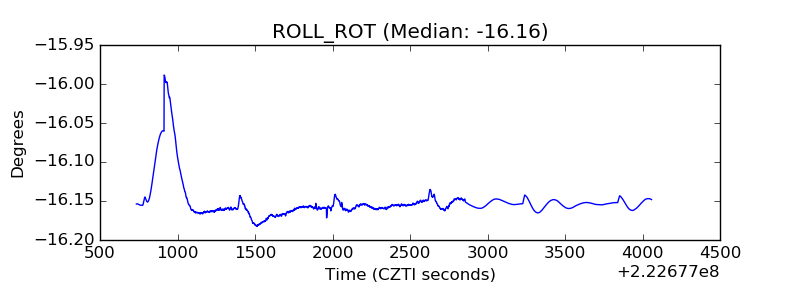 |
| _Roll_DEC | 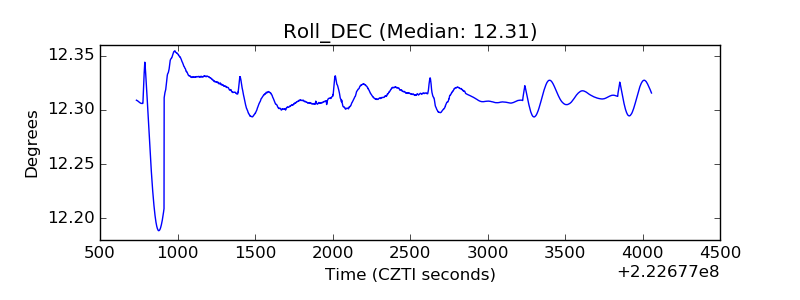 |
| _Roll_RA | 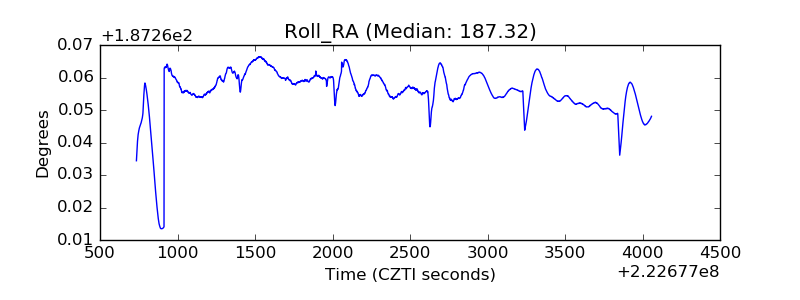 |
| Veto Counter | 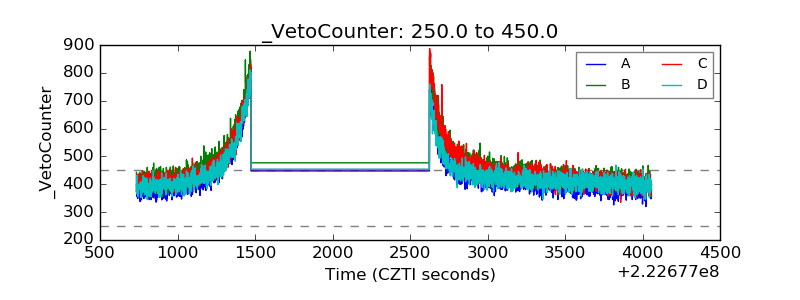 |