| Param | Original file | Final file |
|---|---|---|
| Filename | modeM0/AS1G06_051T01_9000000972_07123cztM0_level2.evt | modeM0/AS1G06_051T01_9000000972_07123cztM0_level2_quad_clean.evt |
| Size (bytes) | 469,739,520 | 74,684,160 |
| Size | 448.0 MB | 71.2 MB |
| Events in quadrant A | 3,026,436 | 457,010 |
| Events in quadrant B | 3,195,750 | 469,564 |
| Events in quadrant C | 3,031,221 | 459,117 |
| Events in quadrant D | 4,542,880 | 434,252 |
| Mode M9 | |||
|---|---|---|---|
| Quadrant | BADHDUFLAG | Total packets | Discarded packets |
| A | 0 | 9 | 0 |
| B | 0 | 9 | 0 |
| C | 0 | 9 | 0 |
| D | 0 | 9 | 0 |
| Mode SS | |||
|---|---|---|---|
| Quadrant | BADHDUFLAG | Total packets | Discarded packets |
| A | 0 | 130 | 0 |
| B | 0 | 130 | 0 |
| C | 0 | 130 | 0 |
| D | 0 | 130 | 0 |
| Mode M0 | |||
|---|---|---|---|
| Quadrant | BADHDUFLAG | Total packets | Discarded packets |
| A | 0 | 13045 | 2 |
| B | 0 | 13405 | 1 |
| C | 0 | 13259 | 1 |
| D | 0 | 17523 | 1 |
| Quadrant | Total seconds | Saturated seconds | Saturation percentage |
|---|---|---|---|
| A | 6320 | 135 | 2.136076% |
| B | 6320 | 127 | 2.009494% |
| C | 6320 | 105 | 1.661392% |
| D | 6320 | 433 | 6.851266% |
Noise dominated data is calculated using 1-second bins in cleaned event files. If a bin has >2000 counts, and if more than 50% of those come from <1% of pixels, then it is considered to be noise-dominated and hence unusable.
| Quadrant | # 1 sec bins | Bins with >0 counts | Bins with >2000 counts | High rate bins dominated by noise | Noise dominated (total time) | Noise dominated (detector-on time) | Marked lightcurve |
|---|---|---|---|---|---|---|---|
| A | 7220 | 6320 | 0 | 0 | 0.00% | 0.00% | 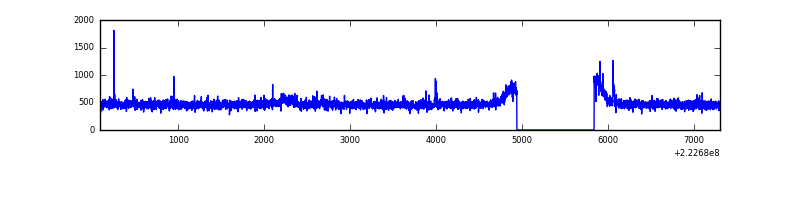 |
| B | 7220 | 6320 | 3 | 3 | 0.04% | 0.05% | 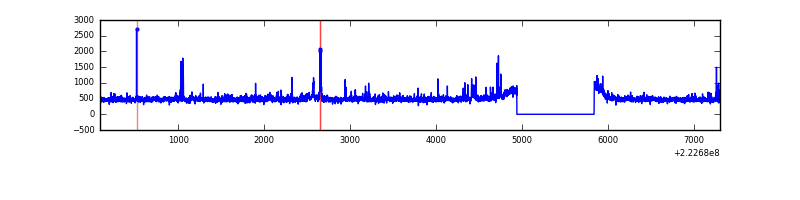 |
| C | 7220 | 6320 | 3 | 3 | 0.04% | 0.05% | 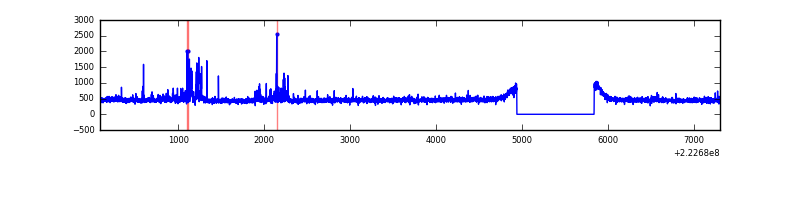 |
| D | 7219 | 6319 | 242 | 242 | 3.35% | 3.83% | 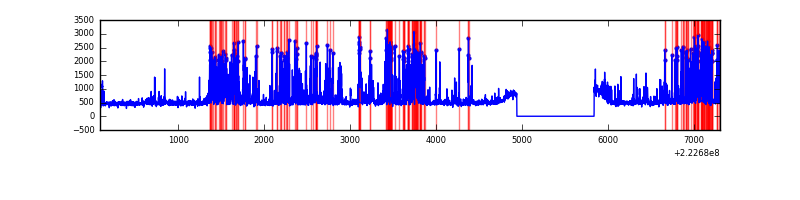 |
Top three noisy pixels from each quadrant. If the there are fewer than three noisy pixels in the level2.evt file, extra rows are filled as -1
| Pixel properties | Quadrant properties | ||||||
|---|---|---|---|---|---|---|---|
| Quadrant | DetID | PixID | Counts | Sigma | Mean | Median | Sigma |
| A | 14 | 111 | 49969 | 312.14 | 766 | 749 | 157.7 |
| A | 15 | 223 | 11211 | 66.35 | 766 | 749 | 157.7 |
| A | 13 | 14 | 9016 | 52.43 | 766 | 749 | 157.7 |
| B | 0 | 219 | 49087 | 327.42 | 768 | 750 | 147.6 |
| B | 4 | 81 | 47996 | 320.03 | 768 | 750 | 147.6 |
| B | 0 | 214 | 44297 | 294.97 | 768 | 750 | 147.6 |
| C | 4 | 254 | 132219 | 754.65 | 742 | 748 | 174.2 |
| C | 13 | 61 | 5672 | 28.26 | 742 | 748 | 174.2 |
| C | 10 | 22 | 2363 | 9.27 | 742 | 748 | 174.2 |
| D | 2 | 216 | 1471930 | 8110.06 | 734 | 710 | 181.4 |
| D | 8 | 195 | 254420 | 1398.57 | 734 | 710 | 181.4 |
| D | 12 | 233 | 19233 | 102.11 | 734 | 710 | 181.4 |
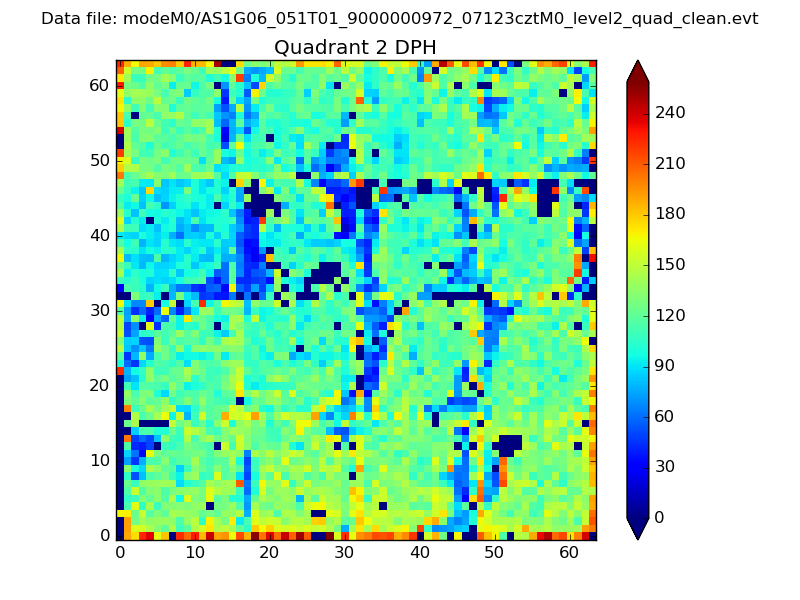
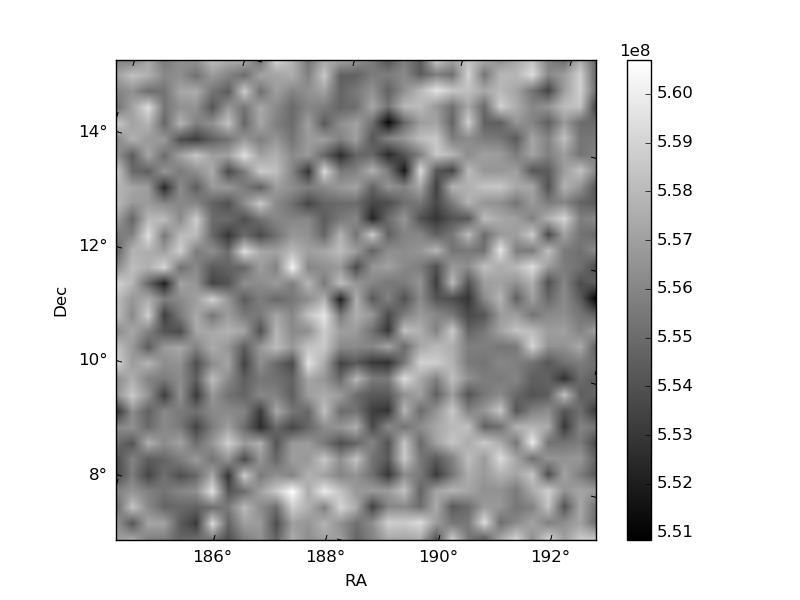
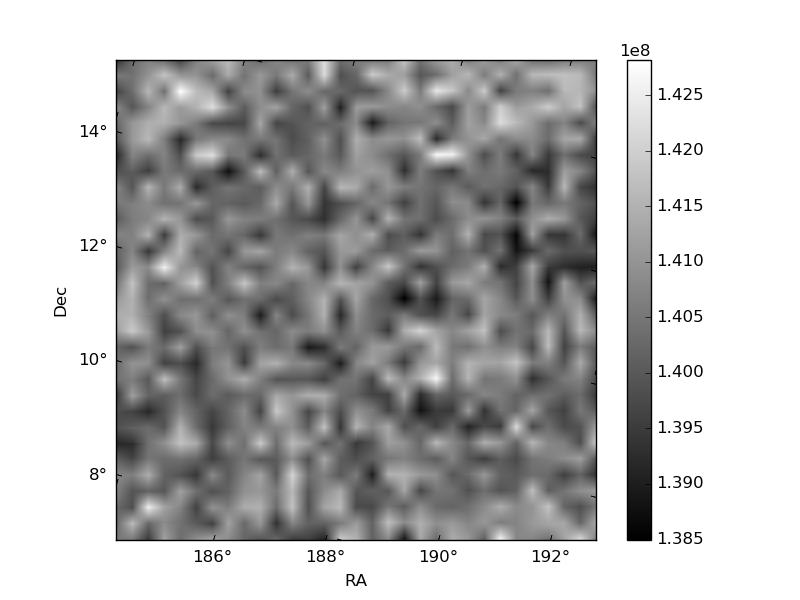
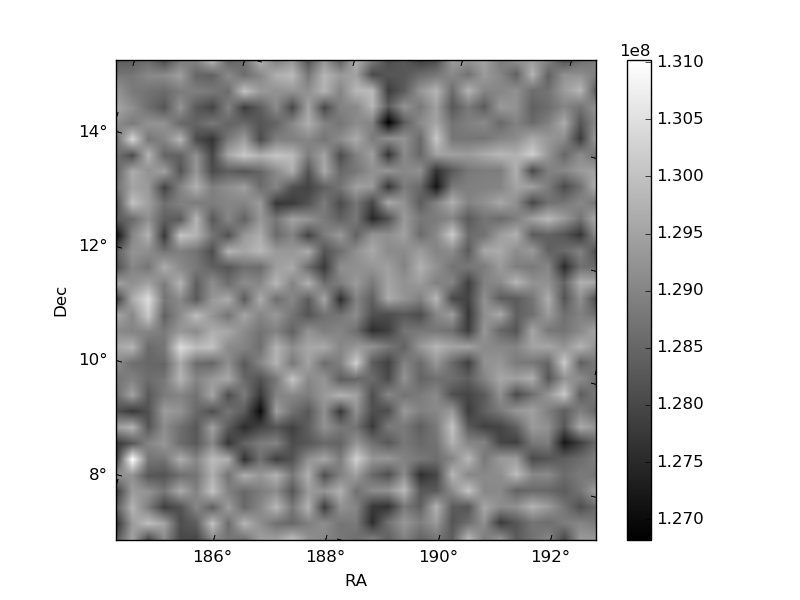
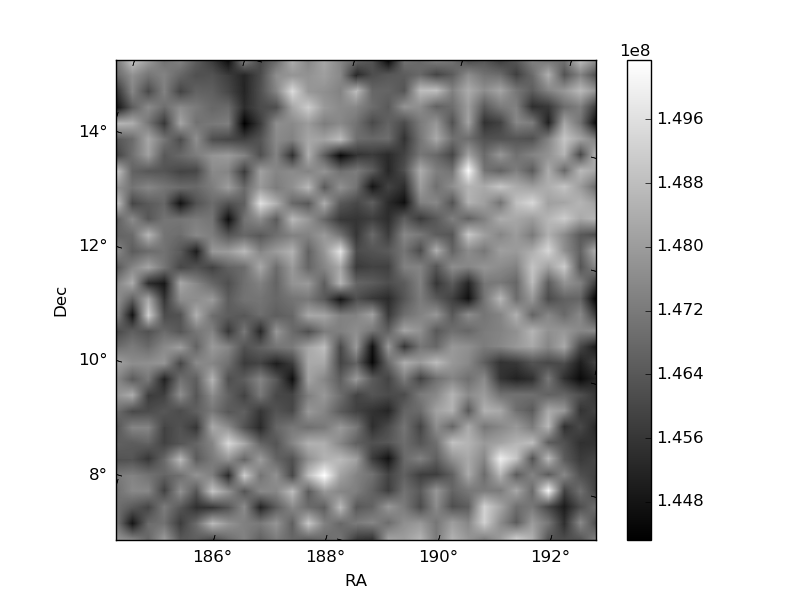
Histogram calculated using DETX and DETY for each event in the final _common_clean file
| Quadrant A | 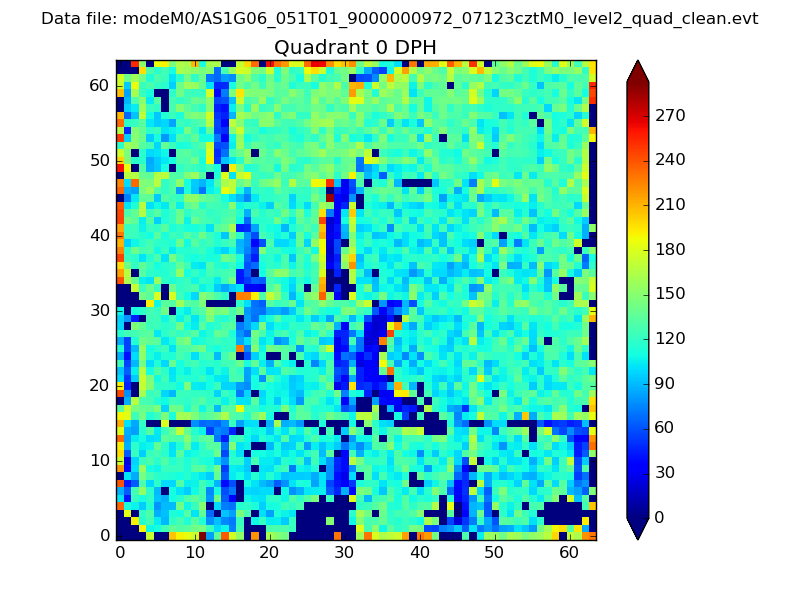 |
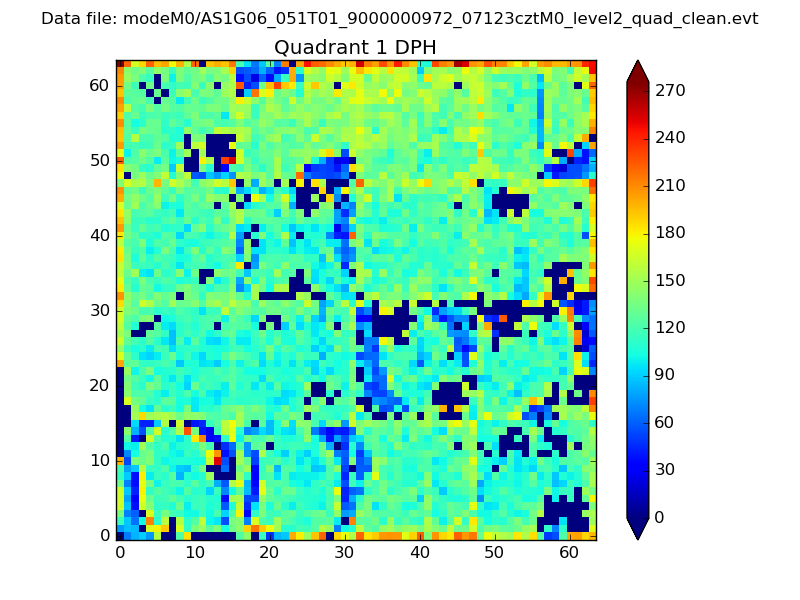 |
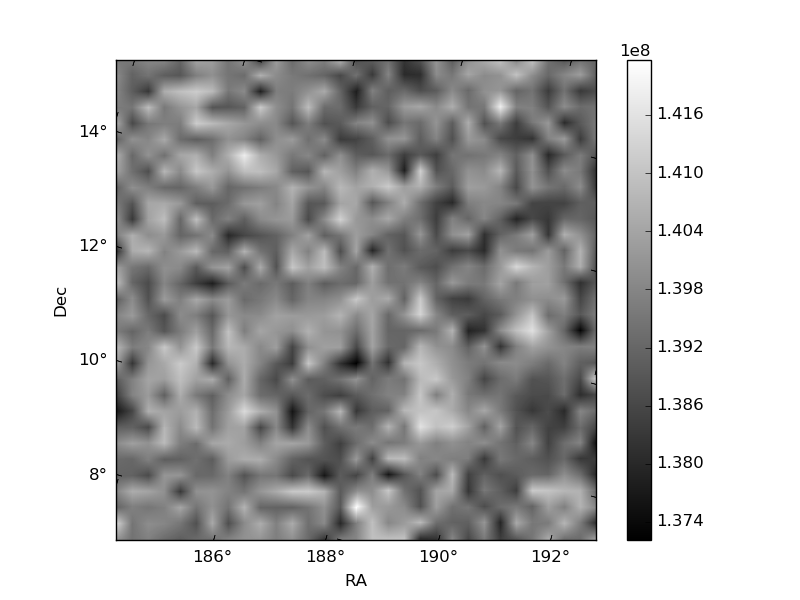
Quadrant B |
|---|---|---|---|
| Quadrant D | 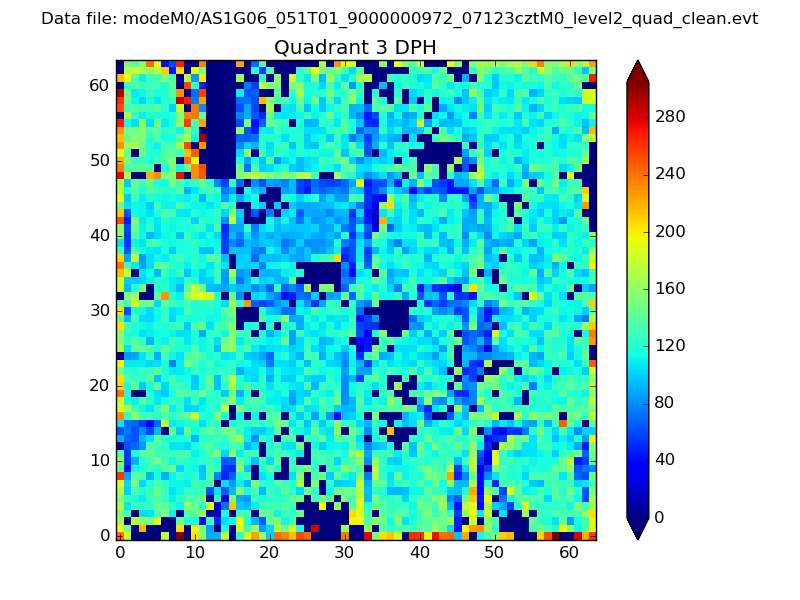 |
 |
Quadrant C |
| Plot type | Count rate plots | Images |
|---|---|---|
| Comparison with Poisson distribution Blue bars denote a histogram of data divided into 1 sec bins. Red curve is a Poisson curve with rate = median count rate of data. |
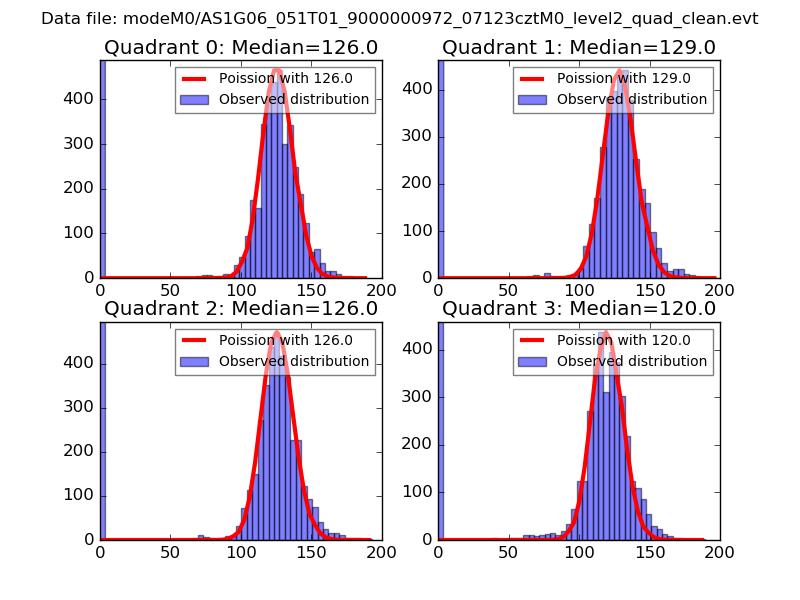 |
 |
| Quadrant-wise count rates Data is divided into 100 sec bins |
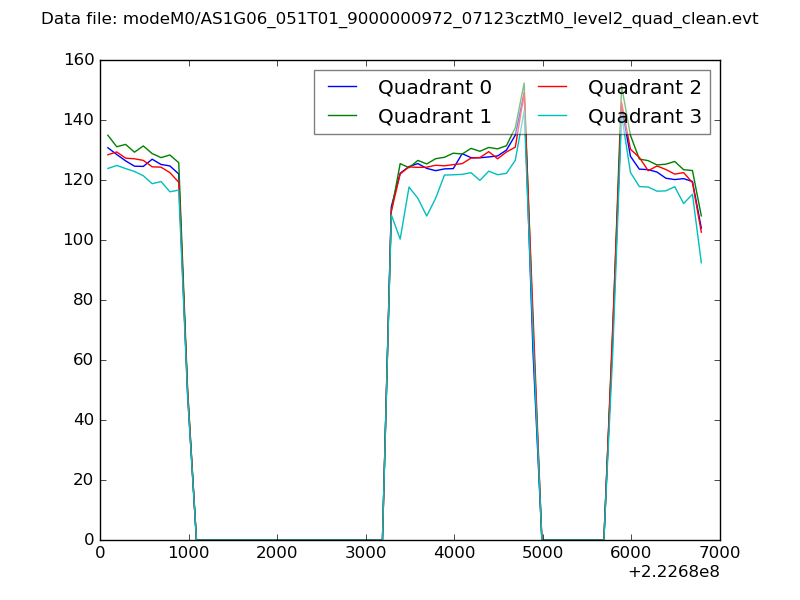 |
|
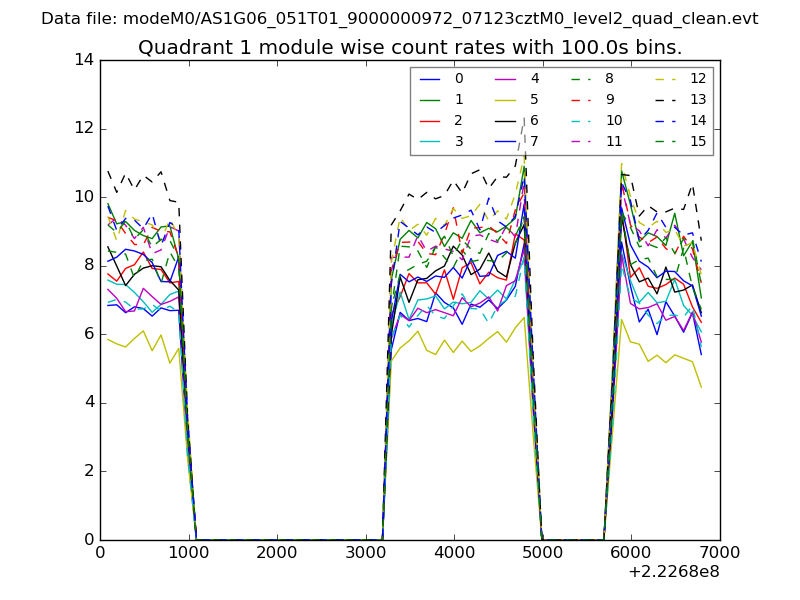
| Module-wise count rates for Quadrant A Data is divided into 100 sec bins |
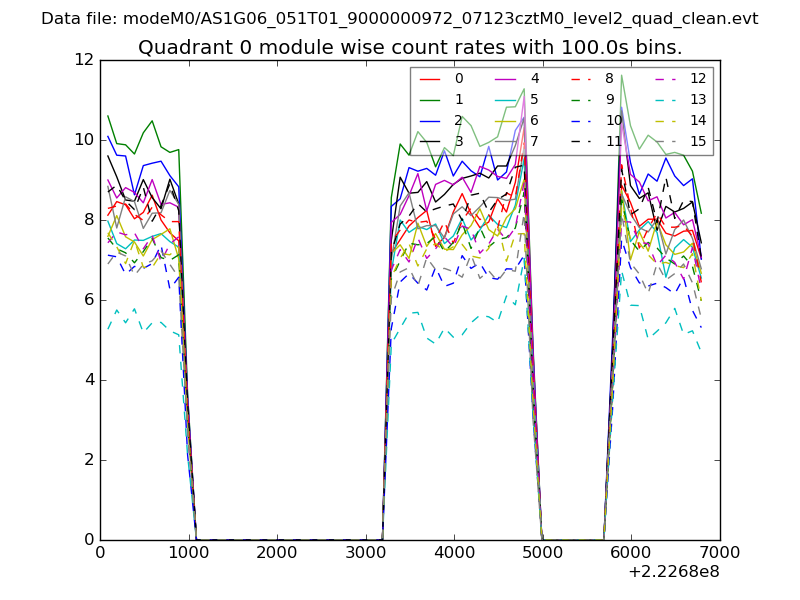 |
 |
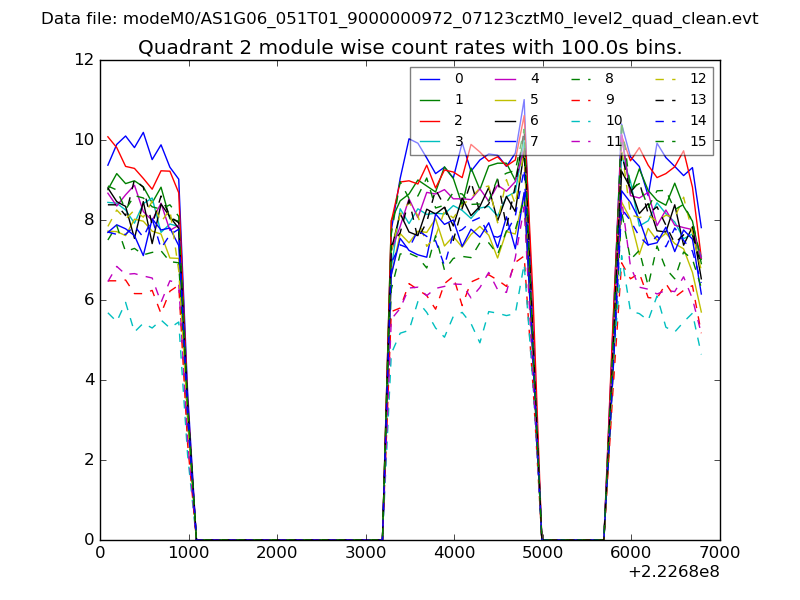
| Module-wise count rates for Quadrant B Data is divided into 100 sec bins |
 |
 |
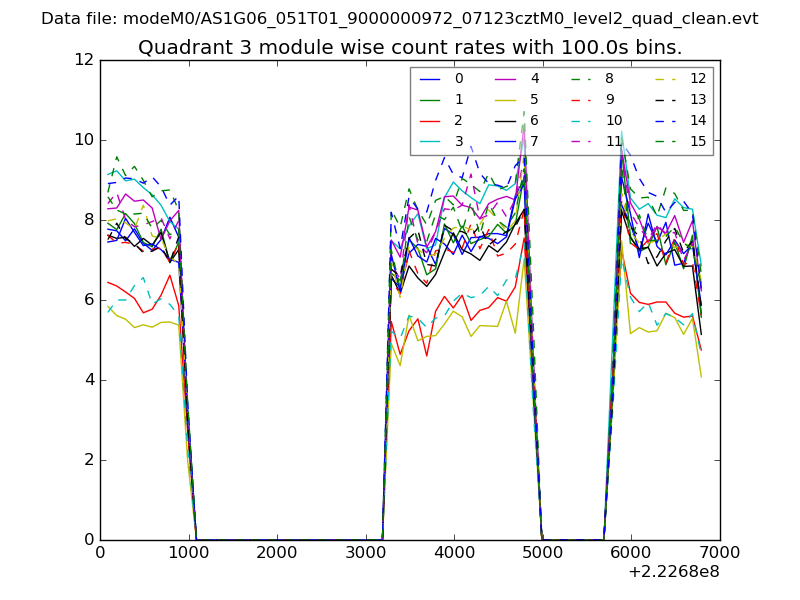
| Module-wise count rates for Quadrant C Data is divided into 100 sec bins |
 |
 |
| Module-wise count rates for Quadrant D Data is divided into 100 sec bins |
 |
 |
| Parameter | Plot |
|---|---|
| CZT HV Monitor | 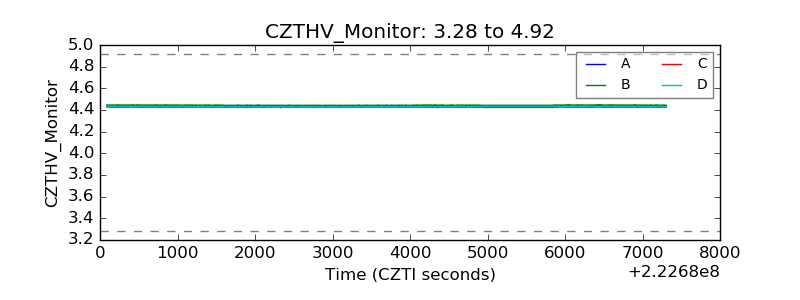 |
| D_VDD | 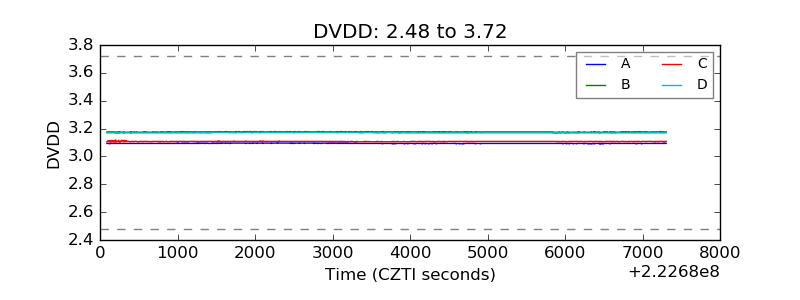 |
| Temperature 1 | 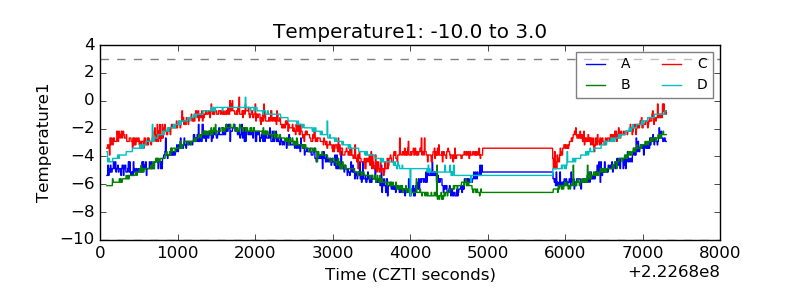 |
| Veto HV Monitor | 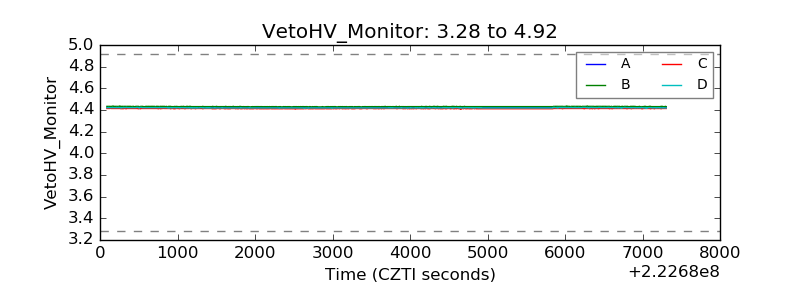 |
| Veto LLD | 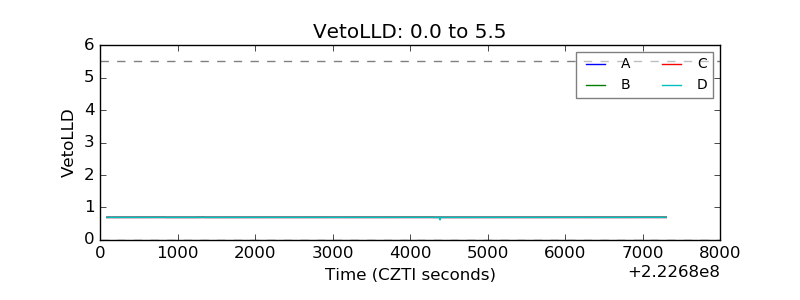 |
| Alpha Counter | 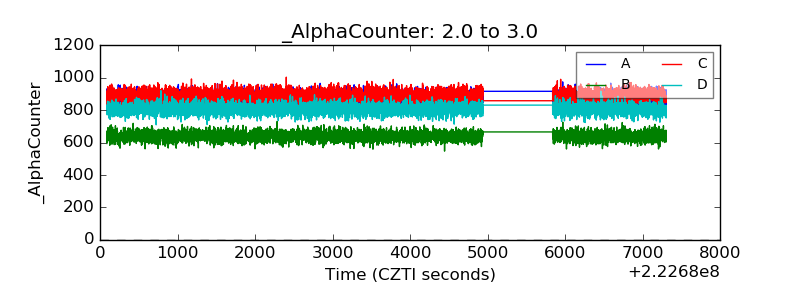 |
| _CPM_Rate | 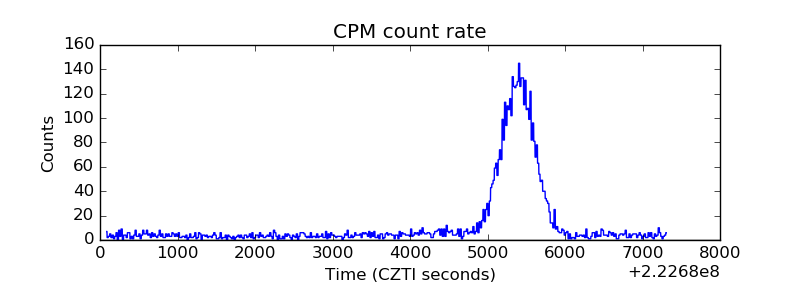 |
| CZT Counter | 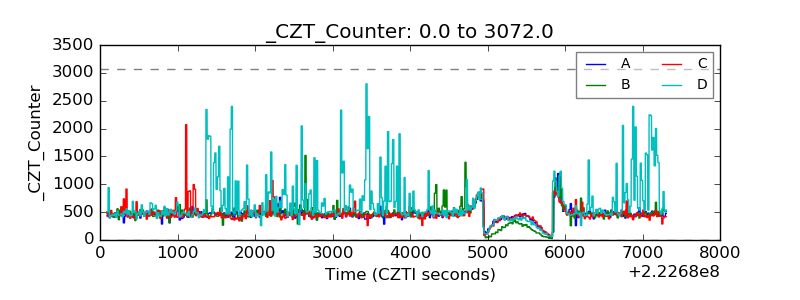 |
| +2.5 Volts monitor |  |
| +5 Volts monitor |  |
| _ROLL_ROT | 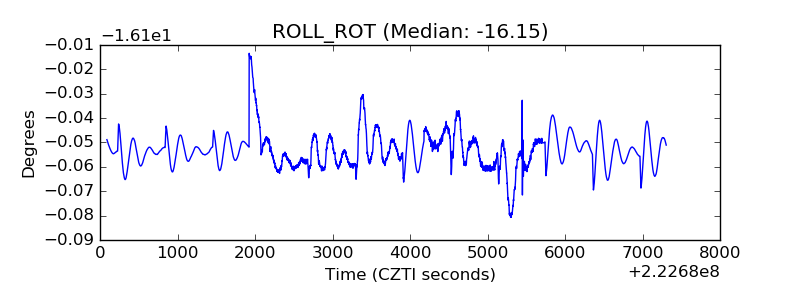 |
| _Roll_DEC | 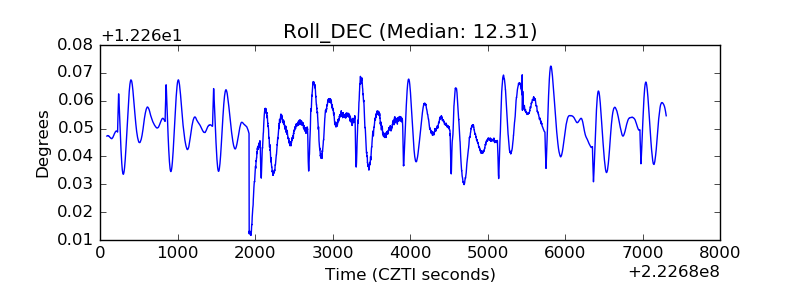 |
| _Roll_RA | 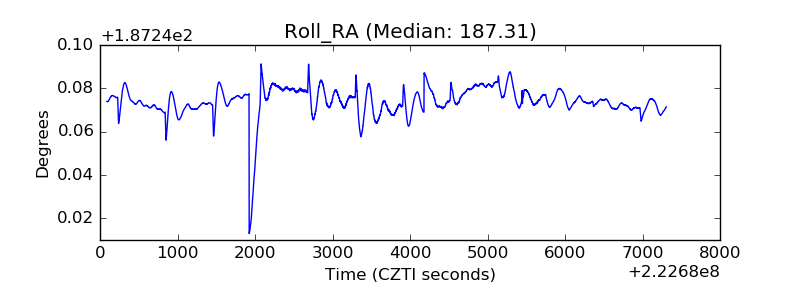 |
| Veto Counter | 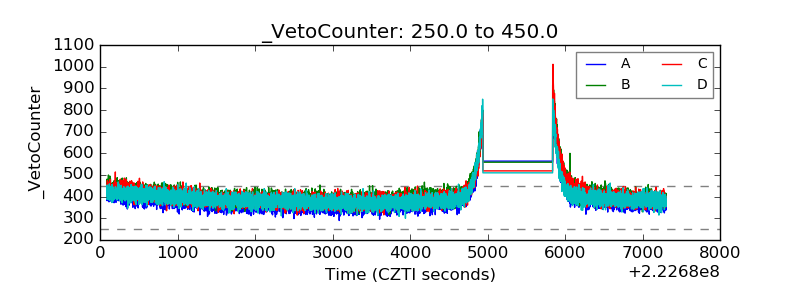 |