| Param | Original file | Final file |
|---|---|---|
| Filename | modeM0/AS1G06_051T01_9000000972_07124cztM0_level2.evt | modeM0/AS1G06_051T01_9000000972_07124cztM0_level2_quad_clean.evt |
| Size (bytes) | 476,645,760 | 72,869,760 |
| Size | 454.6 MB | 69.5 MB |
| Events in quadrant A | 3,136,452 | 435,520 |
| Events in quadrant B | 3,581,837 | 442,866 |
| Events in quadrant C | 3,118,980 | 437,382 |
| Events in quadrant D | 4,138,581 | 419,533 |
| Mode M9 | |||
|---|---|---|---|
| Quadrant | BADHDUFLAG | Total packets | Discarded packets |
| A | 0 | 5 | 0 |
| B | 0 | 5 | 0 |
| C | 0 | 5 | 0 |
| D | 0 | 5 | 0 |
| Mode SS | |||
|---|---|---|---|
| Quadrant | BADHDUFLAG | Total packets | Discarded packets |
| A | 0 | 136 | 0 |
| B | 0 | 136 | 0 |
| C | 0 | 136 | 0 |
| D | 0 | 136 | 0 |
| Mode M0 | |||
|---|---|---|---|
| Quadrant | BADHDUFLAG | Total packets | Discarded packets |
| A | 0 | 13879 | 2 |
| B | 0 | 14933 | 1 |
| C | 0 | 13979 | 1 |
| D | 0 | 16544 | 1 |
| Quadrant | Total seconds | Saturated seconds | Saturation percentage |
|---|---|---|---|
| A | 6756 | 124 | 1.835406% |
| B | 6756 | 148 | 2.190645% |
| C | 6756 | 107 | 1.583777% |
| D | 6756 | 300 | 4.440497% |
Noise dominated data is calculated using 1-second bins in cleaned event files. If a bin has >2000 counts, and if more than 50% of those come from <1% of pixels, then it is considered to be noise-dominated and hence unusable.
| Quadrant | # 1 sec bins | Bins with >0 counts | Bins with >2000 counts | High rate bins dominated by noise | Noise dominated (total time) | Noise dominated (detector-on time) | Marked lightcurve |
|---|---|---|---|---|---|---|---|
| A | 7321 | 6756 | 0 | 0 | 0.00% | 0.00% | 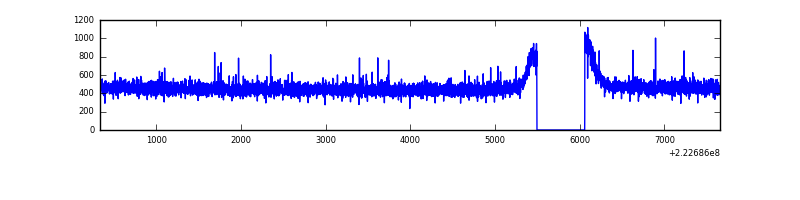 |
| B | 7321 | 6756 | 25 | 25 | 0.34% | 0.37% | 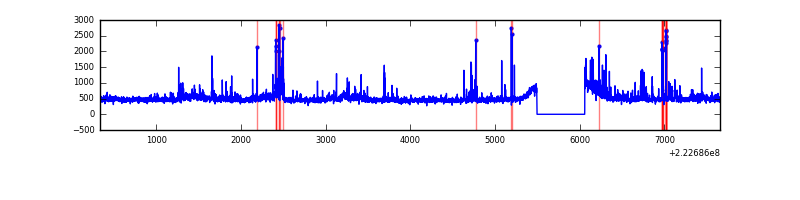 |
| C | 7321 | 6756 | 1 | 1 | 0.01% | 0.01% | 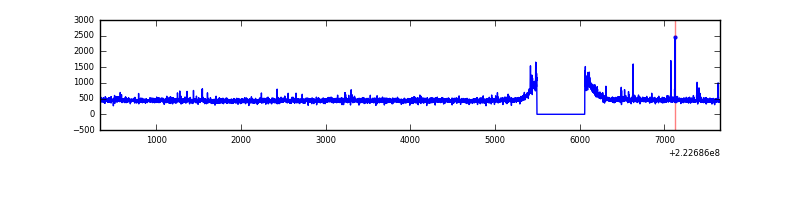 |
| D | 7321 | 6756 | 152 | 152 | 2.08% | 2.25% | 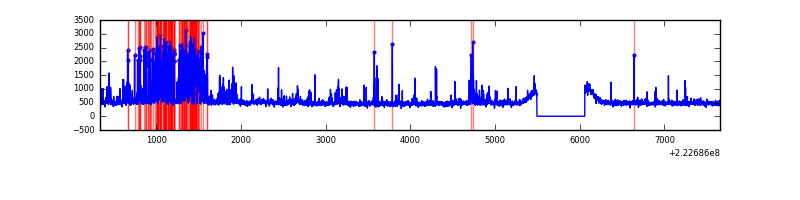 |
Top three noisy pixels from each quadrant. If the there are fewer than three noisy pixels in the level2.evt file, extra rows are filled as -1
| Pixel properties | Quadrant properties | ||||||
|---|---|---|---|---|---|---|---|
| Quadrant | DetID | PixID | Counts | Sigma | Mean | Median | Sigma |
| A | 15 | 223 | 8115 | 43.9 | 808 | 789 | 166.9 |
| A | 0 | 226 | 7748 | 41.7 | 808 | 789 | 166.9 |
| A | 12 | 194 | 7242 | 38.67 | 808 | 789 | 166.9 |
| B | 0 | 219 | 146448 | 933.28 | 807 | 786 | 156.1 |
| B | 4 | 173 | 92559 | 588.0 | 807 | 786 | 156.1 |
| B | 4 | 251 | 65117 | 412.18 | 807 | 786 | 156.1 |
| C | 4 | 254 | 58962 | 317.23 | 783 | 787 | 183.4 |
| C | 13 | 61 | 6042 | 28.66 | 783 | 787 | 183.4 |
| C | 1 | 16 | 5464 | 25.5 | 783 | 787 | 183.4 |
| D | 2 | 216 | 783283 | 4048.24 | 779 | 753 | 193.3 |
| D | 8 | 195 | 299323 | 1544.58 | 779 | 753 | 193.3 |
| D | 13 | 137 | 64987 | 332.3 | 779 | 753 | 193.3 |
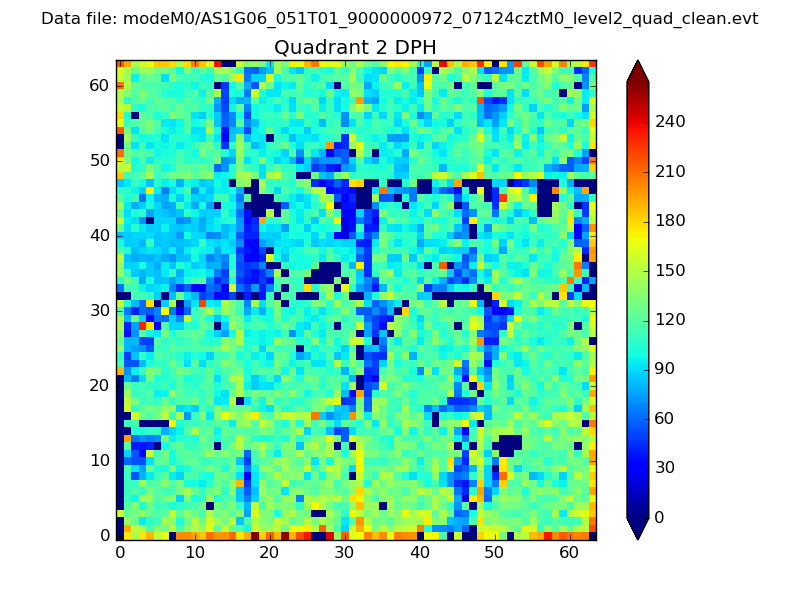
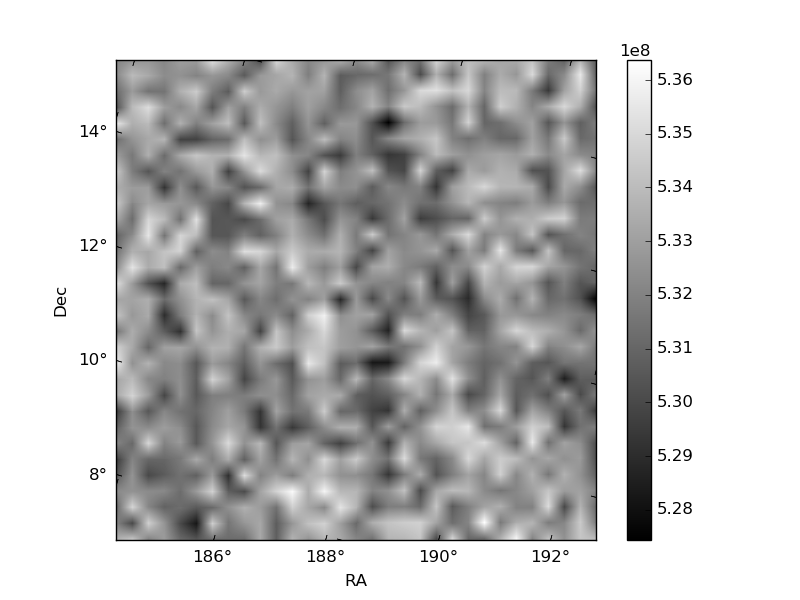
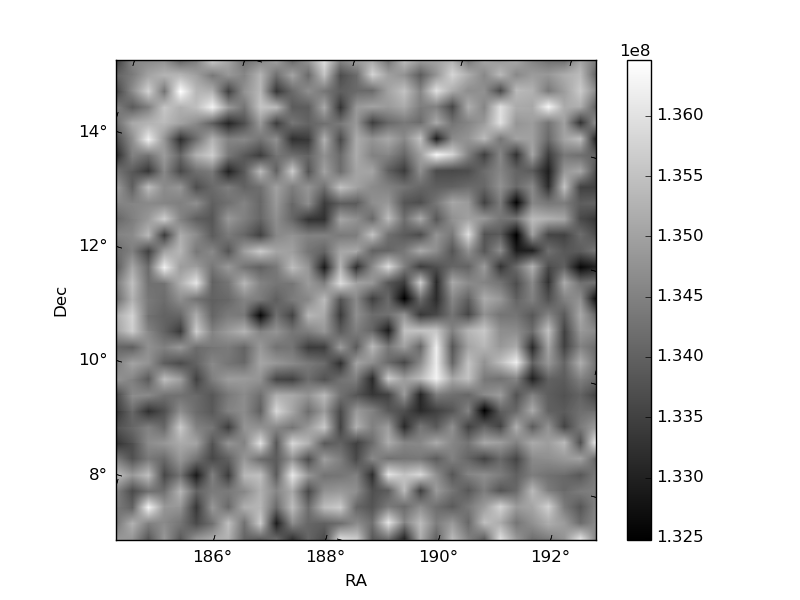
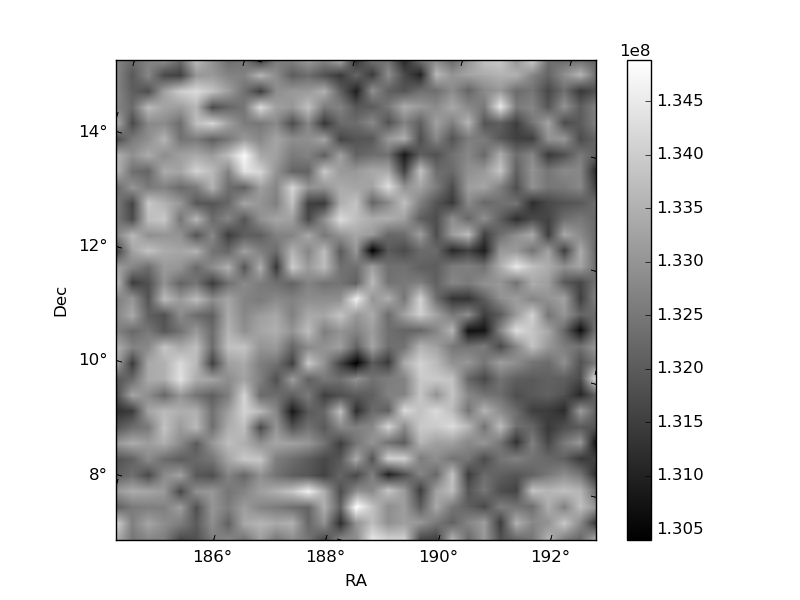
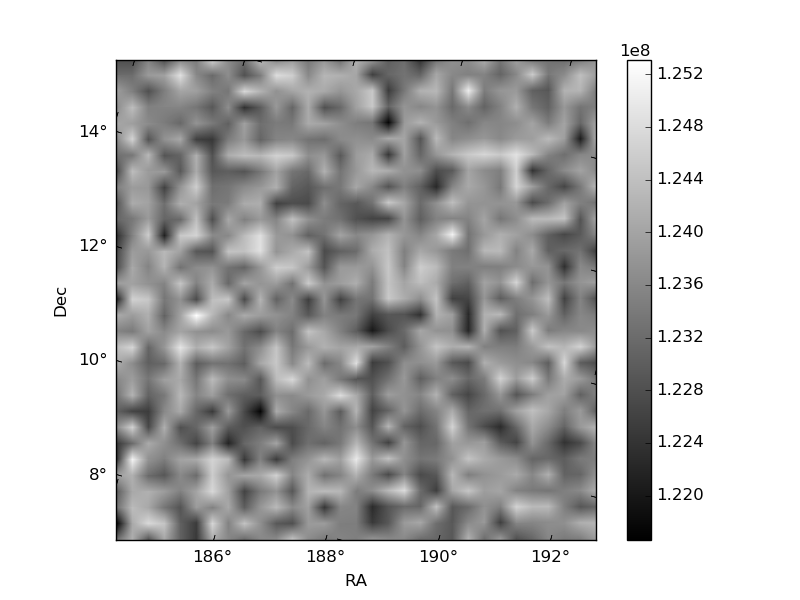
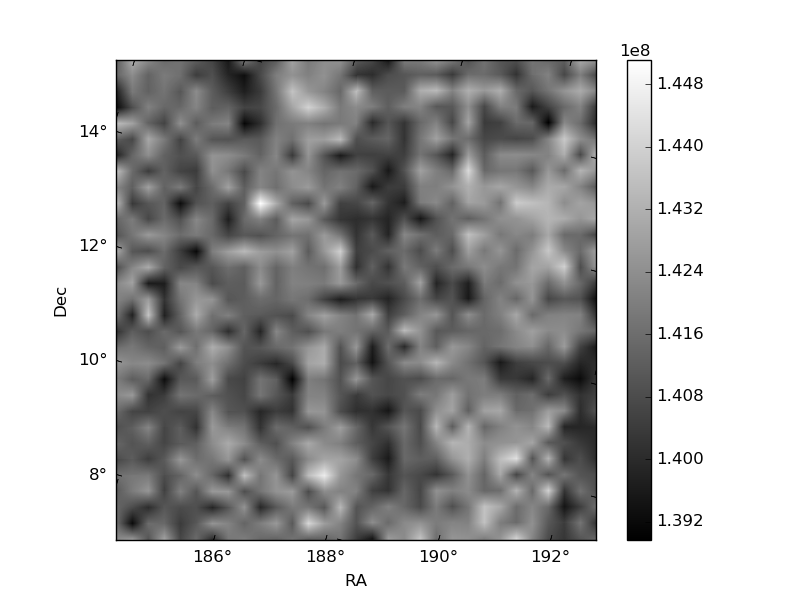
Histogram calculated using DETX and DETY for each event in the final _common_clean file
| Quadrant A | 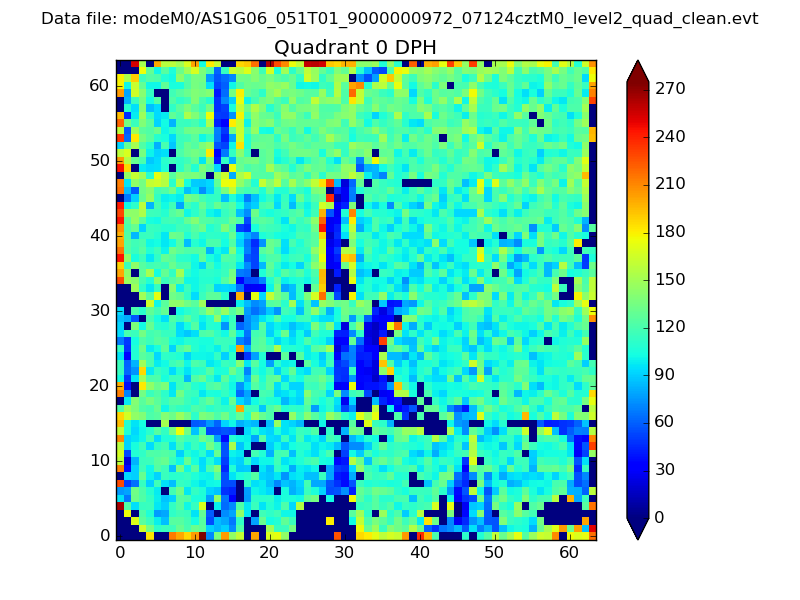 |
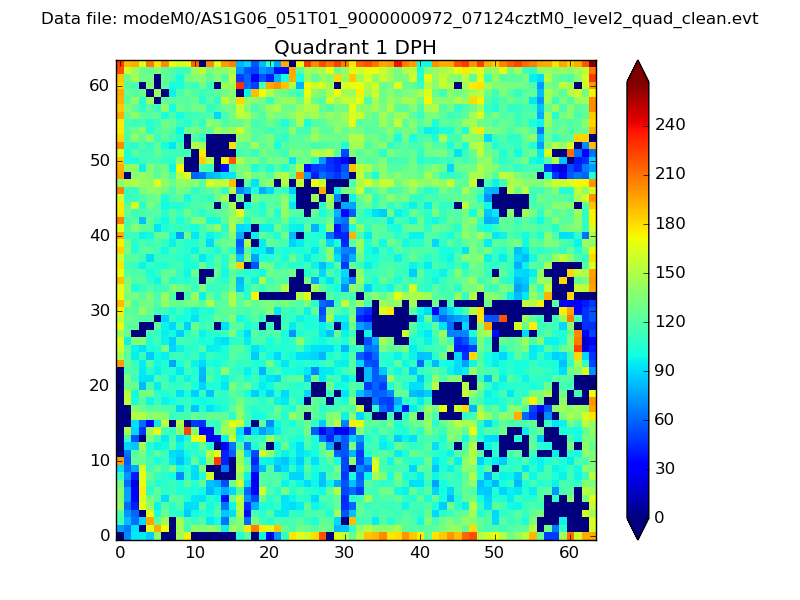 |
Quadrant B |
|---|---|---|---|
| Quadrant D | 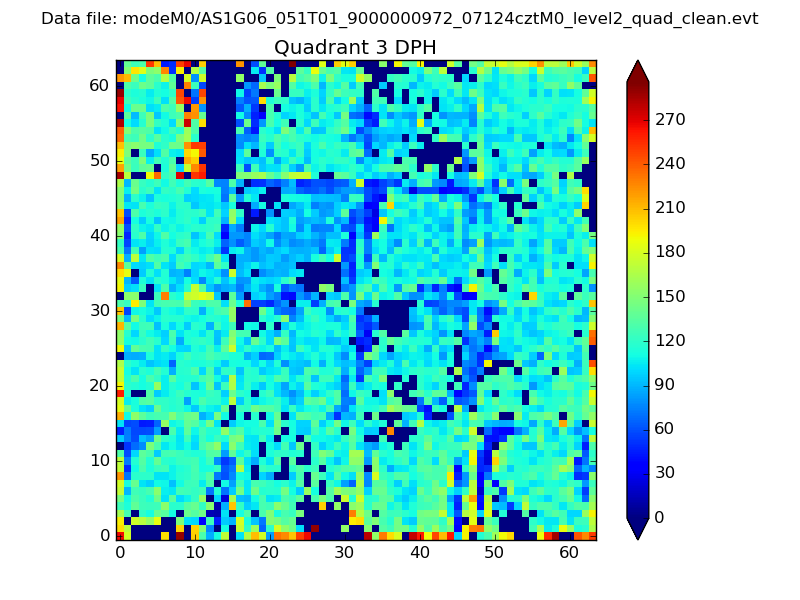 |
 |
Quadrant C |
| Plot type | Count rate plots | Images |
|---|---|---|
| Comparison with Poisson distribution Blue bars denote a histogram of data divided into 1 sec bins. Red curve is a Poisson curve with rate = median count rate of data. |
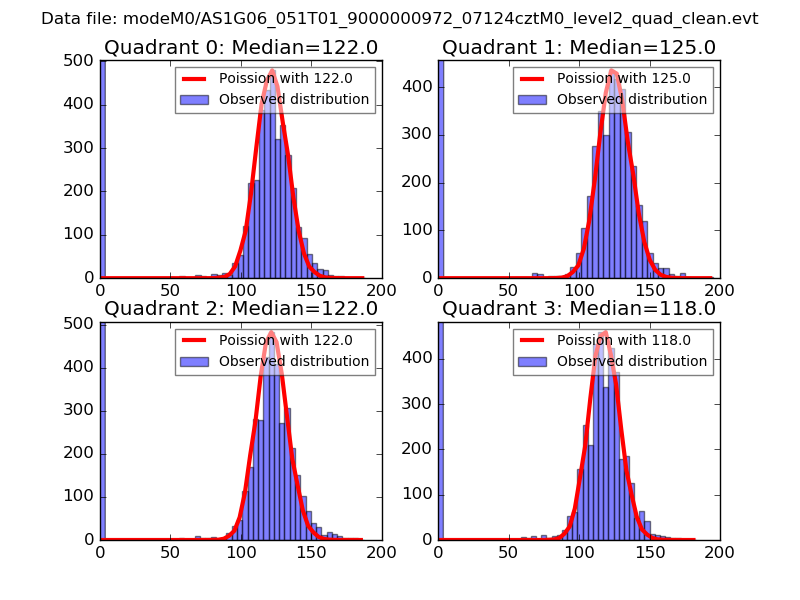 |
 |
| Quadrant-wise count rates Data is divided into 100 sec bins |
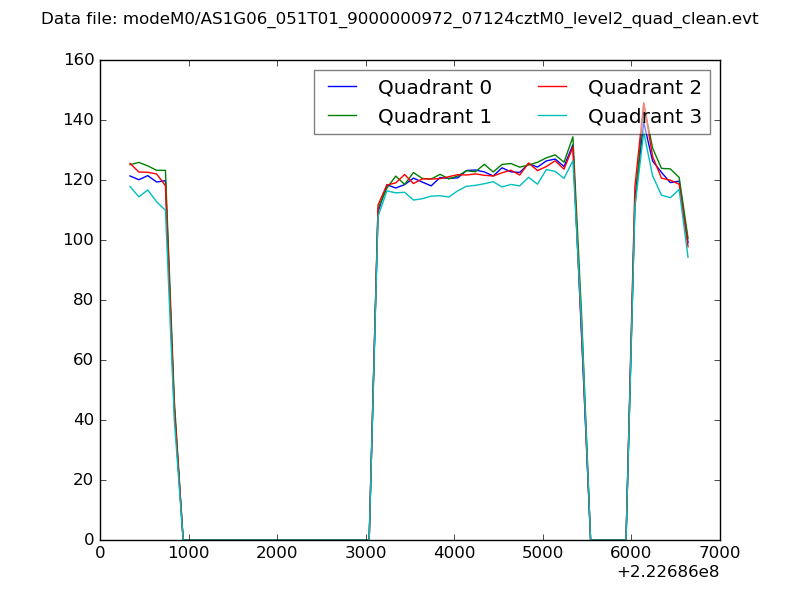 |
|
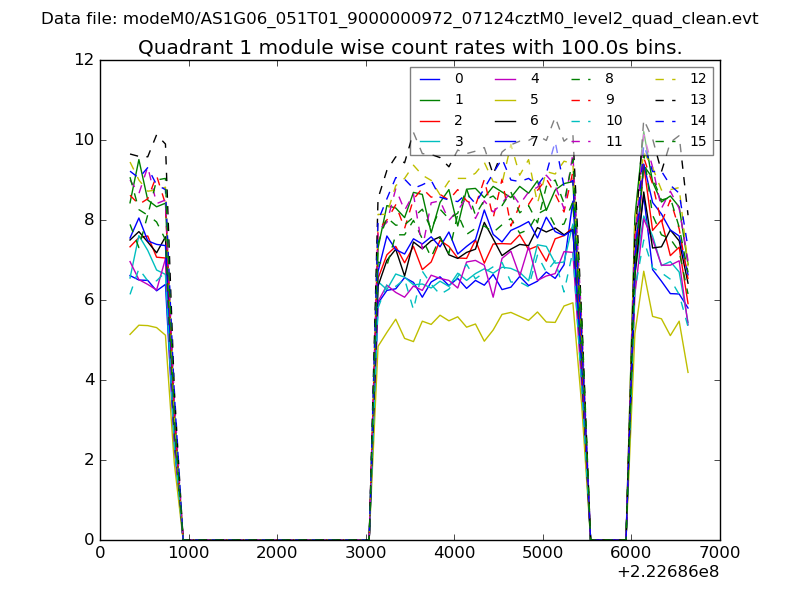
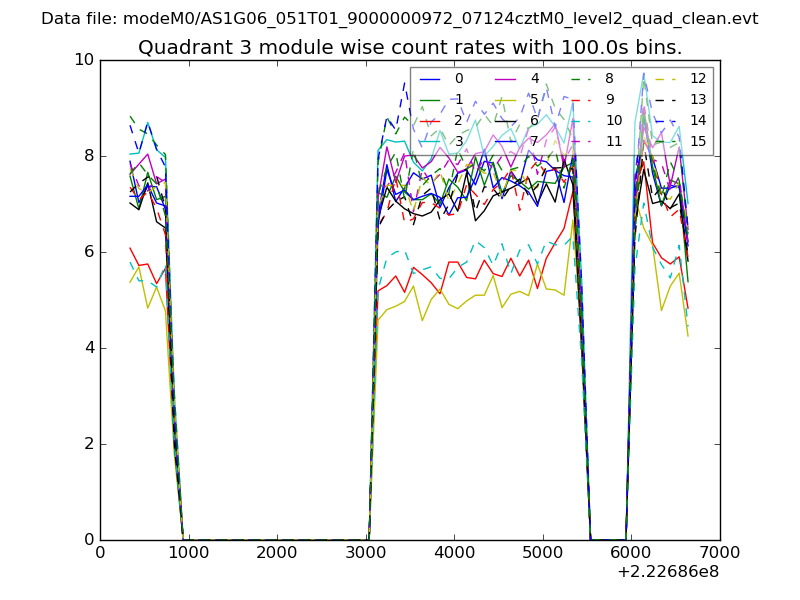
| Module-wise count rates for Quadrant A Data is divided into 100 sec bins |
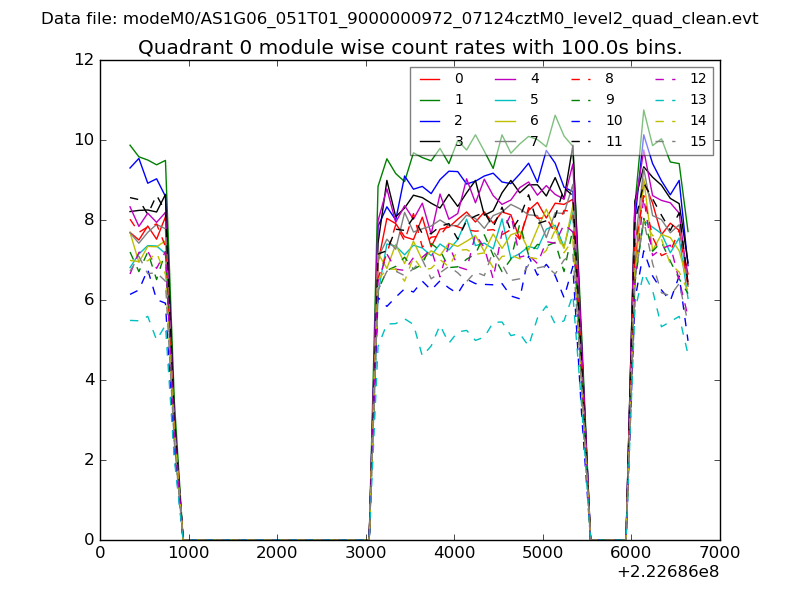 |
 |
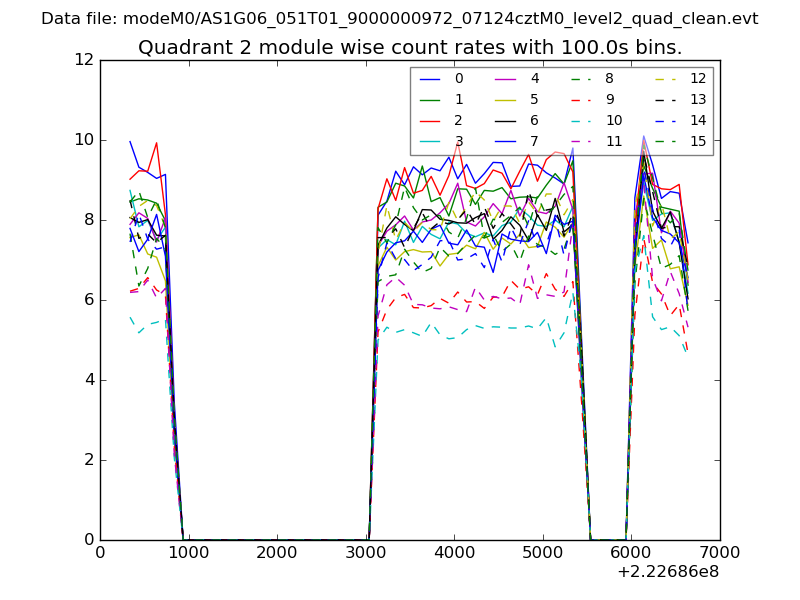
| Module-wise count rates for Quadrant B Data is divided into 100 sec bins |
 |
 |
| Module-wise count rates for Quadrant C Data is divided into 100 sec bins |
 |
 |
| Module-wise count rates for Quadrant D Data is divided into 100 sec bins |
 |
 |
| Parameter | Plot |
|---|---|
| CZT HV Monitor | 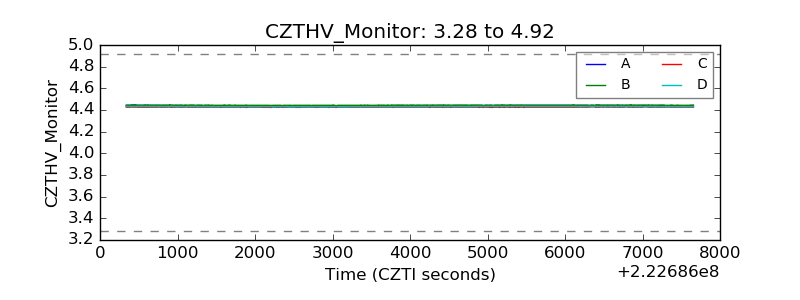 |
| D_VDD | 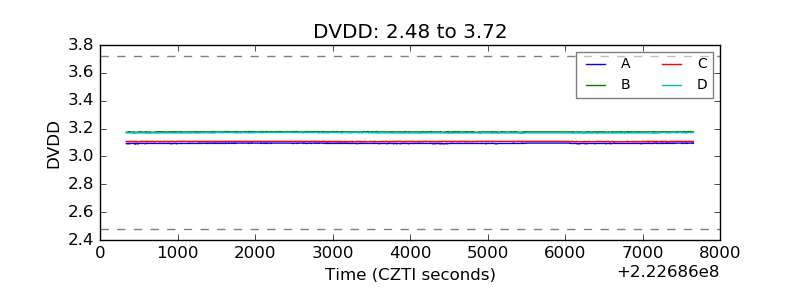 |
| Temperature 1 | 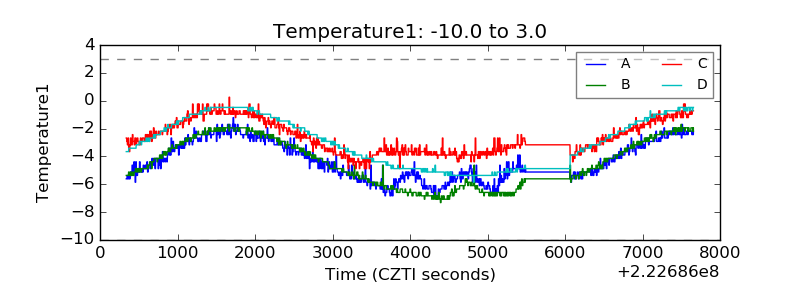 |
| Veto HV Monitor |  |
| Veto LLD | 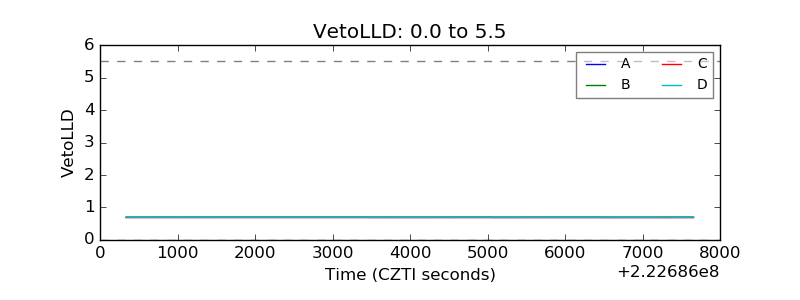 |
| Alpha Counter | 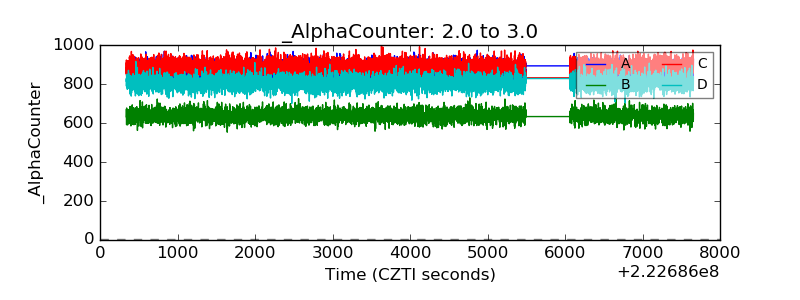 |
| _CPM_Rate | 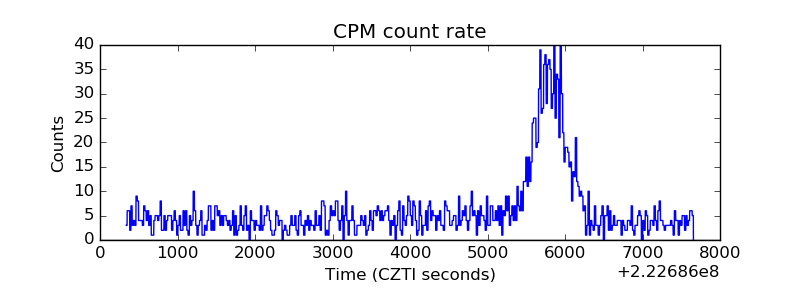 |
| CZT Counter | 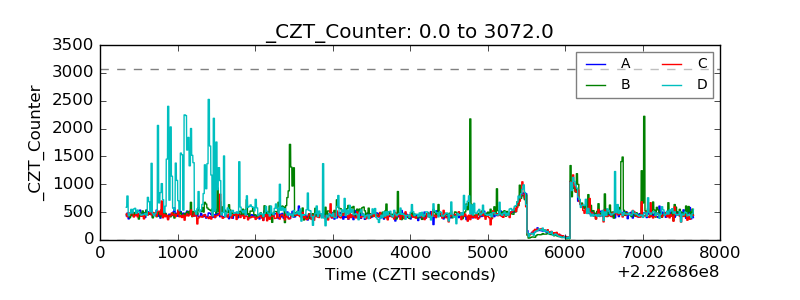 |
| +2.5 Volts monitor |  |
| +5 Volts monitor |  |
| _ROLL_ROT | 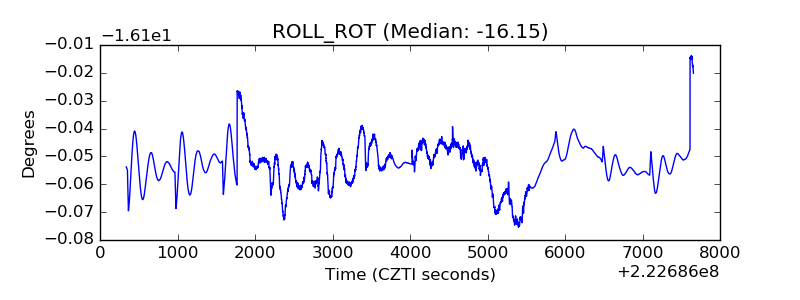 |
| _Roll_DEC | 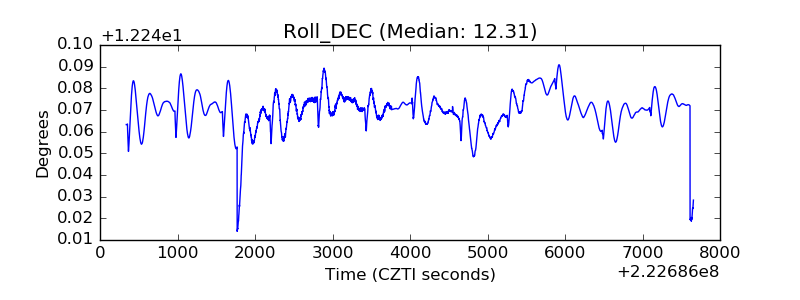 |
| _Roll_RA | 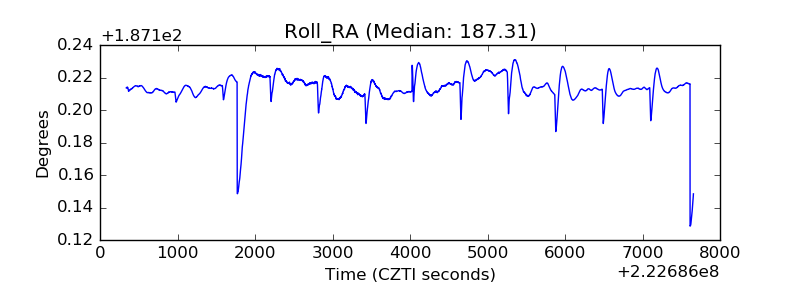 |
| Veto Counter | 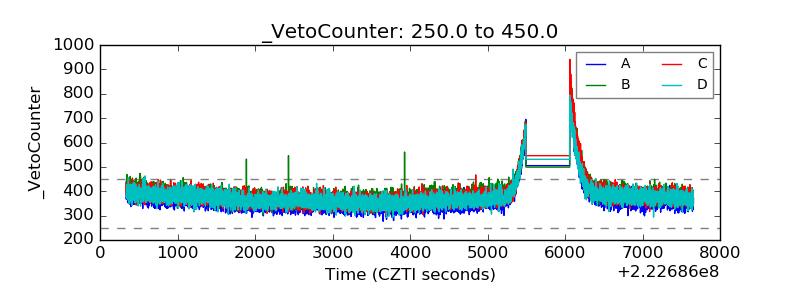 |