| Param | Original file | Final file |
|---|---|---|
| Filename | modeM0/AS1G06_051T01_9000000972_07125cztM0_level2.evt | modeM0/AS1G06_051T01_9000000972_07125cztM0_level2_quad_clean.evt |
| Size (bytes) | 546,341,760 | 82,848,960 |
| Size | 521.0 MB | 79.0 MB |
| Events in quadrant A | 3,699,597 | 495,404 |
| Events in quadrant B | 4,150,950 | 503,124 |
| Events in quadrant C | 3,754,483 | 495,789 |
| Events in quadrant D | 4,416,884 | 477,227 |
| Mode M9 | |||
|---|---|---|---|
| Quadrant | BADHDUFLAG | Total packets | Discarded packets |
| A | 0 | 3 | 0 |
| B | 0 | 3 | 0 |
| C | 0 | 3 | 0 |
| D | 0 | 4 | 0 |
| Mode SS | |||
|---|---|---|---|
| Quadrant | BADHDUFLAG | Total packets | Discarded packets |
| A | 0 | 156 | 0 |
| B | 0 | 156 | 0 |
| C | 0 | 156 | 0 |
| D | 0 | 156 | 0 |
| Mode M0 | |||
|---|---|---|---|
| Quadrant | BADHDUFLAG | Total packets | Discarded packets |
| A | 0 | 16209 | 2 |
| B | 0 | 17374 | 1 |
| C | 0 | 16555 | 1 |
| D | 0 | 18278 | 1 |
| Quadrant | Total seconds | Saturated seconds | Saturation percentage |
|---|---|---|---|
| A | 7721 | 229 | 2.965937% |
| B | 7721 | 270 | 3.496956% |
| C | 7721 | 221 | 2.862324% |
| D | 7721 | 256 | 3.315633% |
Noise dominated data is calculated using 1-second bins in cleaned event files. If a bin has >2000 counts, and if more than 50% of those come from <1% of pixels, then it is considered to be noise-dominated and hence unusable.
| Quadrant | # 1 sec bins | Bins with >0 counts | Bins with >2000 counts | High rate bins dominated by noise | Noise dominated (total time) | Noise dominated (detector-on time) | Marked lightcurve |
|---|---|---|---|---|---|---|---|
| A | 7911 | 7721 | 0 | 0 | 0.00% | 0.00% | 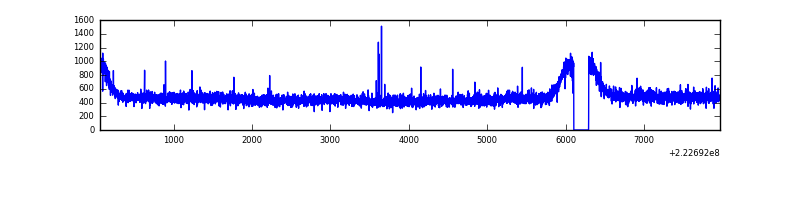 |
| B | 7911 | 7721 | 16 | 16 | 0.20% | 0.21% | 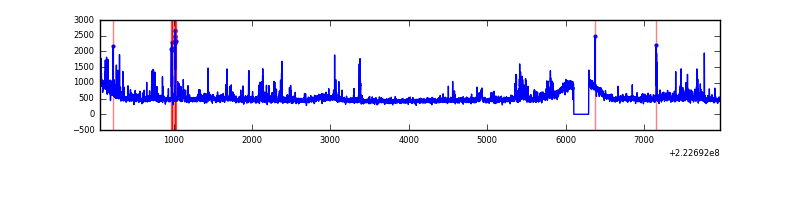 |
| C | 7911 | 7721 | 8 | 8 | 0.10% | 0.10% | 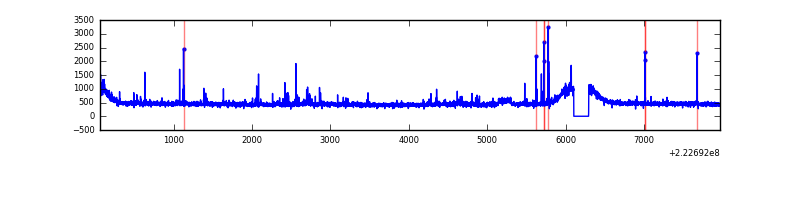 |
| D | 7911 | 7721 | 34 | 34 | 0.43% | 0.44% | 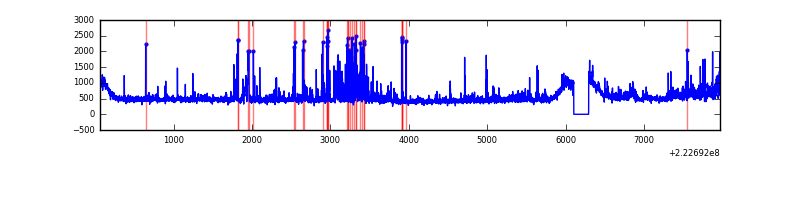 |
Top three noisy pixels from each quadrant. If the there are fewer than three noisy pixels in the level2.evt file, extra rows are filled as -1
| Pixel properties | Quadrant properties | ||||||
|---|---|---|---|---|---|---|---|
| Quadrant | DetID | PixID | Counts | Sigma | Mean | Median | Sigma |
| A | 8 | 15 | 34151 | 168.19 | 951 | 930 | 197.5 |
| A | 0 | 226 | 9006 | 40.89 | 951 | 930 | 197.5 |
| A | 12 | 194 | 8438 | 38.01 | 951 | 930 | 197.5 |
| B | 4 | 173 | 118819 | 638.31 | 947 | 924 | 184.7 |
| B | 0 | 214 | 94089 | 504.42 | 947 | 924 | 184.7 |
| B | 4 | 251 | 87815 | 470.45 | 947 | 924 | 184.7 |
| C | 4 | 254 | 118416 | 540.95 | 922 | 924 | 217.2 |
| C | 9 | 68 | 23660 | 104.68 | 922 | 924 | 217.2 |
| C | 10 | 22 | 9302 | 38.57 | 922 | 924 | 217.2 |
| D | 2 | 216 | 463145 | 2003.58 | 926 | 894 | 230.7 |
| D | 8 | 195 | 332899 | 1439.04 | 926 | 894 | 230.7 |
| D | 12 | 233 | 52945 | 225.61 | 926 | 894 | 230.7 |
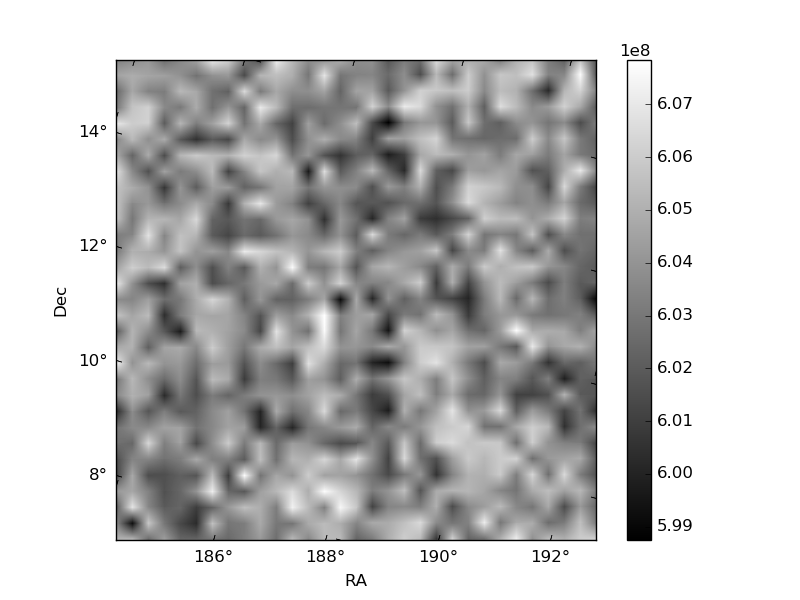
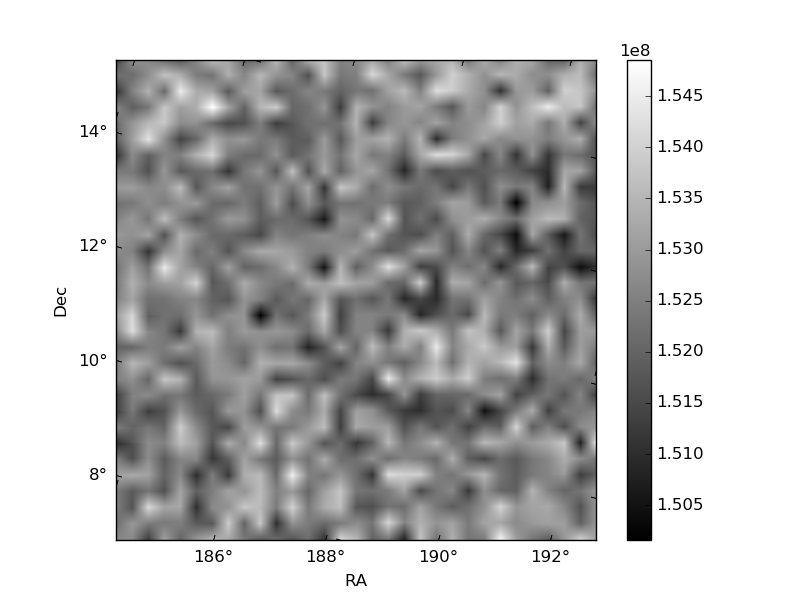
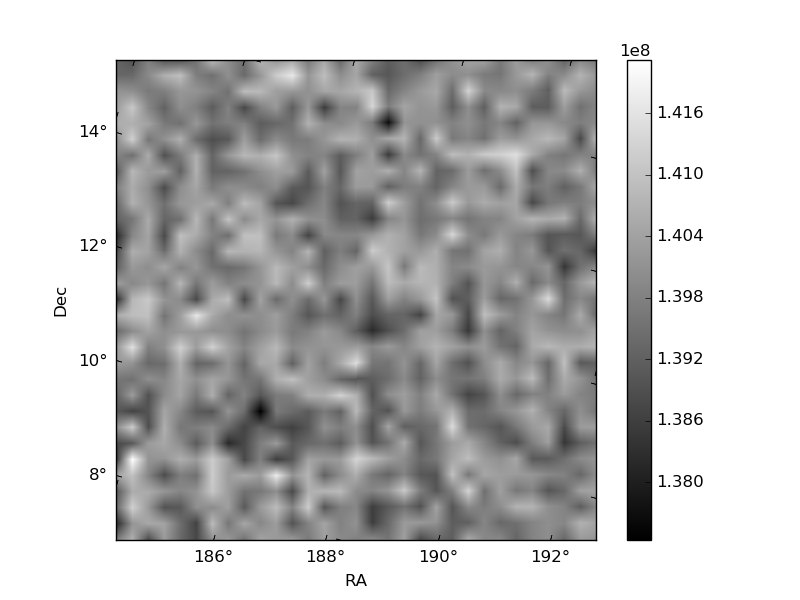
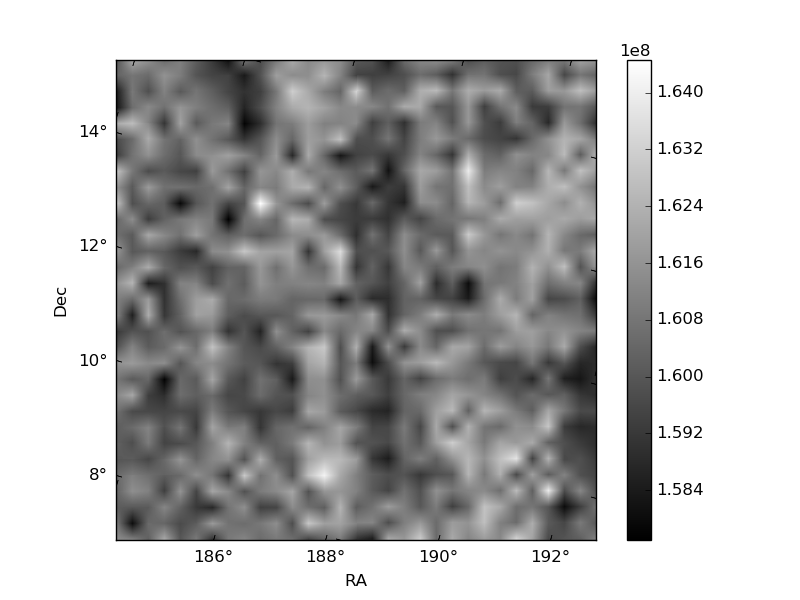
Histogram calculated using DETX and DETY for each event in the final _common_clean file
| Quadrant A | 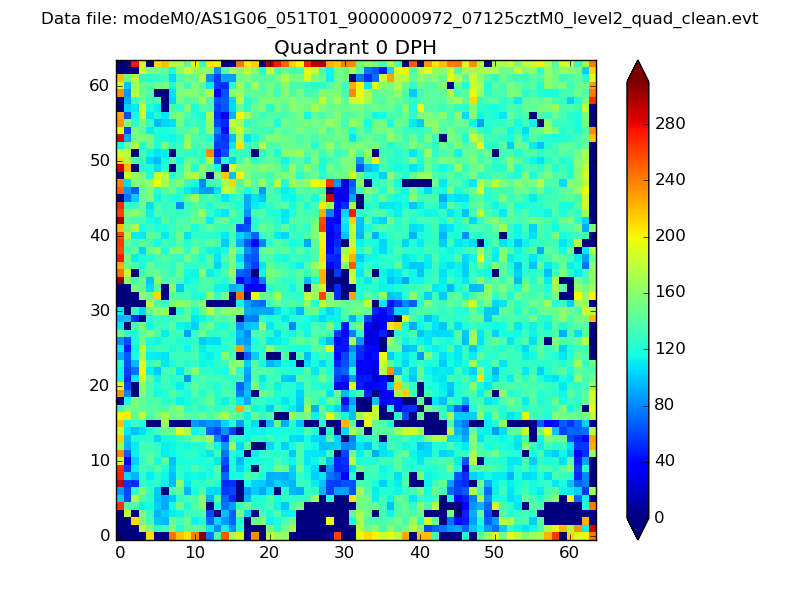 |
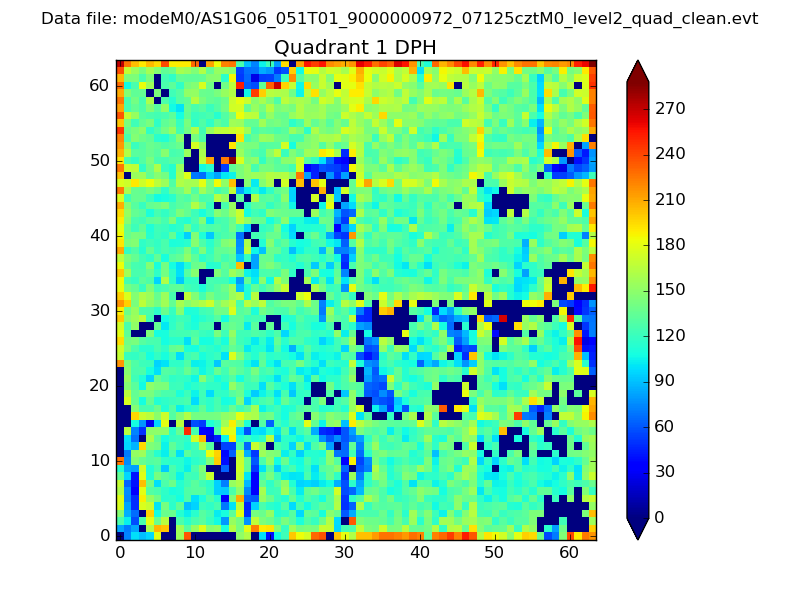 |
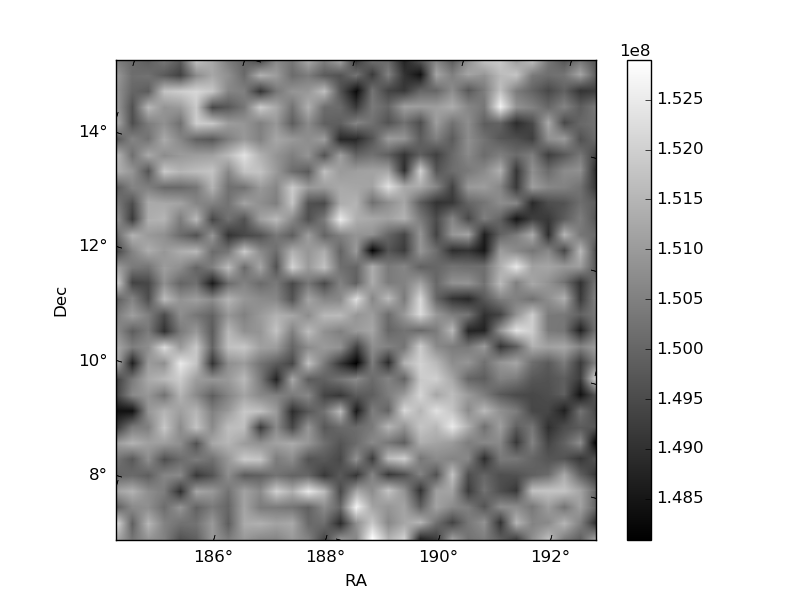
Quadrant B |
|---|---|---|---|
| Quadrant D | 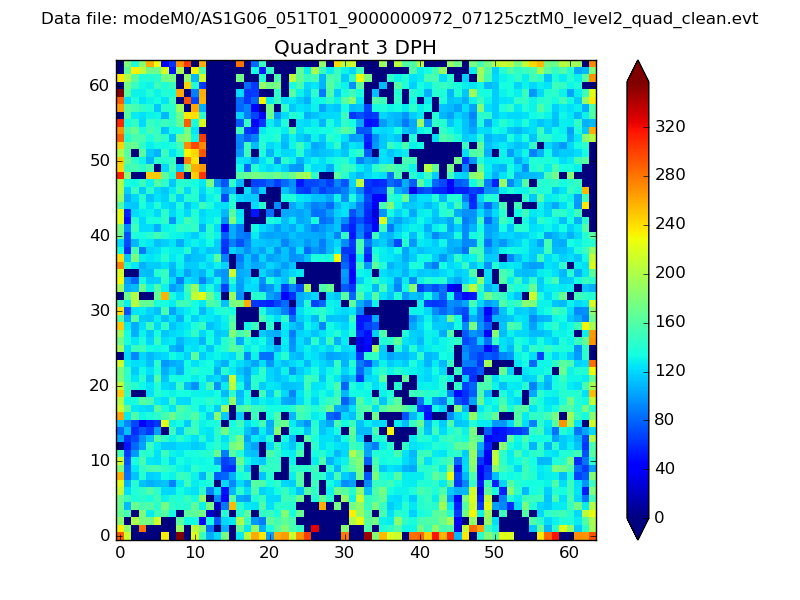 |
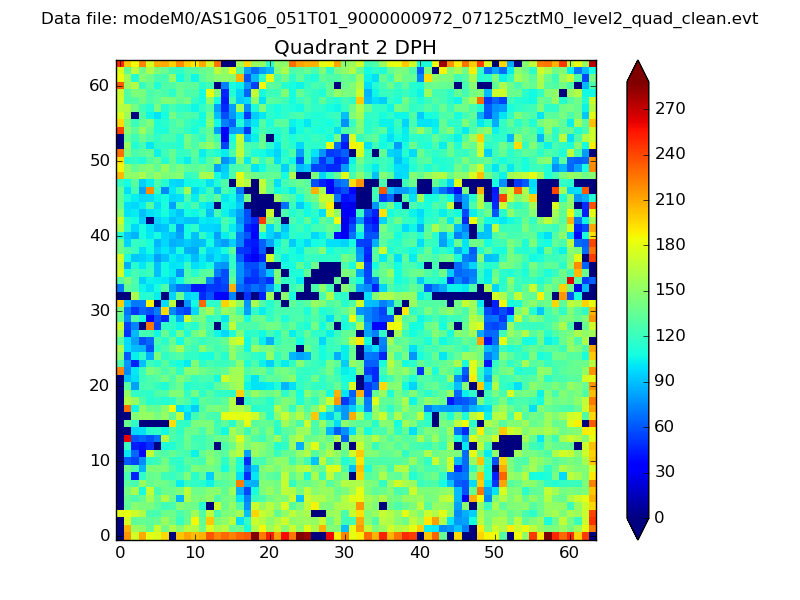 |
Quadrant C |
| Plot type | Count rate plots | Images |
|---|---|---|
| Comparison with Poisson distribution Blue bars denote a histogram of data divided into 1 sec bins. Red curve is a Poisson curve with rate = median count rate of data. |
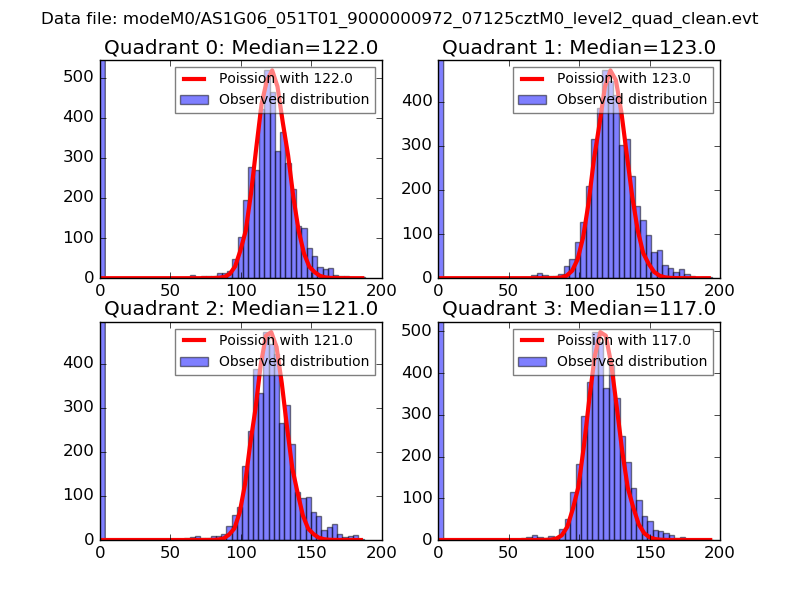 |
 |
| Quadrant-wise count rates Data is divided into 100 sec bins |
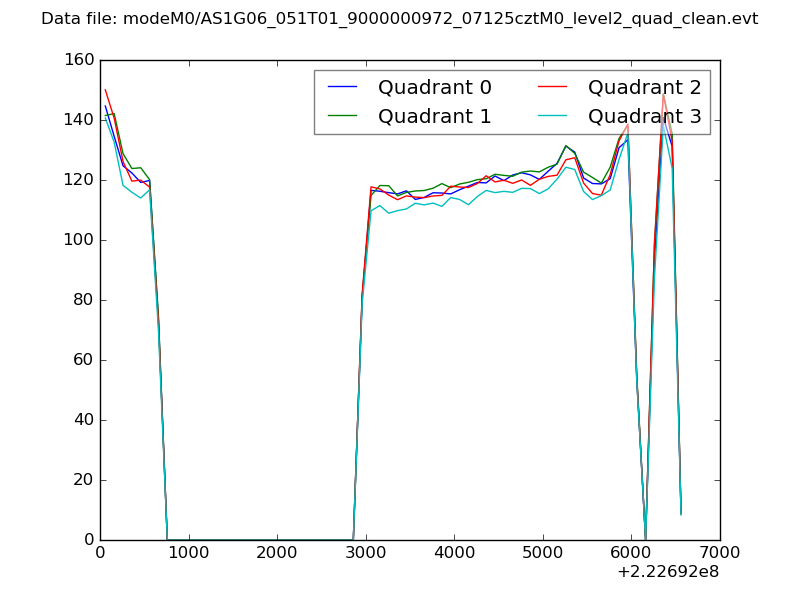 |
|
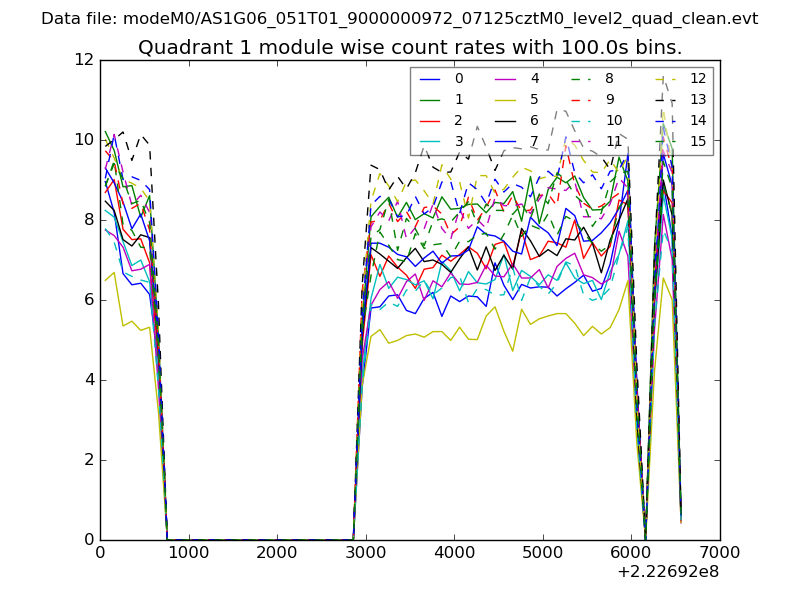
| Module-wise count rates for Quadrant A Data is divided into 100 sec bins |
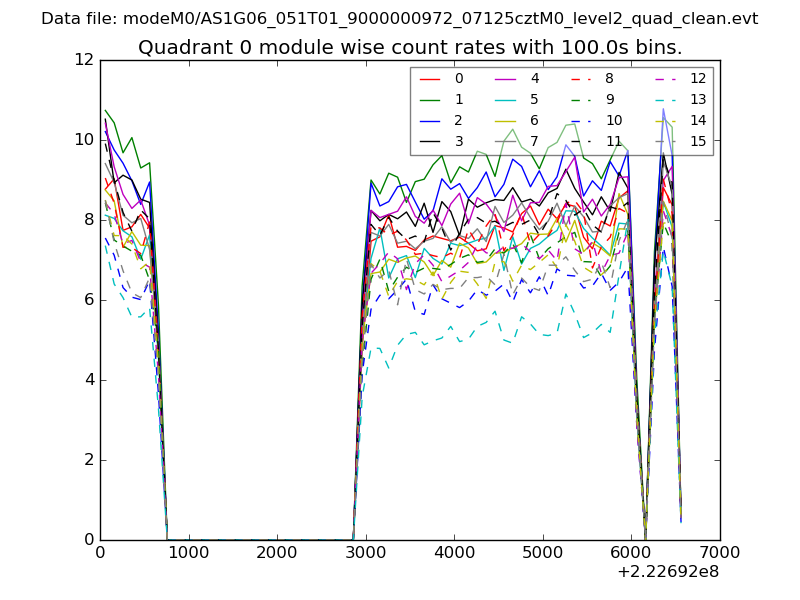 |
 |
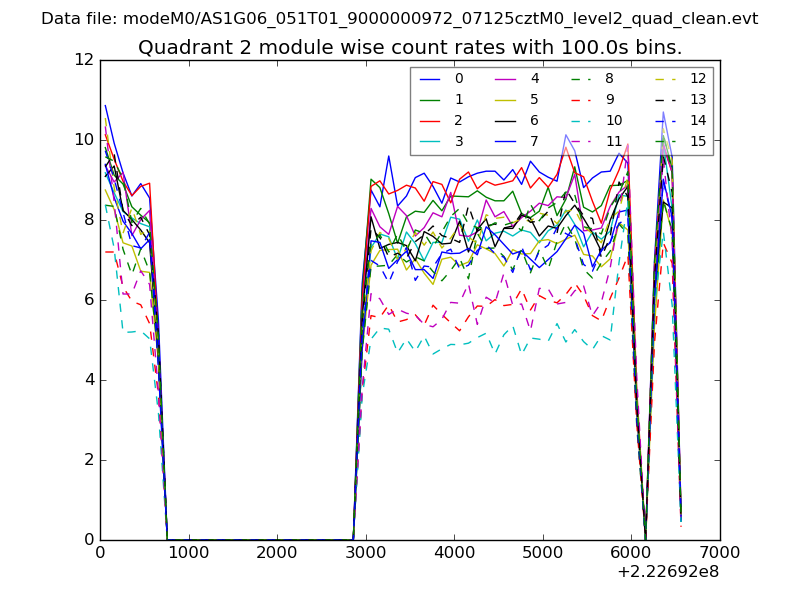
| Module-wise count rates for Quadrant B Data is divided into 100 sec bins |
 |
 |
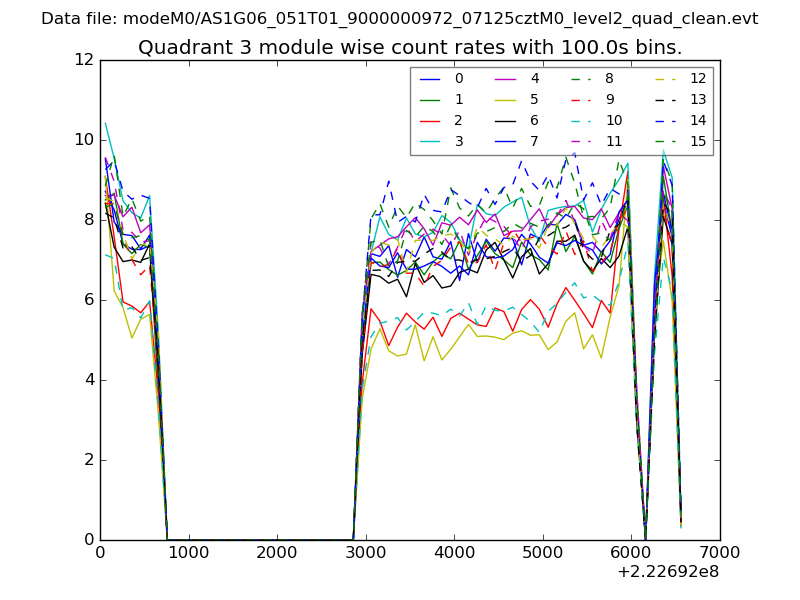
| Module-wise count rates for Quadrant C Data is divided into 100 sec bins |
 |
 |
| Module-wise count rates for Quadrant D Data is divided into 100 sec bins |
 |
 |
| Parameter | Plot |
|---|---|
| CZT HV Monitor | 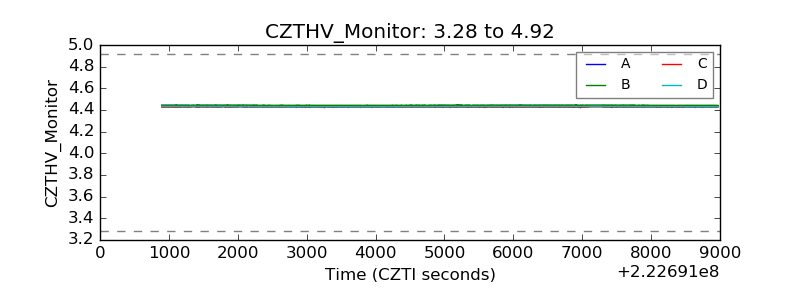 |
| D_VDD | 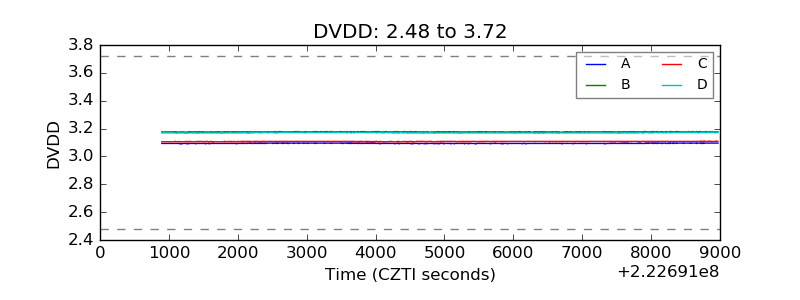 |
| Temperature 1 | 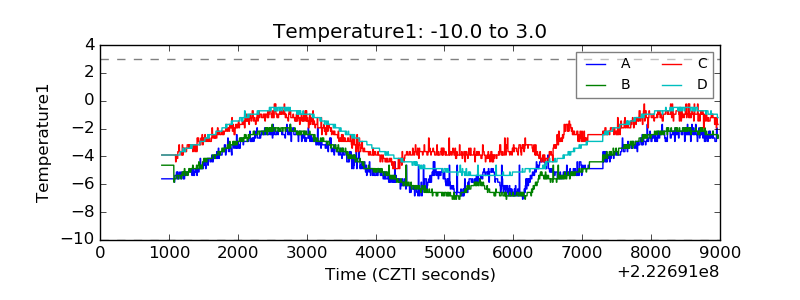 |
| Veto HV Monitor | 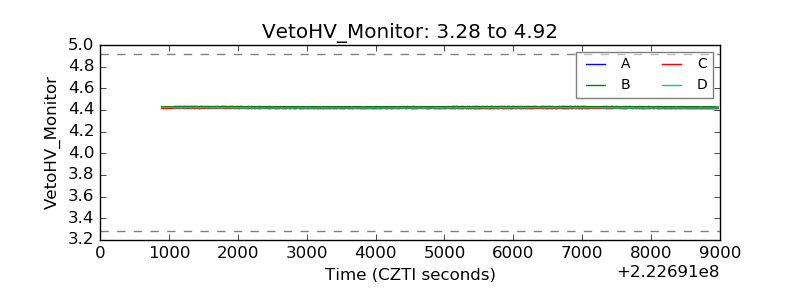 |
| Veto LLD | 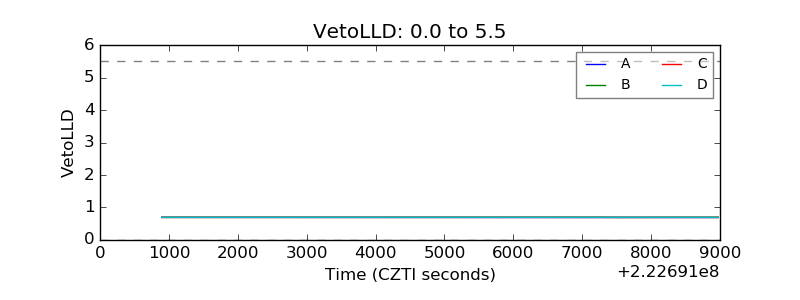 |
| Alpha Counter | 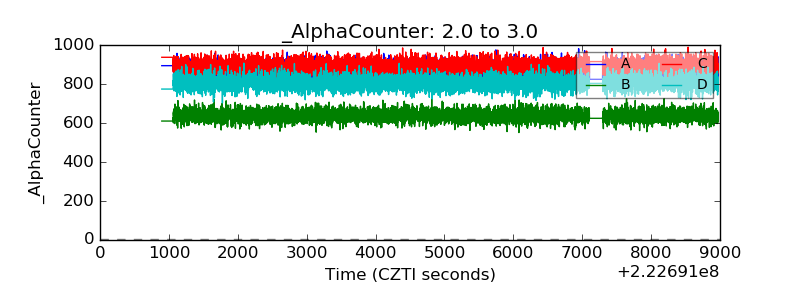 |
| _CPM_Rate | 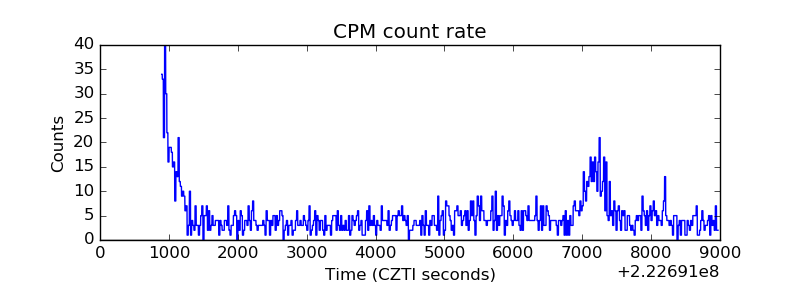 |
| CZT Counter | 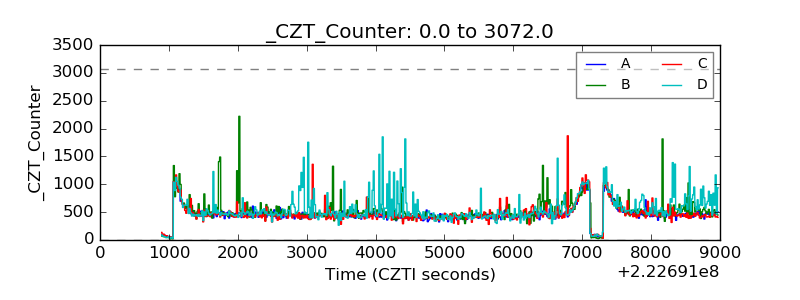 |
| +2.5 Volts monitor |  |
| +5 Volts monitor |  |
| _ROLL_ROT | 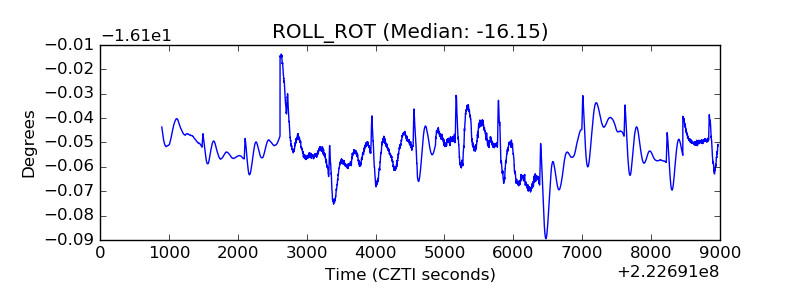 |
| _Roll_DEC | 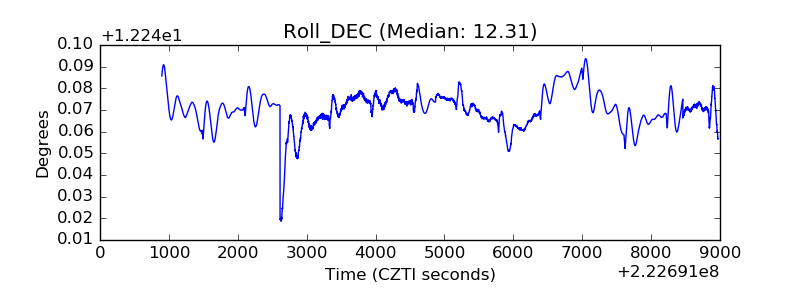 |
| _Roll_RA | 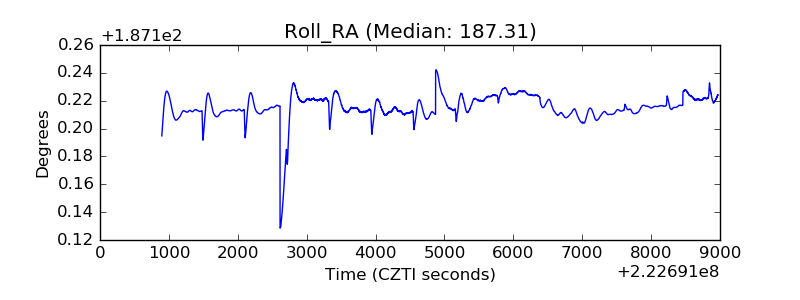 |
| Veto Counter | 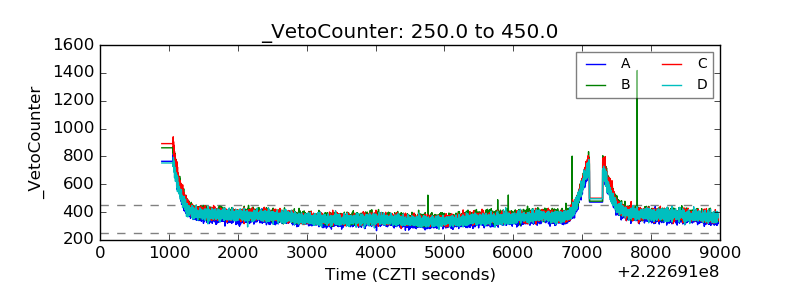 |