| Param | Original file | Final file |
|---|---|---|
| Filename | modeM0/AS1G06_051T01_9000000972_07126cztM0_level2.evt | modeM0/AS1G06_051T01_9000000972_07126cztM0_level2_quad_clean.evt |
| Size (bytes) | 575,792,640 | 79,234,560 |
| Size | 549.1 MB | 75.6 MB |
| Events in quadrant A | 3,882,151 | 464,422 |
| Events in quadrant B | 4,131,764 | 472,308 |
| Events in quadrant C | 3,824,326 | 463,674 |
| Events in quadrant D | 5,059,723 | 445,309 |
| Mode M9 | |||
|---|---|---|---|
| Quadrant | BADHDUFLAG | Total packets | Discarded packets |
| A | 0 | 5 | 0 |
| B | 0 | 5 | 0 |
| C | 0 | 5 | 0 |
| D | 0 | 5 | 0 |
| Mode SS | |||
|---|---|---|---|
| Quadrant | BADHDUFLAG | Total packets | Discarded packets |
| A | 0 | 162 | 0 |
| B | 0 | 162 | 0 |
| C | 0 | 162 | 0 |
| D | 0 | 162 | 0 |
| Mode M0 | |||
|---|---|---|---|
| Quadrant | BADHDUFLAG | Total packets | Discarded packets |
| A | 0 | 16826 | 2 |
| B | 0 | 17455 | 1 |
| C | 0 | 17006 | 1 |
| D | 0 | 20273 | 1 |
| Quadrant | Total seconds | Saturated seconds | Saturation percentage |
|---|---|---|---|
| A | 7962 | 224 | 2.813363% |
| B | 7962 | 251 | 3.152474% |
| C | 7962 | 229 | 2.876162% |
| D | 7962 | 373 | 4.684753% |
Noise dominated data is calculated using 1-second bins in cleaned event files. If a bin has >2000 counts, and if more than 50% of those come from <1% of pixels, then it is considered to be noise-dominated and hence unusable.
| Quadrant | # 1 sec bins | Bins with >0 counts | Bins with >2000 counts | High rate bins dominated by noise | Noise dominated (total time) | Noise dominated (detector-on time) | Marked lightcurve |
|---|---|---|---|---|---|---|---|
| A | 8412 | 7962 | 3 | 3 | 0.04% | 0.04% |  |
| B | 8412 | 7962 | 5 | 5 | 0.06% | 0.06% |  |
| C | 8412 | 7962 | 37 | 37 | 0.44% | 0.46% |  |
| D | 8412 | 7962 | 136 | 136 | 1.62% | 1.71% |  |
Top three noisy pixels from each quadrant. If the there are fewer than three noisy pixels in the level2.evt file, extra rows are filled as -1
| Pixel properties | Quadrant properties | ||||||
|---|---|---|---|---|---|---|---|
| Quadrant | DetID | PixID | Counts | Sigma | Mean | Median | Sigma |
| A | 8 | 15 | 69326 | 341.05 | 976 | 953 | 200.5 |
| A | 14 | 111 | 33639 | 163.04 | 976 | 953 | 200.5 |
| A | 0 | 226 | 9767 | 43.97 | 976 | 953 | 200.5 |
| B | 0 | 214 | 105640 | 552.68 | 976 | 952 | 189.4 |
| B | 3 | 220 | 80492 | 419.92 | 976 | 952 | 189.4 |
| B | 4 | 173 | 76059 | 396.52 | 976 | 952 | 189.4 |
| C | 4 | 254 | 129778 | 576.6 | 945 | 948 | 223.4 |
| C | 10 | 22 | 7934 | 31.27 | 945 | 948 | 223.4 |
| C | 13 | 61 | 7427 | 29.0 | 945 | 948 | 223.4 |
| D | 2 | 216 | 658474 | 2802.49 | 945 | 914 | 234.6 |
| D | 8 | 195 | 480213 | 2042.75 | 945 | 914 | 234.6 |
| D | 14 | 34 | 151156 | 640.32 | 945 | 914 | 234.6 |
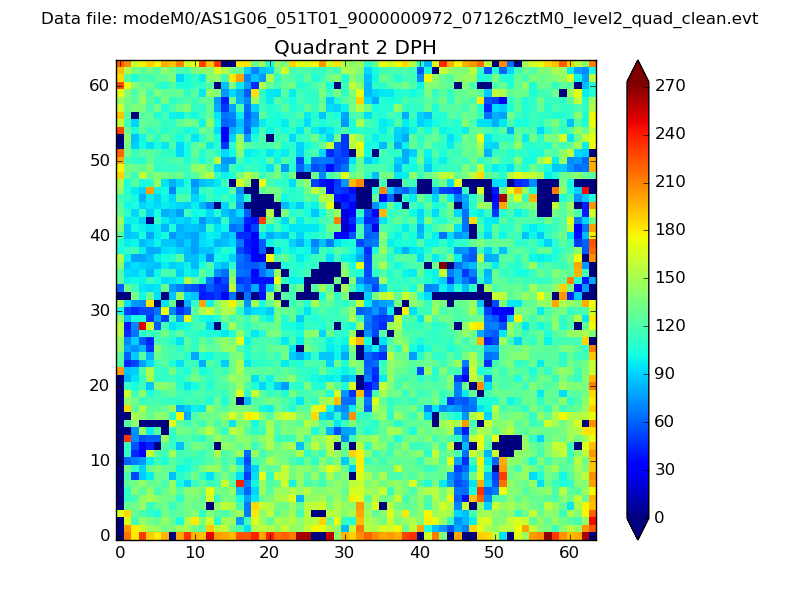
Histogram calculated using DETX and DETY for each event in the final _common_clean file
| Quadrant A | 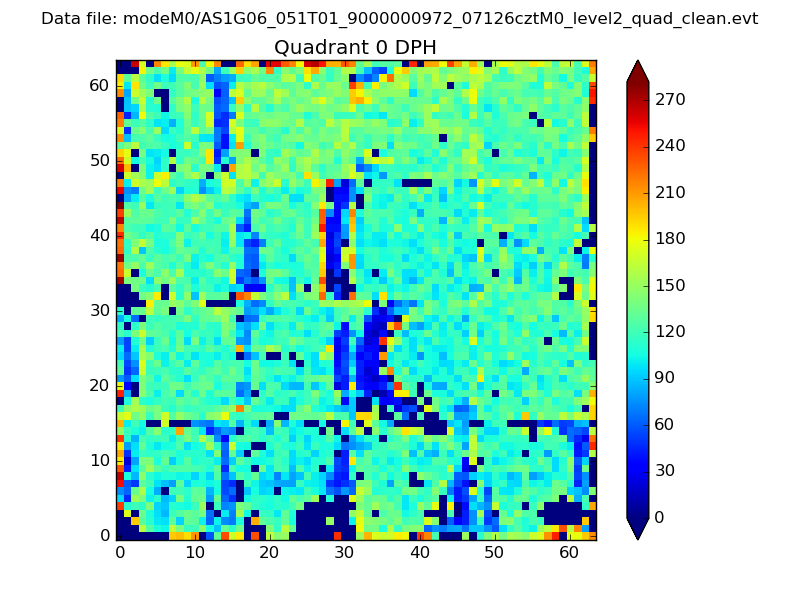 |
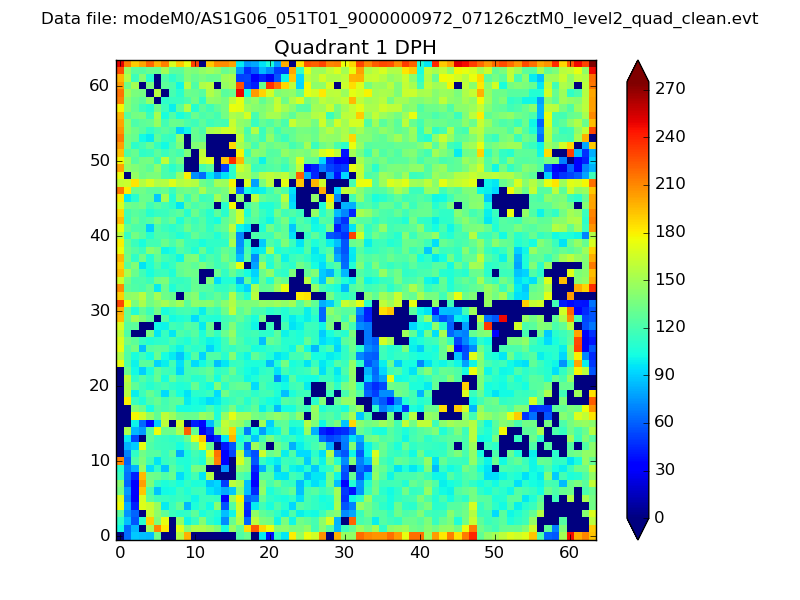 |
Quadrant B |
|---|---|---|---|
| Quadrant D | 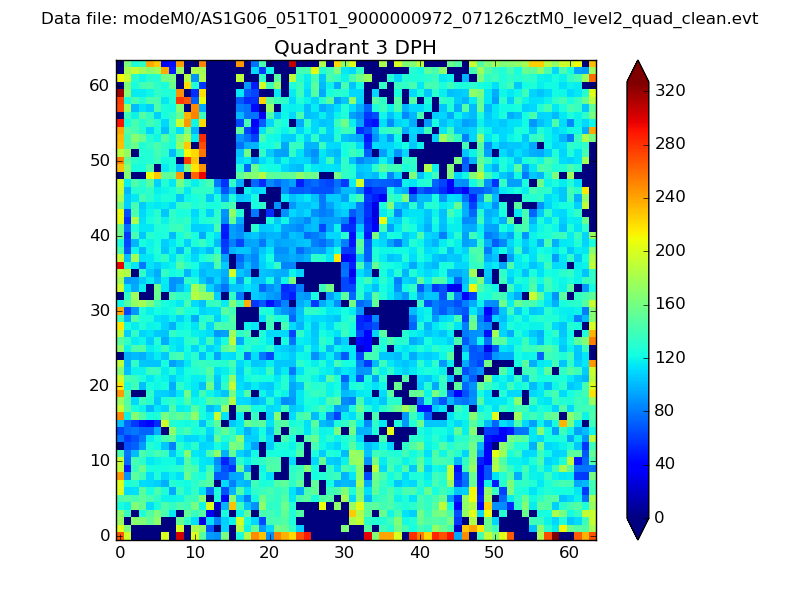 |
 |
Quadrant C |
| Plot type | Count rate plots | Images |
|---|---|---|
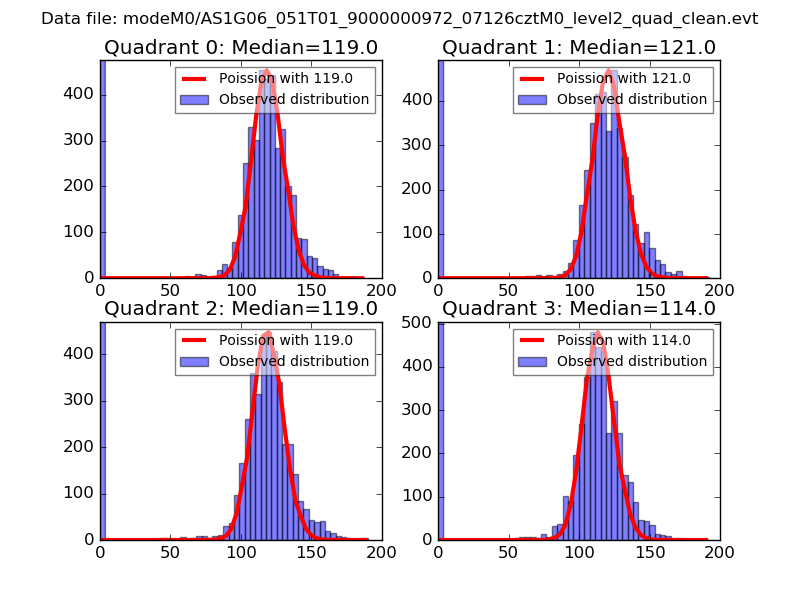
| Comparison with Poisson distribution Blue bars denote a histogram of data divided into 1 sec bins. Red curve is a Poisson curve with rate = median count rate of data. |
 |
 |
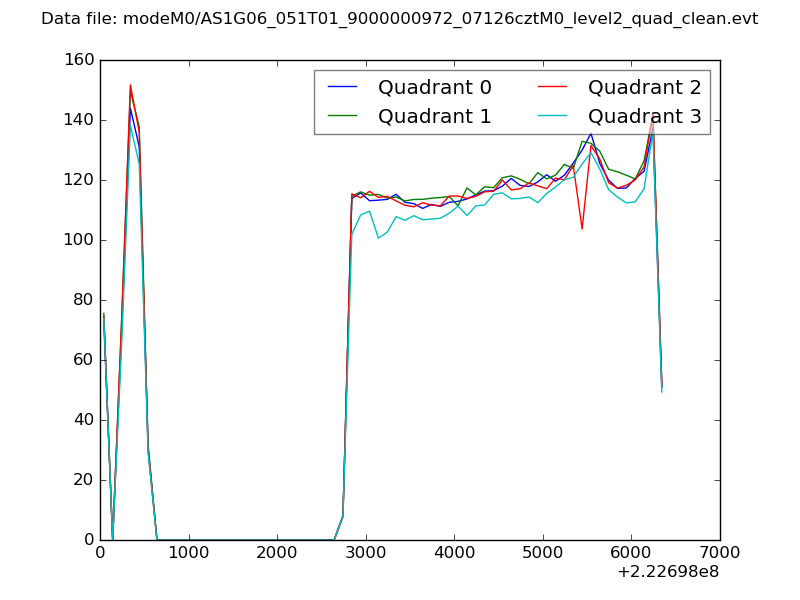
| Quadrant-wise count rates Data is divided into 100 sec bins |
 |
|
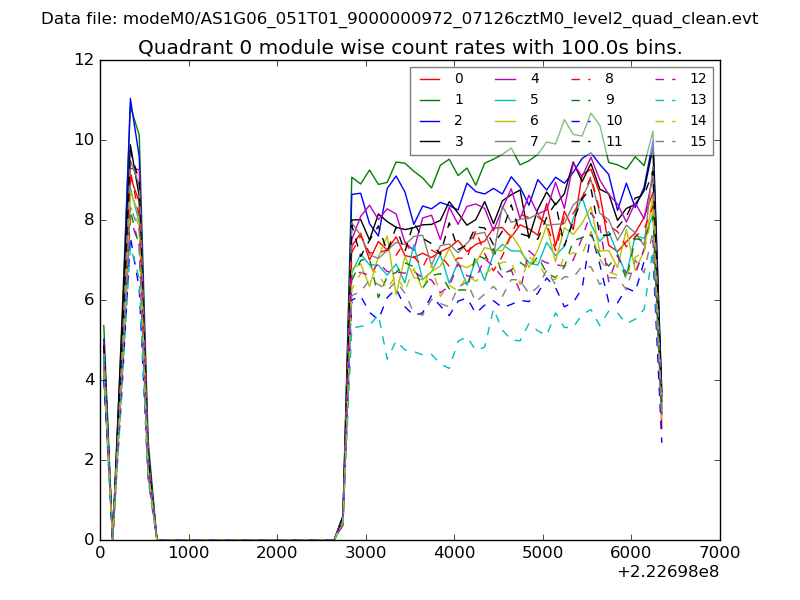
| Module-wise count rates for Quadrant A Data is divided into 100 sec bins |
 |
 |
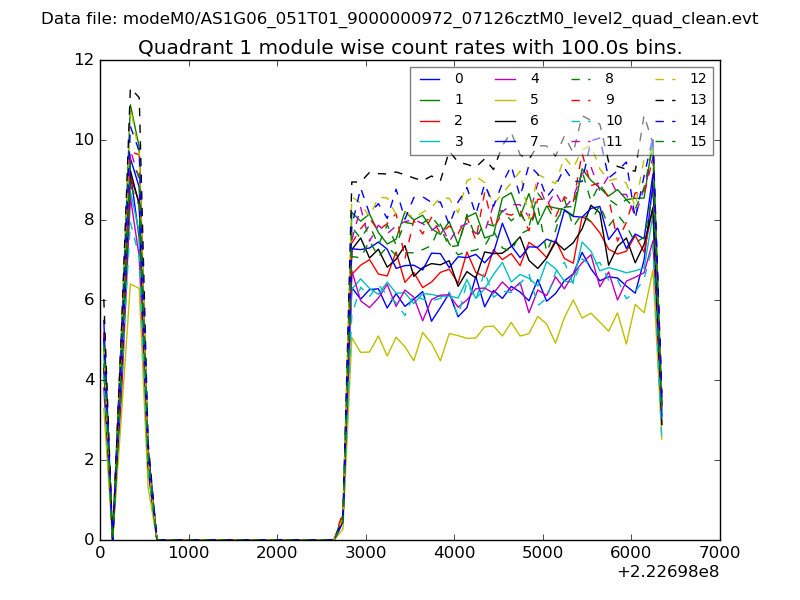
| Module-wise count rates for Quadrant B Data is divided into 100 sec bins |
 |
 |
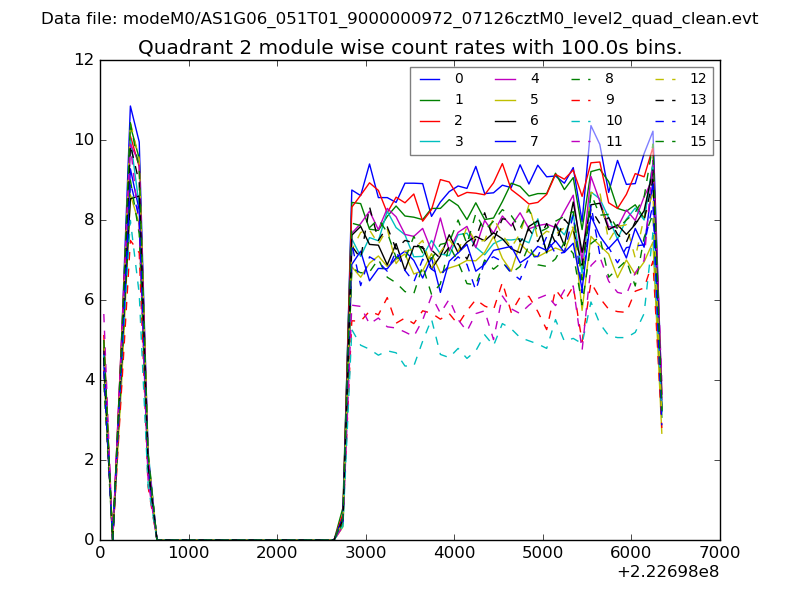
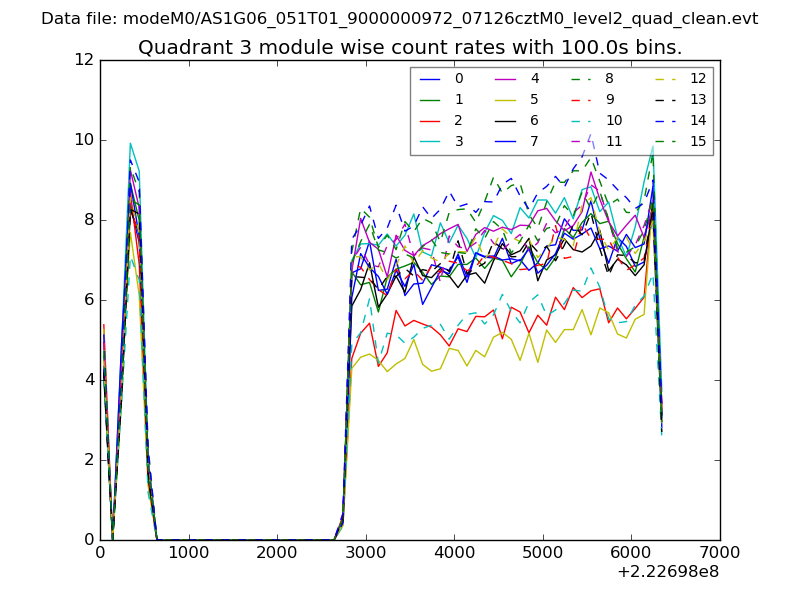
| Module-wise count rates for Quadrant C Data is divided into 100 sec bins |
 |
 |
| Module-wise count rates for Quadrant D Data is divided into 100 sec bins |
 |
 |
| Parameter | Plot |
|---|---|
| CZT HV Monitor | 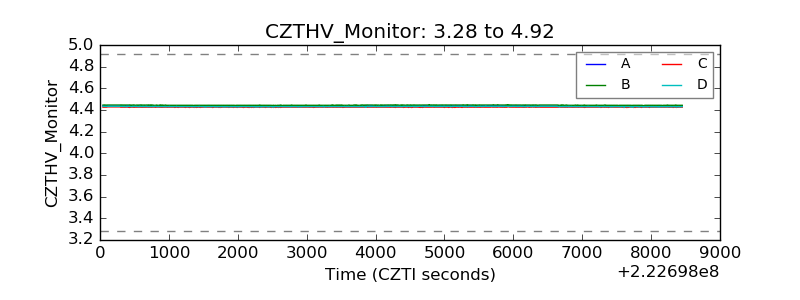 |
| D_VDD | 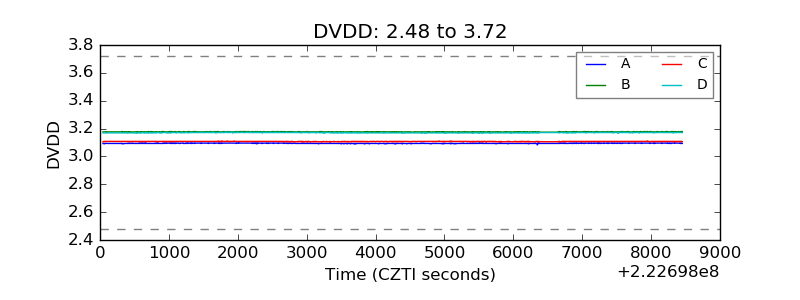 |
| Temperature 1 | 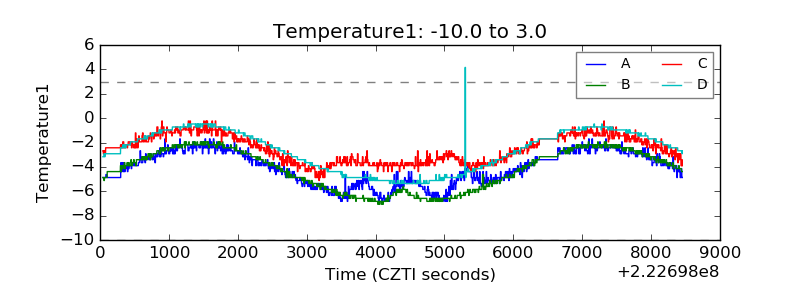 |
| Veto HV Monitor | 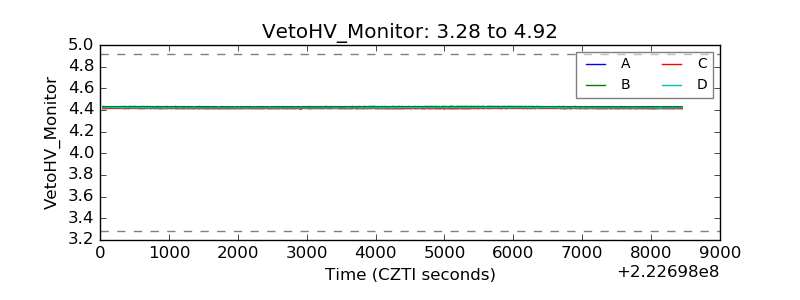 |
| Veto LLD | 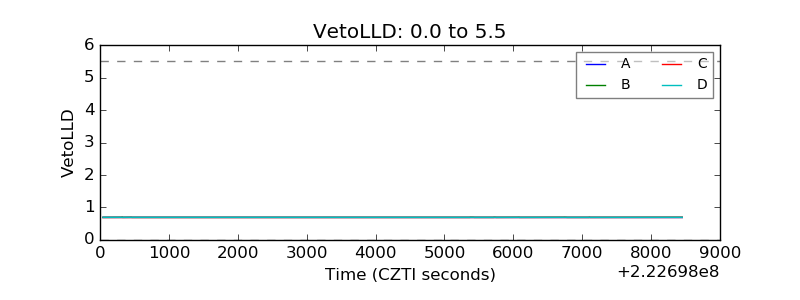 |
| Alpha Counter | 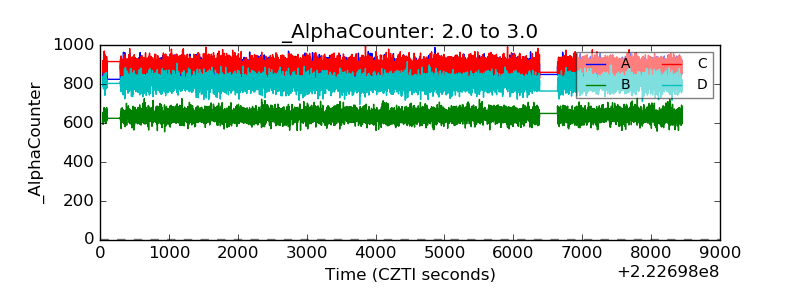 |
| _CPM_Rate | 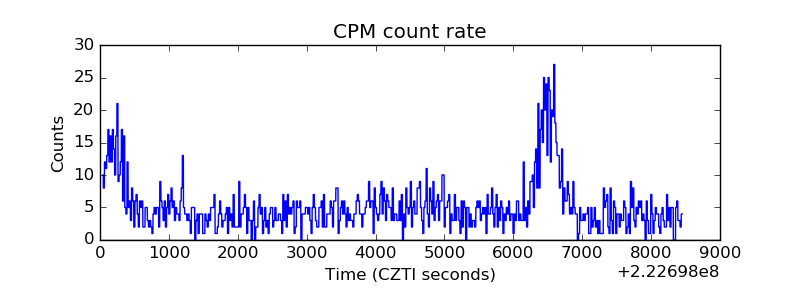 |
| CZT Counter | 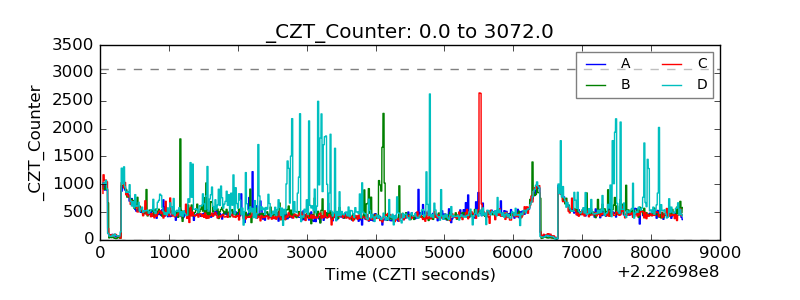 |
| +2.5 Volts monitor |  |
| +5 Volts monitor |  |
| _ROLL_ROT | 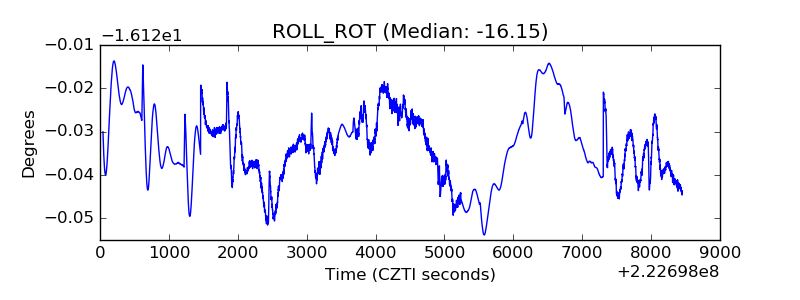 |
| _Roll_DEC | 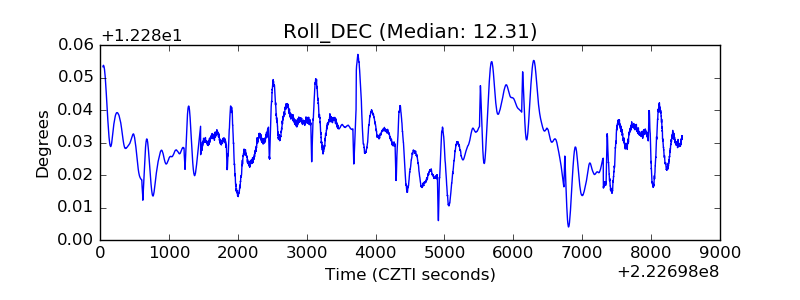 |
| _Roll_RA | 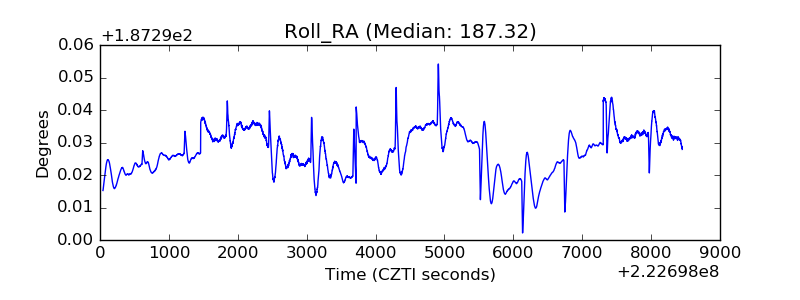 |
| Veto Counter | 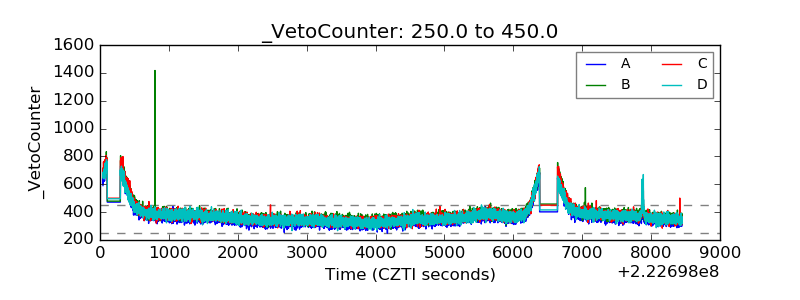 |