| Param | Original file | Final file |
|---|---|---|
| Filename | modeM0/AS1G06_051T01_9000000972_07134cztM0_level2.evt | modeM0/AS1G06_051T01_9000000972_07134cztM0_level2_quad_clean.evt |
| Size (bytes) | 1,410,154,560 | 286,099,200 |
| Size | 1.3 GB | 272.8 MB |
| Events in quadrant A | 9,947,364 | 1,805,614 |
| Events in quadrant B | 10,621,272 | 1,852,289 |
| Events in quadrant C | 9,897,975 | 1,802,742 |
| Events in quadrant D | 10,784,543 | 1,723,207 |
| Mode M9 | |||
|---|---|---|---|
| Quadrant | BADHDUFLAG | Total packets | Discarded packets |
| A | 0 | 46 | 0 |
| B | 0 | 46 | 0 |
| C | 0 | 46 | 0 |
| D | 0 | 46 | 0 |
| Mode SS | |||
|---|---|---|---|
| Quadrant | BADHDUFLAG | Total packets | Discarded packets |
| A | 0 | 436 | 0 |
| B | 0 | 436 | 0 |
| C | 0 | 436 | 0 |
| D | 0 | 436 | 0 |
| Mode M0 | |||
|---|---|---|---|
| Quadrant | BADHDUFLAG | Total packets | Discarded packets |
| A | 0 | 44267 | 5 |
| B | 0 | 46088 | 4 |
| C | 0 | 44422 | 4 |
| D | 0 | 47206 | 4 |
| Quadrant | Total seconds | Saturated seconds | Saturation percentage |
|---|---|---|---|
| A | 21531 | 77 | 0.357624% |
| B | 21531 | 134 | 0.622358% |
| C | 21531 | 107 | 0.496958% |
| D | 21531 | 266 | 1.235428% |
Noise dominated data is calculated using 1-second bins in cleaned event files. If a bin has >2000 counts, and if more than 50% of those come from <1% of pixels, then it is considered to be noise-dominated and hence unusable.
| Quadrant | # 1 sec bins | Bins with >0 counts | Bins with >2000 counts | High rate bins dominated by noise | Noise dominated (total time) | Noise dominated (detector-on time) | Marked lightcurve |
|---|---|---|---|---|---|---|---|
| A | 26016 | 21533 | 4 | 4 | 0.02% | 0.02% | 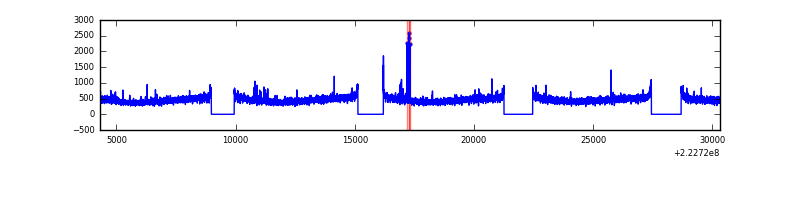 |
| B | 26016 | 21533 | 14 | 14 | 0.05% | 0.07% | 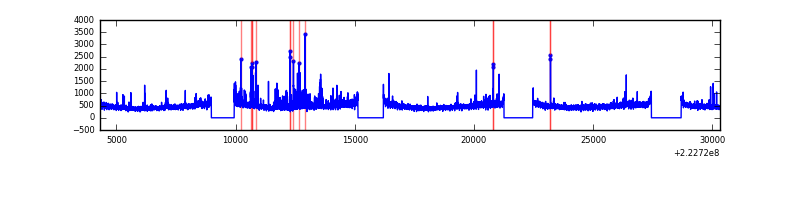 |
| C | 26016 | 21533 | 44 | 44 | 0.17% | 0.20% | 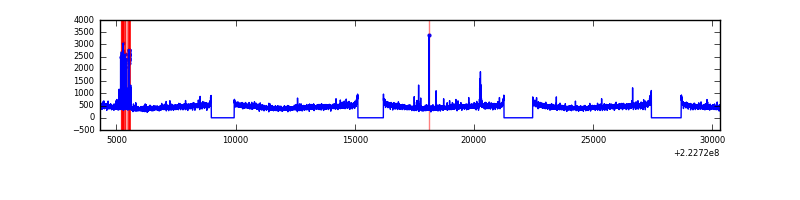 |
| D | 26016 | 21533 | 173 | 173 | 0.66% | 0.80% | 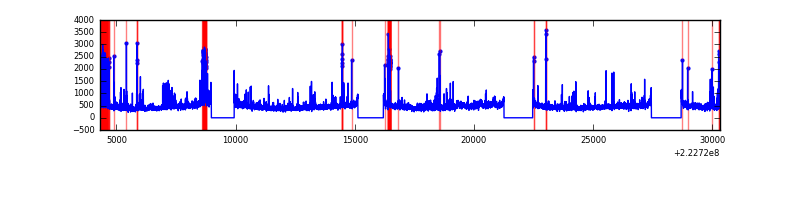 |
Top three noisy pixels from each quadrant. If the there are fewer than three noisy pixels in the level2.evt file, extra rows are filled as -1
| Pixel properties | Quadrant properties | ||||||
|---|---|---|---|---|---|---|---|
| Quadrant | DetID | PixID | Counts | Sigma | Mean | Median | Sigma |
| A | 8 | 15 | 113467 | 218.57 | 2519 | 2470 | 507.8 |
| A | 13 | 248 | 74722 | 142.27 | 2519 | 2470 | 507.8 |
| A | 3 | 1 | 39008 | 71.95 | 2519 | 2470 | 507.8 |
| B | 10 | 246 | 447005 | 920.4 | 2543 | 2483 | 483.0 |
| B | 0 | 214 | 182463 | 372.66 | 2543 | 2483 | 483.0 |
| B | 0 | 219 | 58649 | 116.29 | 2543 | 2483 | 483.0 |
| C | 4 | 254 | 262479 | 461.4 | 2445 | 2456 | 563.6 |
| C | 9 | 68 | 73264 | 125.65 | 2445 | 2456 | 563.6 |
| C | 13 | 61 | 19127 | 29.58 | 2445 | 2456 | 563.6 |
| D | 2 | 216 | 514350 | 865.62 | 2426 | 2353 | 591.5 |
| D | 12 | 233 | 478042 | 804.23 | 2426 | 2353 | 591.5 |
| D | 8 | 195 | 234191 | 391.96 | 2426 | 2353 | 591.5 |
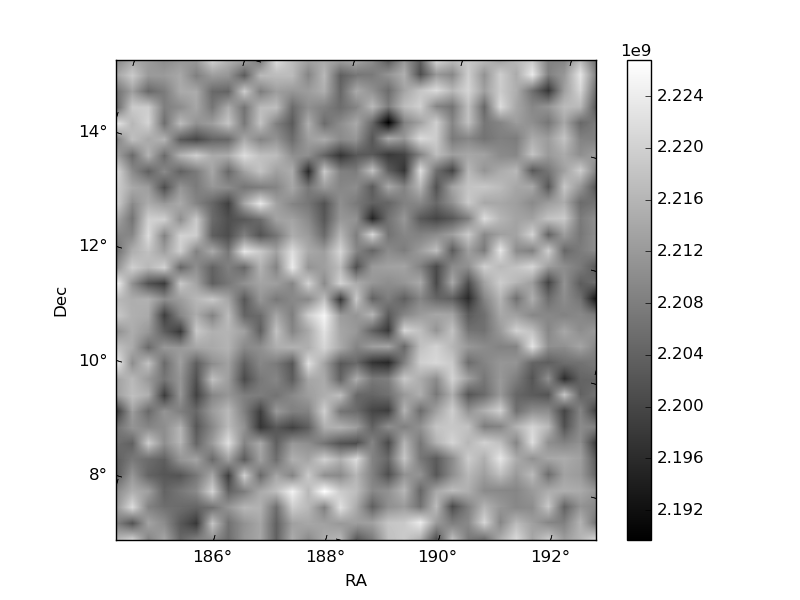
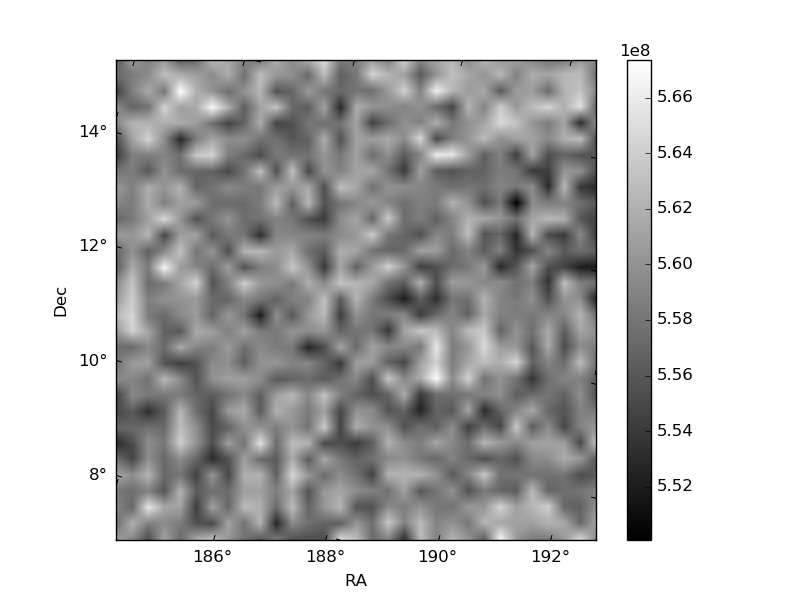
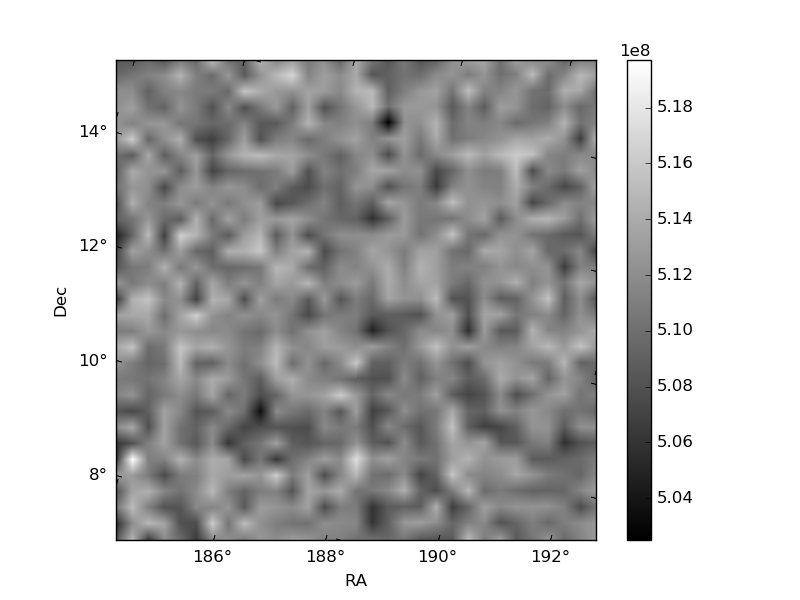
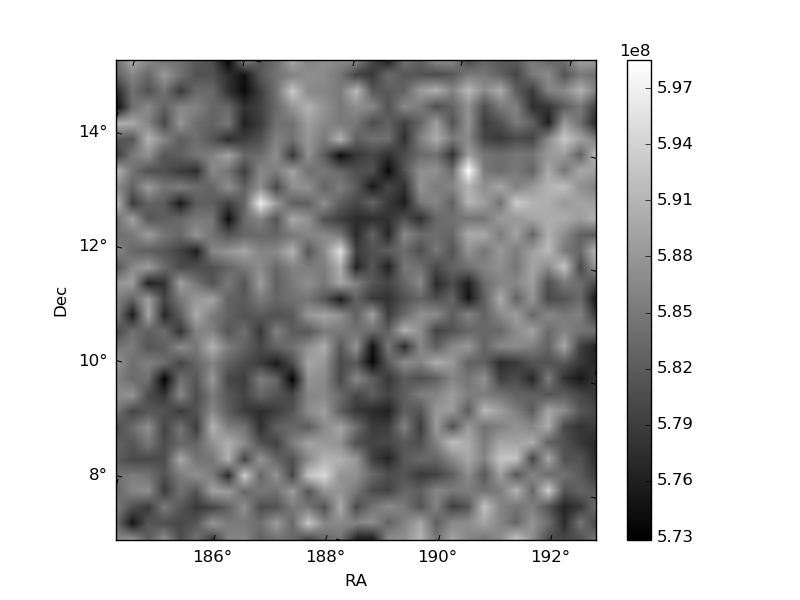
Histogram calculated using DETX and DETY for each event in the final _common_clean file
| Quadrant A | 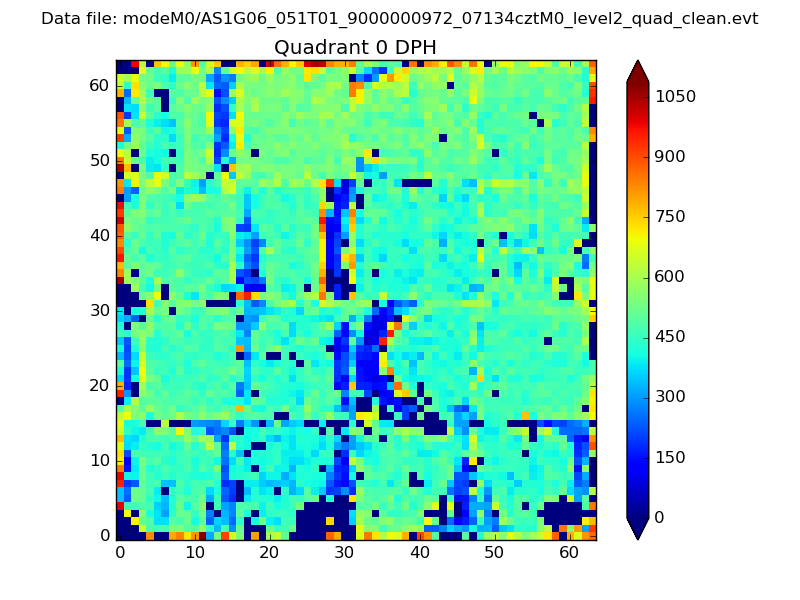 |
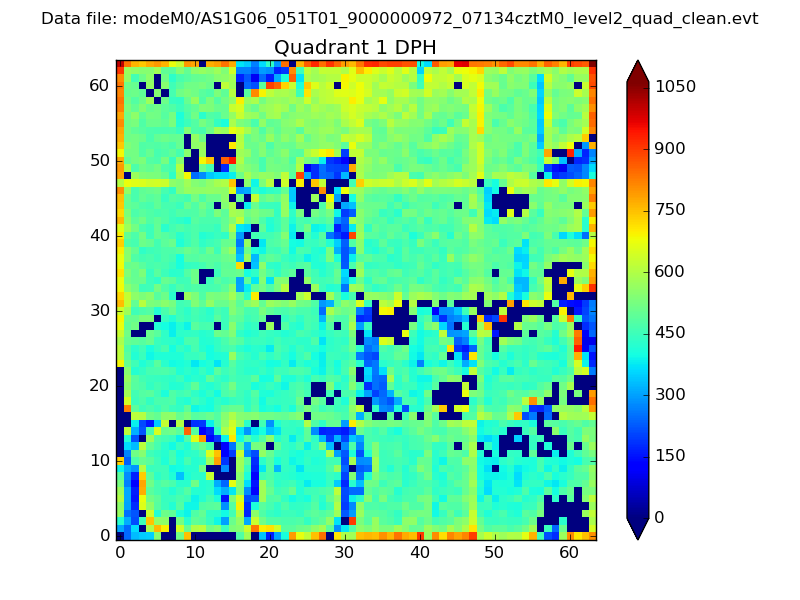 |
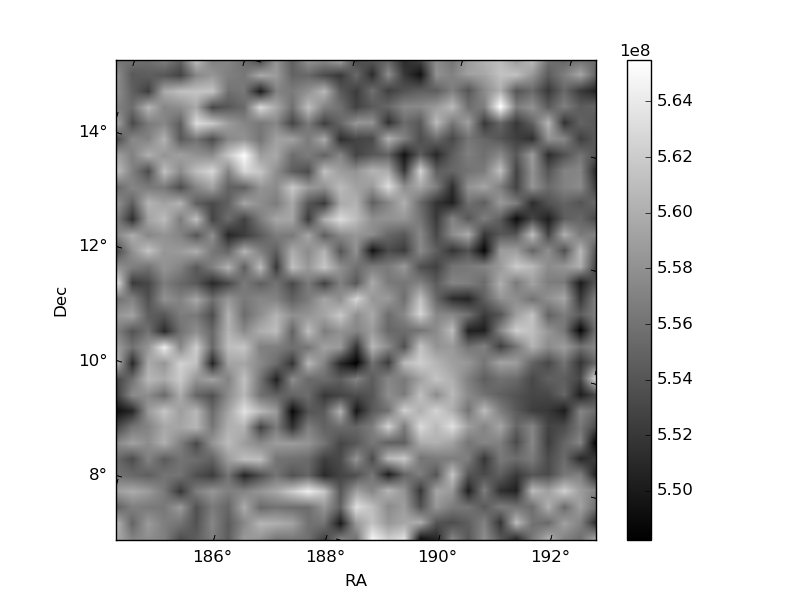
Quadrant B |
|---|---|---|---|
| Quadrant D | 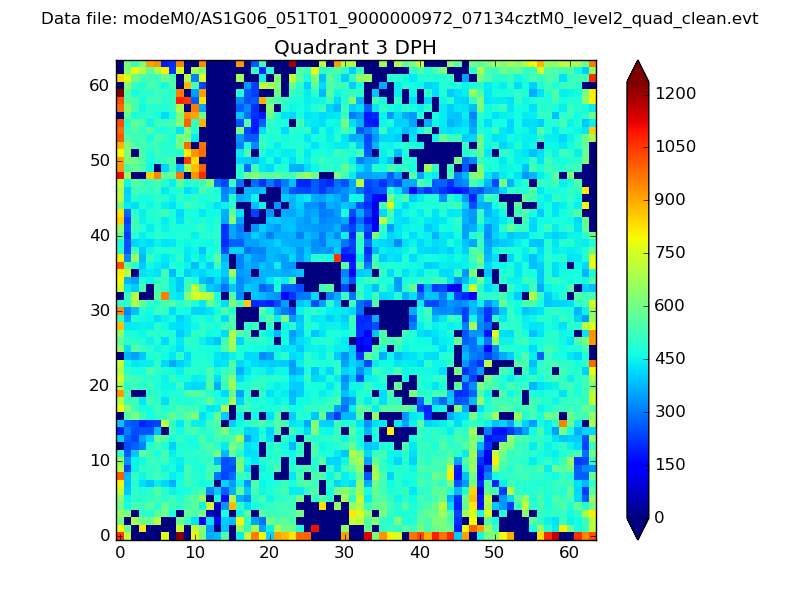 |
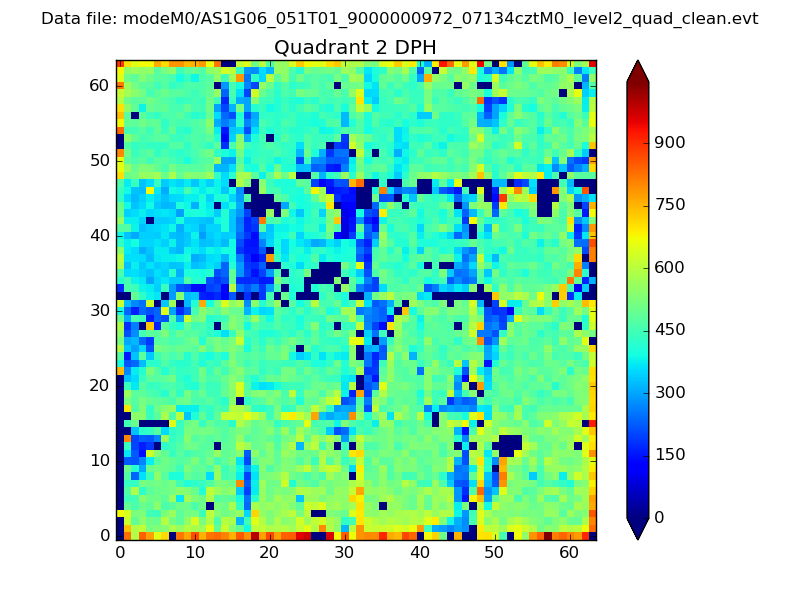 |
Quadrant C |
| Plot type | Count rate plots | Images |
|---|---|---|
| Comparison with Poisson distribution Blue bars denote a histogram of data divided into 1 sec bins. Red curve is a Poisson curve with rate = median count rate of data. |
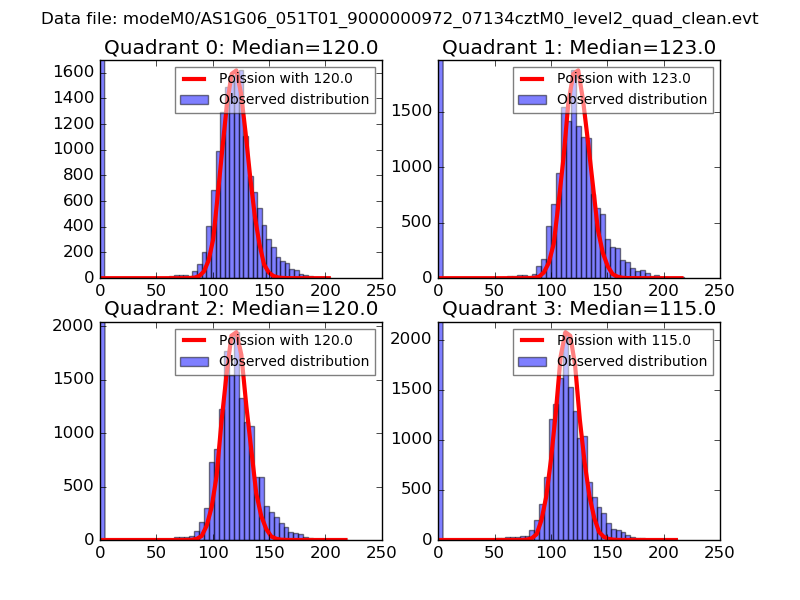 |
 |
| Quadrant-wise count rates Data is divided into 100 sec bins |
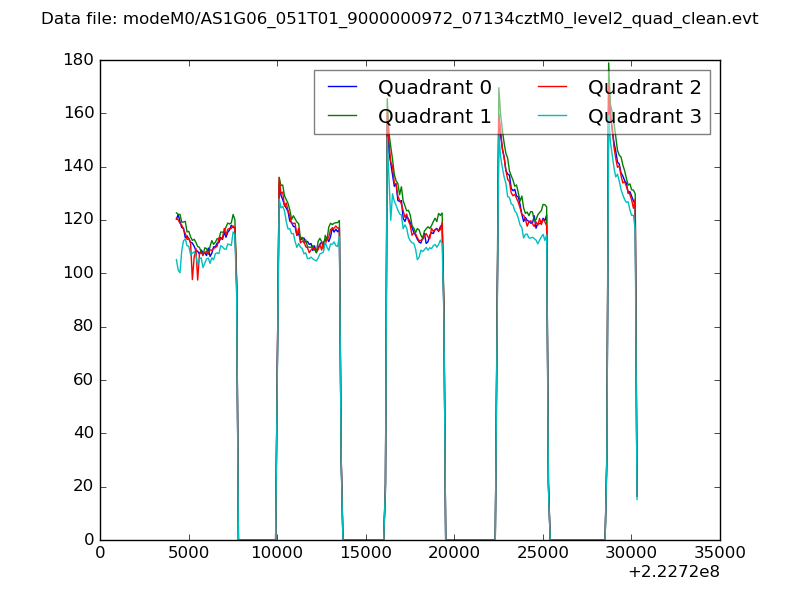 |
|
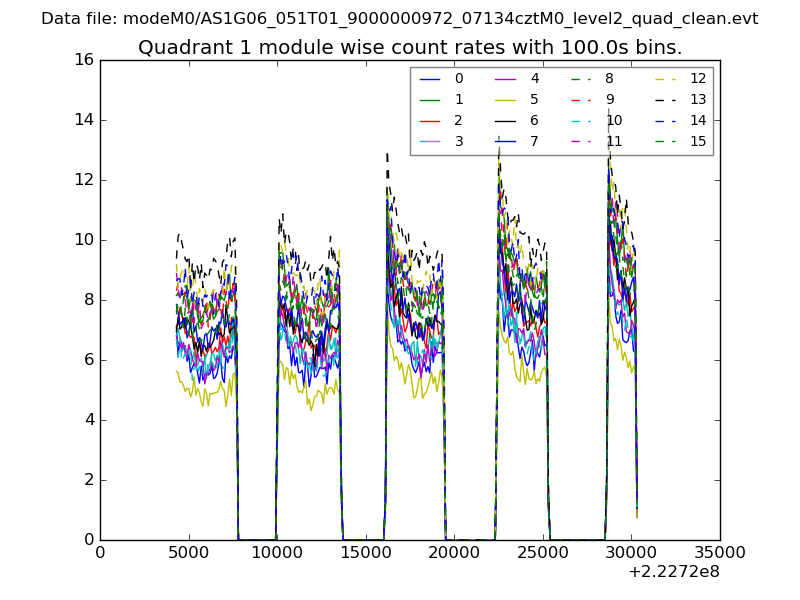
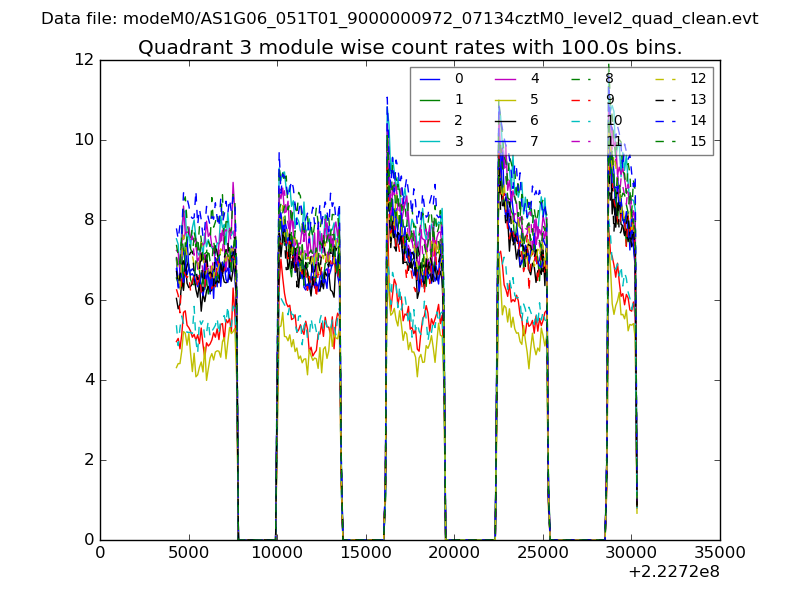
| Module-wise count rates for Quadrant A Data is divided into 100 sec bins |
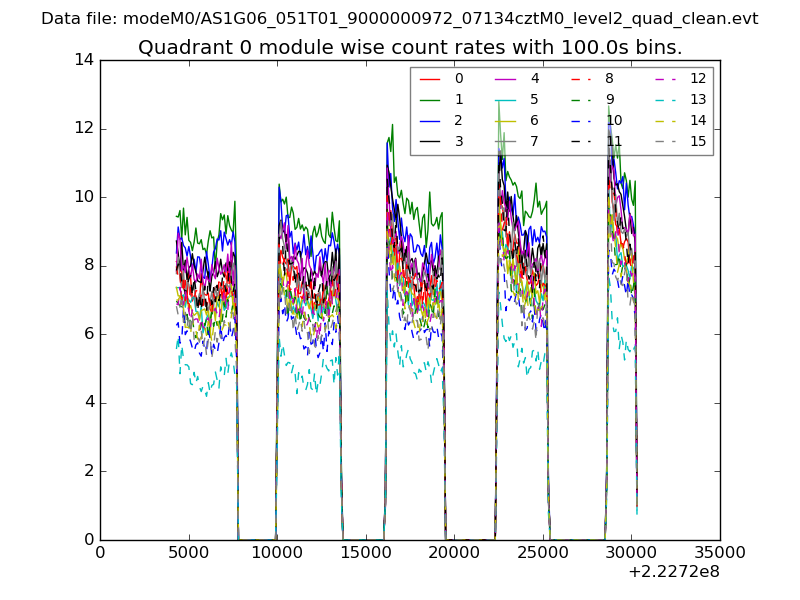 |
 |
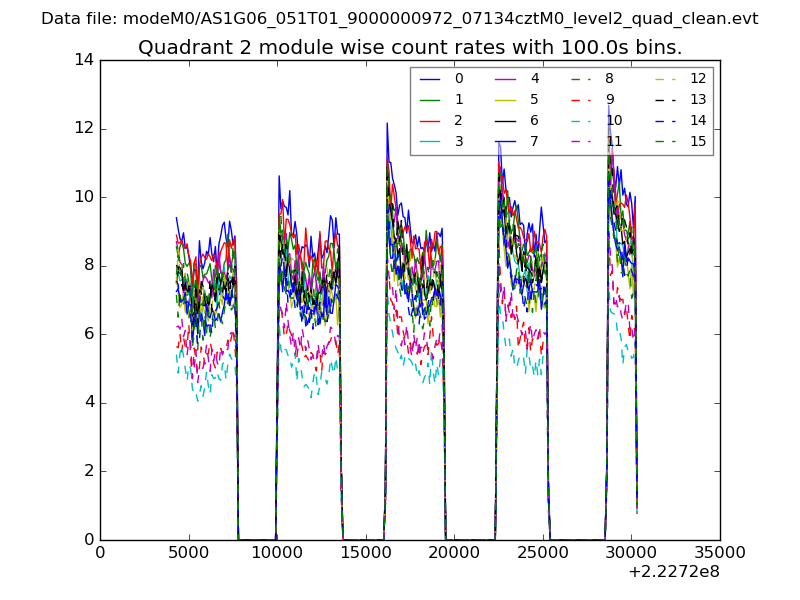
| Module-wise count rates for Quadrant B Data is divided into 100 sec bins |
 |
 |
| Module-wise count rates for Quadrant C Data is divided into 100 sec bins |
 |
 |
| Module-wise count rates for Quadrant D Data is divided into 100 sec bins |
 |
 |
| Parameter | Plot |
|---|---|
| CZT HV Monitor | 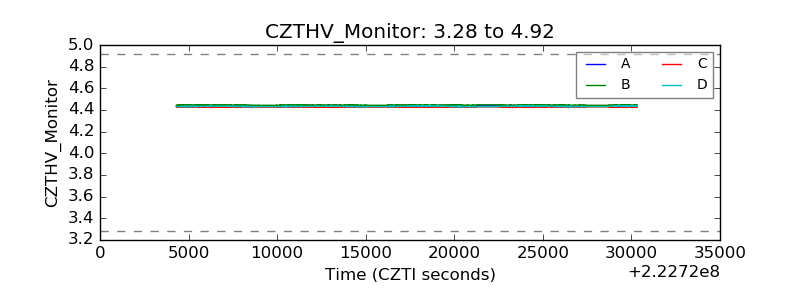 |
| D_VDD | 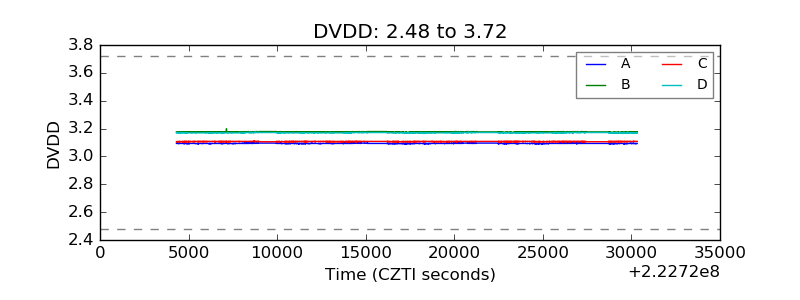 |
| Temperature 1 | 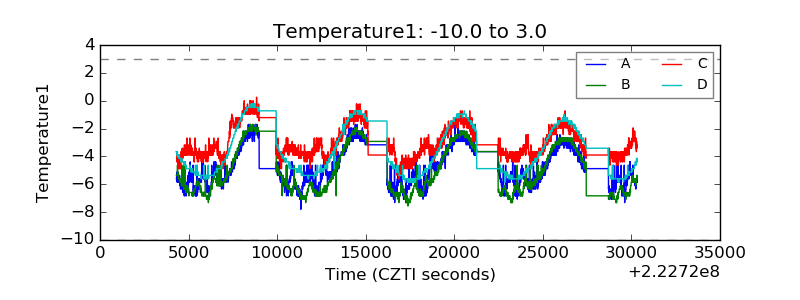 |
| Veto HV Monitor | 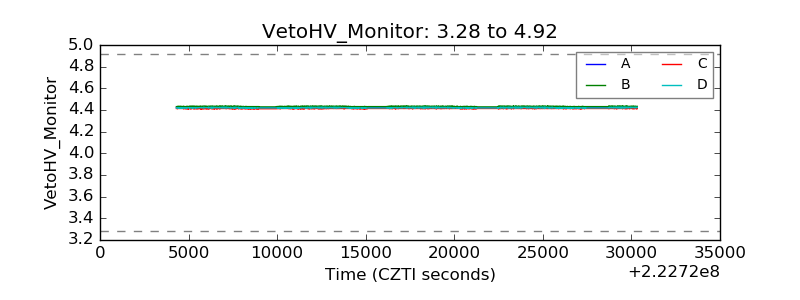 |
| Veto LLD | 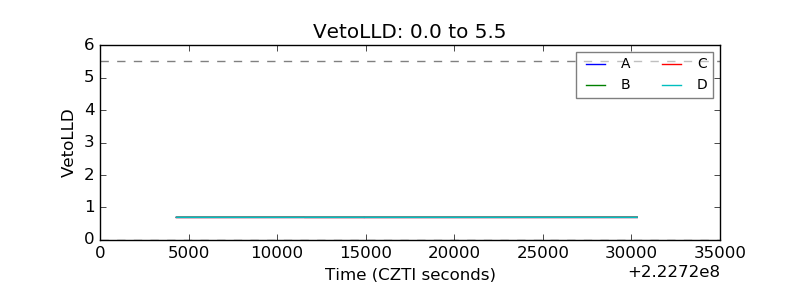 |
| Alpha Counter | 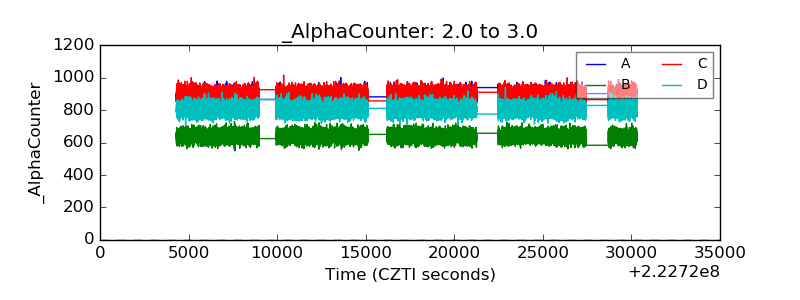 |
| _CPM_Rate | 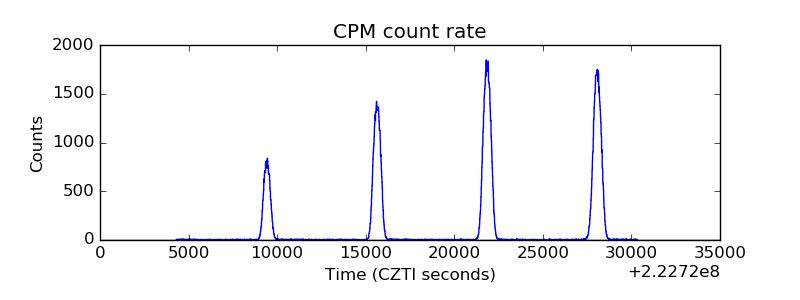 |
| CZT Counter | 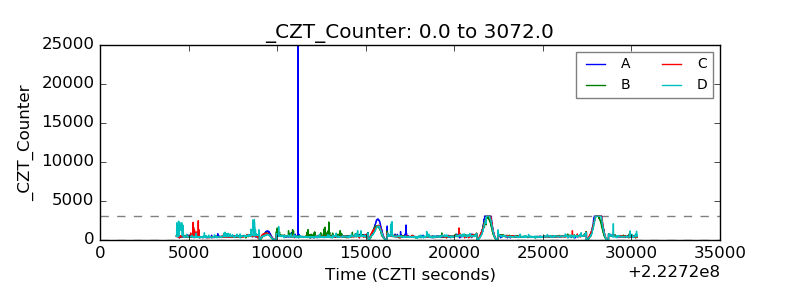 |
| +2.5 Volts monitor |  |
| +5 Volts monitor |  |
| _ROLL_ROT | 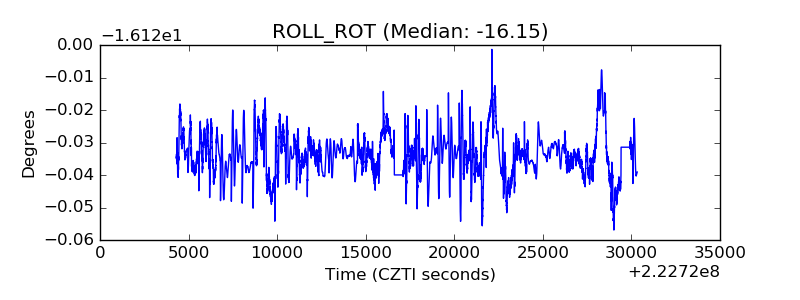 |
| _Roll_DEC | 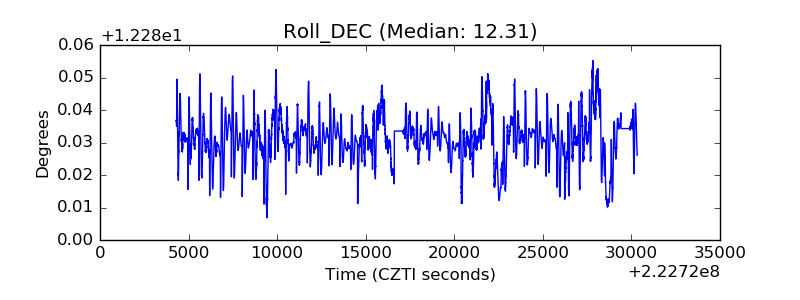 |
| _Roll_RA | 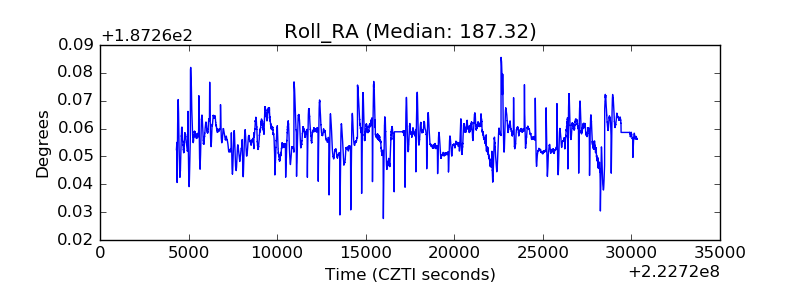 |
| Veto Counter | 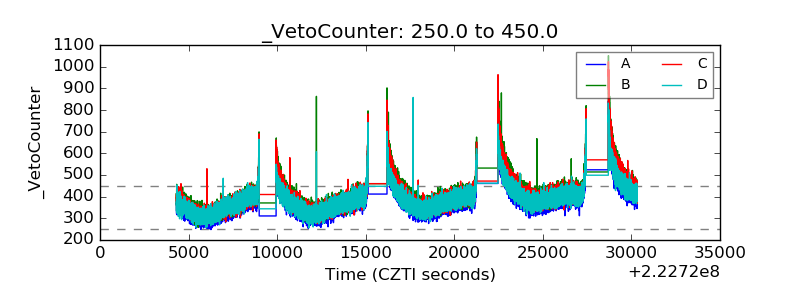 |