| Param | Original file | Final file |
|---|---|---|
| Filename | modeM0/AS1G06_051T01_9000000972_07135cztM0_level2.evt | modeM0/AS1G06_051T01_9000000972_07135cztM0_level2_quad_clean.evt |
| Size (bytes) | 406,359,360 | 83,399,040 |
| Size | 387.5 MB | 79.5 MB |
| Events in quadrant A | 2,925,025 | 526,318 |
| Events in quadrant B | 3,101,773 | 542,655 |
| Events in quadrant C | 2,878,718 | 528,077 |
| Events in quadrant D | 2,983,204 | 499,661 |
| Mode M9 | |||
|---|---|---|---|
| Quadrant | BADHDUFLAG | Total packets | Discarded packets |
| A | 0 | 13 | 0 |
| B | 0 | 14 | 1 |
| C | 0 | 15 | 2 |
| D | 0 | 14 | 1 |
| Mode SS | |||
|---|---|---|---|
| Quadrant | BADHDUFLAG | Total packets | Discarded packets |
| A | 0 | 128 | 2 |
| B | 0 | 128 | 2 |
| C | 0 | 128 | 0 |
| D | 0 | 129 | 3 |
| Mode M0 | |||
|---|---|---|---|
| Quadrant | BADHDUFLAG | Total packets | Discarded packets |
| A | 0 | 12991 | 393 |
| B | 0 | 13595 | 414 |
| C | 0 | 12945 | 385 |
| D | 0 | 13389 | 509 |
| Quadrant | Total seconds | Saturated seconds | Saturation percentage |
|---|---|---|---|
| A | 6138 | 21 | 0.342131% |
| B | 6137 | 38 | 0.619195% |
| C | 6146 | 14 | 0.227790% |
| D | 6125 | 18 | 0.293878% |
Noise dominated data is calculated using 1-second bins in cleaned event files. If a bin has >2000 counts, and if more than 50% of those come from <1% of pixels, then it is considered to be noise-dominated and hence unusable.
| Quadrant | # 1 sec bins | Bins with >0 counts | Bins with >2000 counts | High rate bins dominated by noise | Noise dominated (total time) | Noise dominated (detector-on time) | Marked lightcurve |
|---|---|---|---|---|---|---|---|
| A | 7705 | 6166 | 0 | 0 | 0.00% | 0.00% | 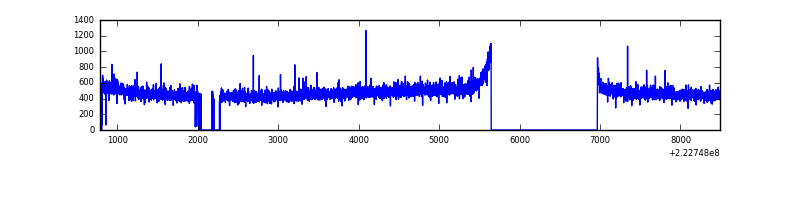 |
| B | 7704 | 6167 | 4 | 4 | 0.05% | 0.06% | 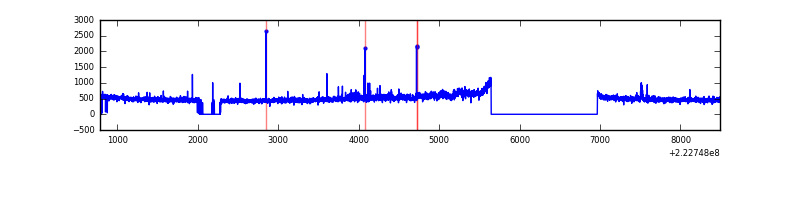 |
| C | 7708 | 6165 | 0 | 0 | 0.00% | 0.00% | 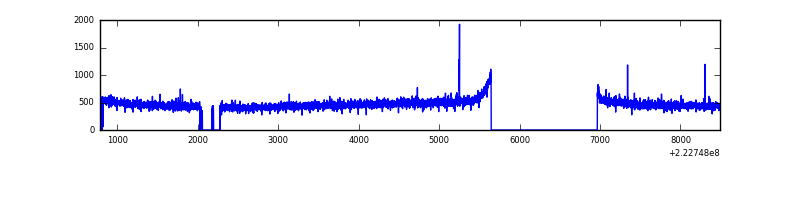 |
| D | 7707 | 6151 | 9 | 9 | 0.12% | 0.15% | 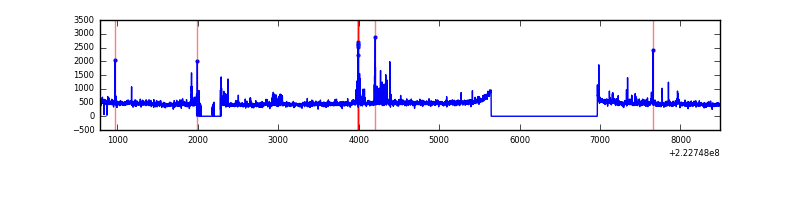 |
Top three noisy pixels from each quadrant. If the there are fewer than three noisy pixels in the level2.evt file, extra rows are filled as -1
| Pixel properties | Quadrant properties | ||||||
|---|---|---|---|---|---|---|---|
| Quadrant | DetID | PixID | Counts | Sigma | Mean | Median | Sigma |
| A | 8 | 15 | 13760 | 85.87 | 755 | 742 | 151.6 |
| A | 0 | 226 | 7289 | 43.18 | 755 | 742 | 151.6 |
| A | 14 | 111 | 7171 | 42.4 | 755 | 742 | 151.6 |
| B | 0 | 219 | 94906 | 651.98 | 761 | 743 | 144.4 |
| B | 0 | 214 | 50163 | 342.18 | 761 | 743 | 144.4 |
| B | 4 | 81 | 14973 | 98.53 | 761 | 743 | 144.4 |
| C | 9 | 68 | 8387 | 44.98 | 734 | 739 | 170.0 |
| C | 10 | 22 | 6326 | 32.86 | 734 | 739 | 170.0 |
| C | 13 | 61 | 5732 | 29.36 | 734 | 739 | 170.0 |
| D | 12 | 233 | 73662 | 409.35 | 727 | 704 | 178.2 |
| D | 2 | 136 | 67094 | 372.5 | 727 | 704 | 178.2 |
| D | 2 | 216 | 34619 | 190.29 | 727 | 704 | 178.2 |
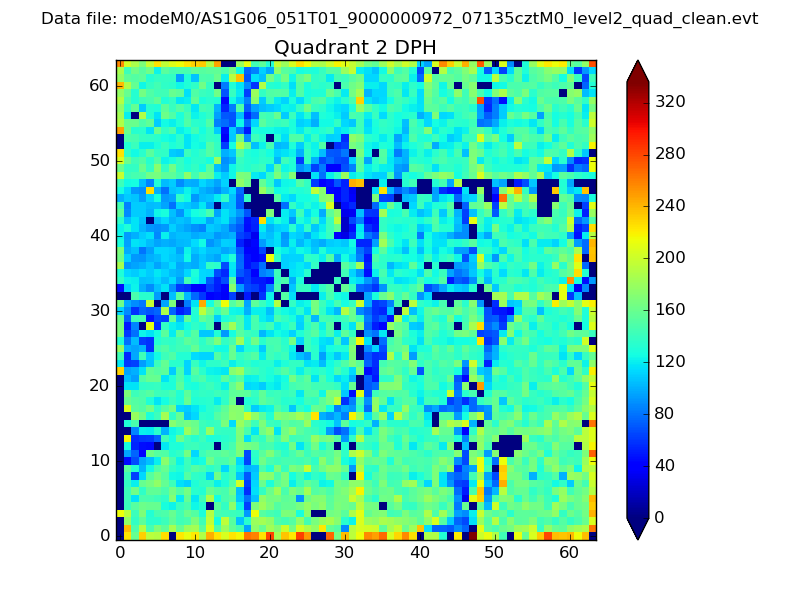
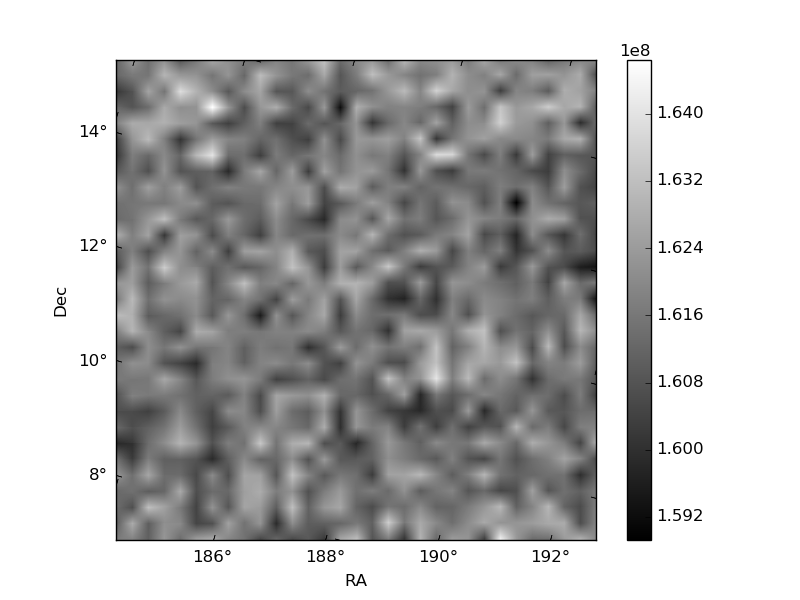
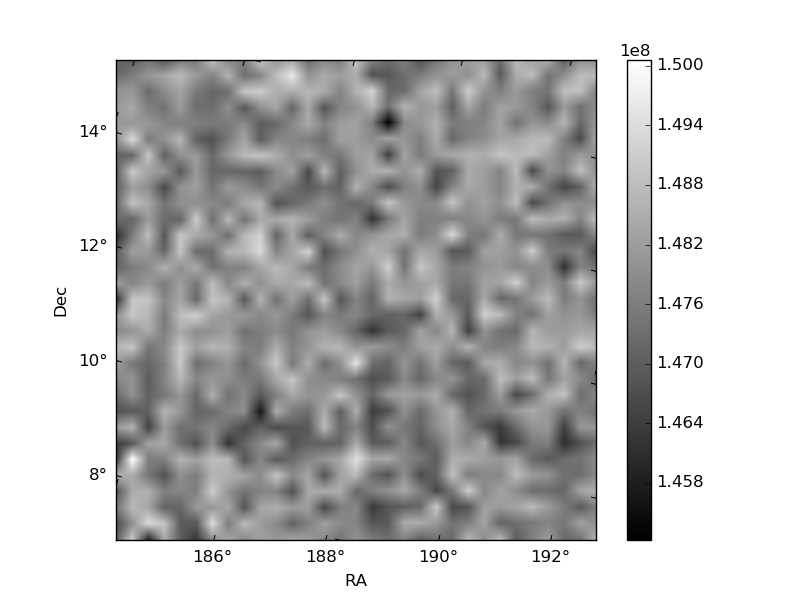
Histogram calculated using DETX and DETY for each event in the final _common_clean file
| Quadrant A | 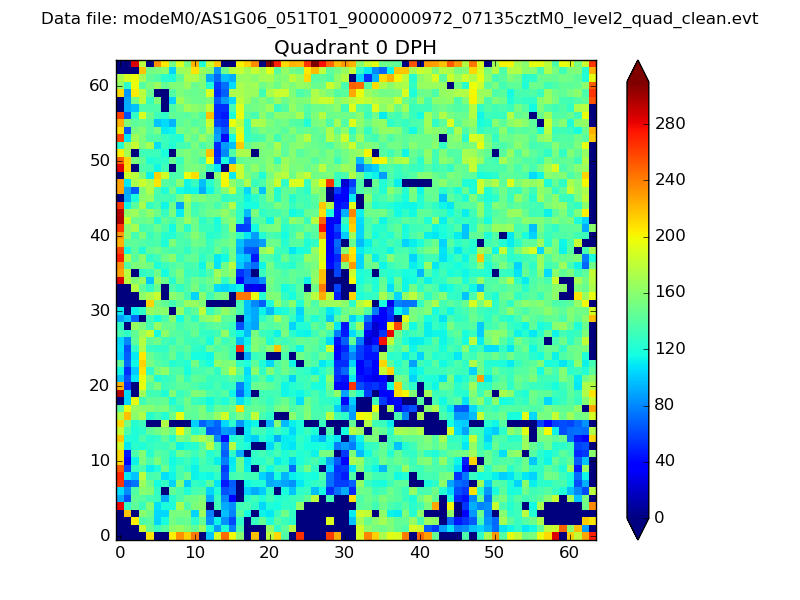 |
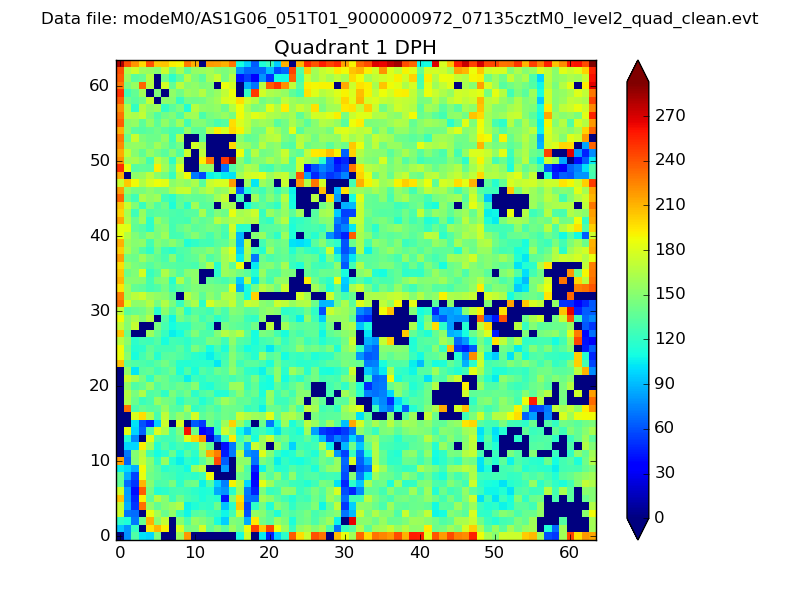 |
Quadrant B |
|---|---|---|---|
| Quadrant D | 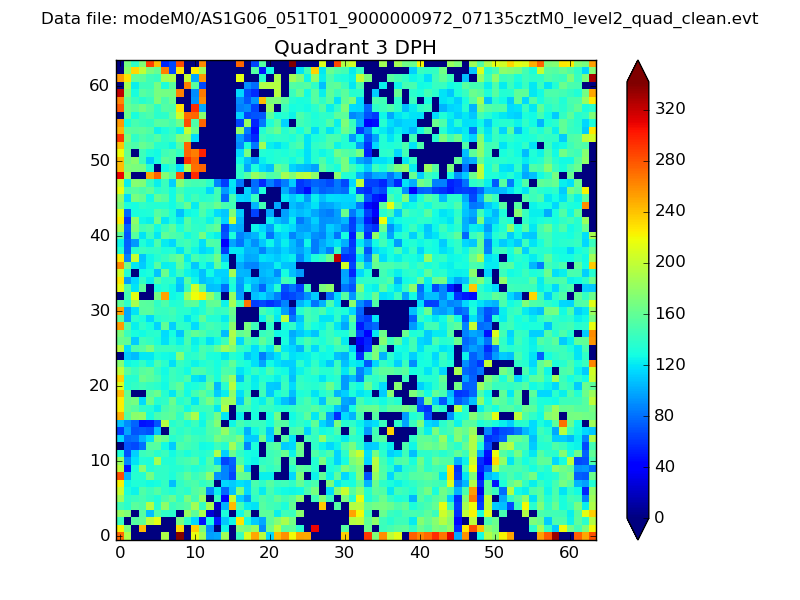 |
 |
Quadrant C |
| Plot type | Count rate plots | Images |
|---|---|---|
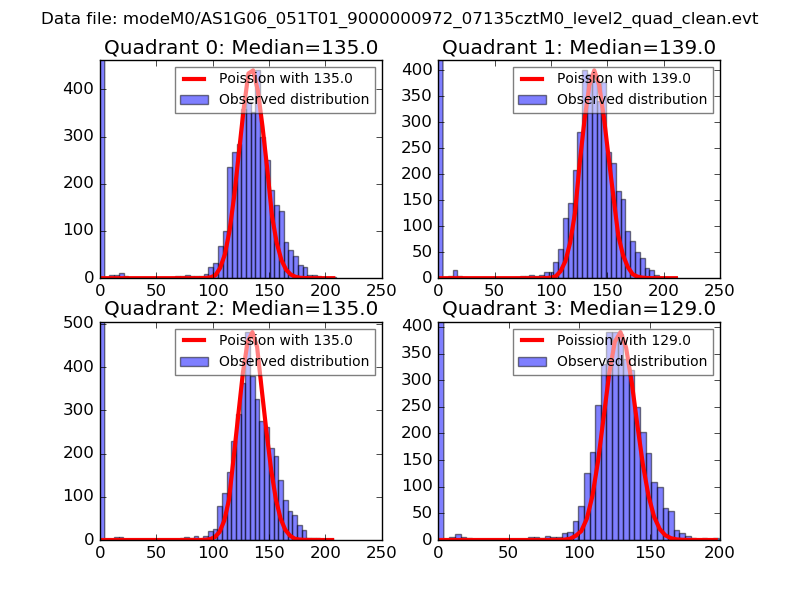
| Comparison with Poisson distribution Blue bars denote a histogram of data divided into 1 sec bins. Red curve is a Poisson curve with rate = median count rate of data. |
 |
 |
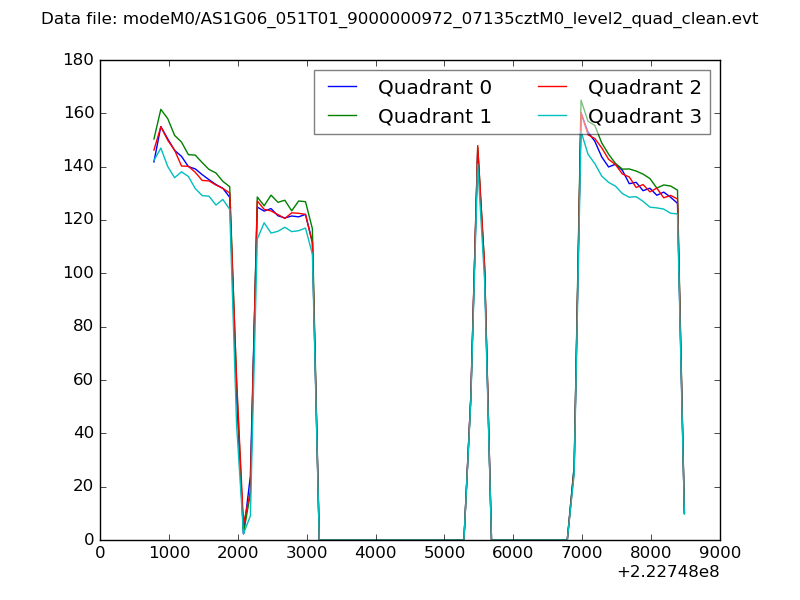
| Quadrant-wise count rates Data is divided into 100 sec bins |
 |
|
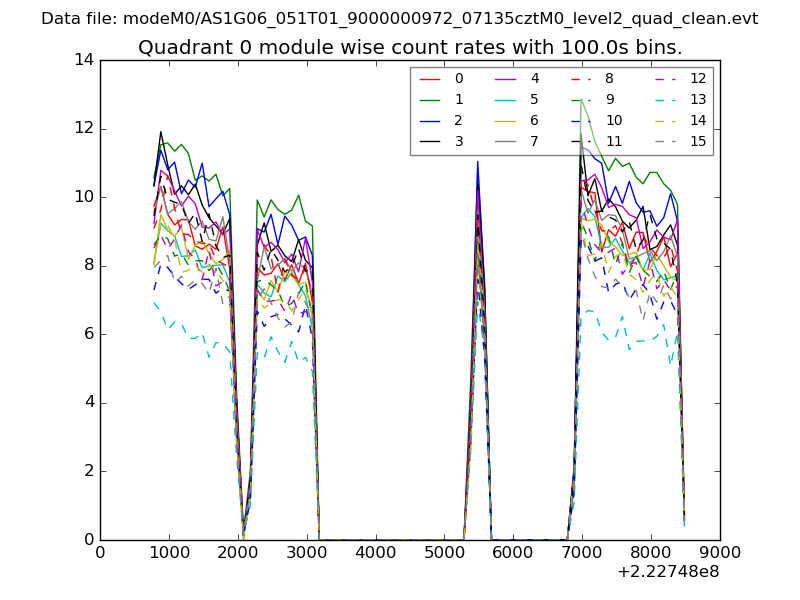
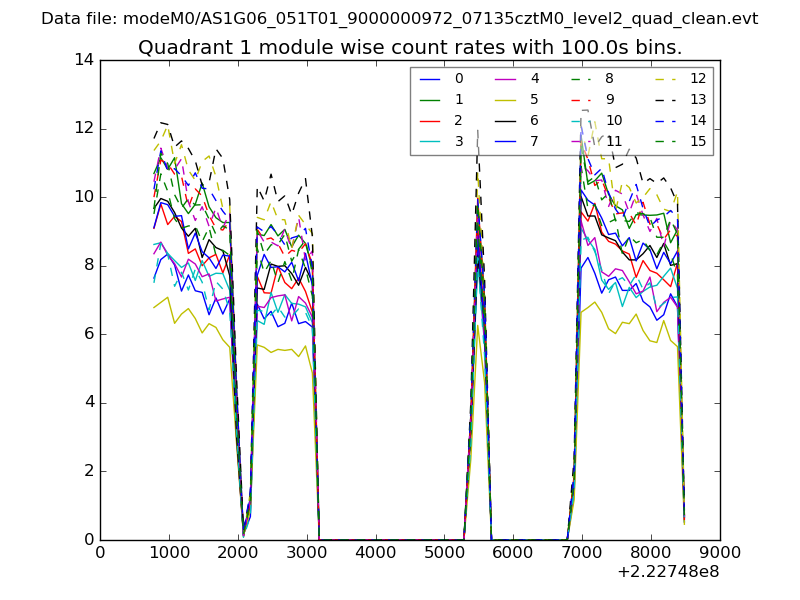
| Module-wise count rates for Quadrant A Data is divided into 100 sec bins |
 |
 |
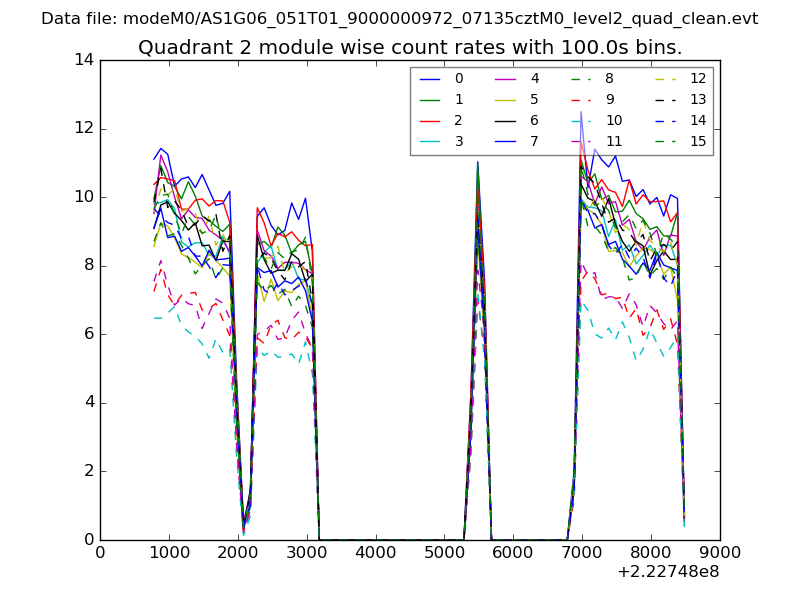
| Module-wise count rates for Quadrant B Data is divided into 100 sec bins |
 |
 |
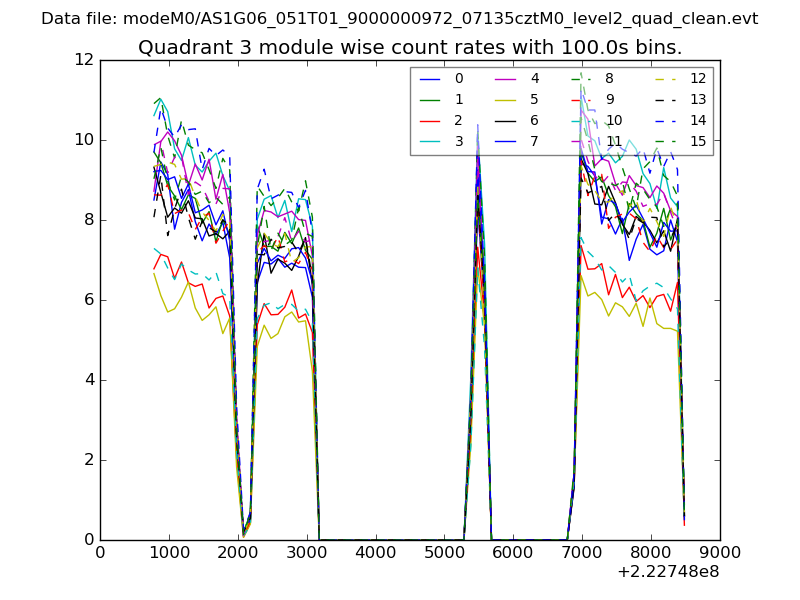
| Module-wise count rates for Quadrant C Data is divided into 100 sec bins |
 |
 |
| Module-wise count rates for Quadrant D Data is divided into 100 sec bins |
 |
 |
| Parameter | Plot |
|---|---|
| CZT HV Monitor | 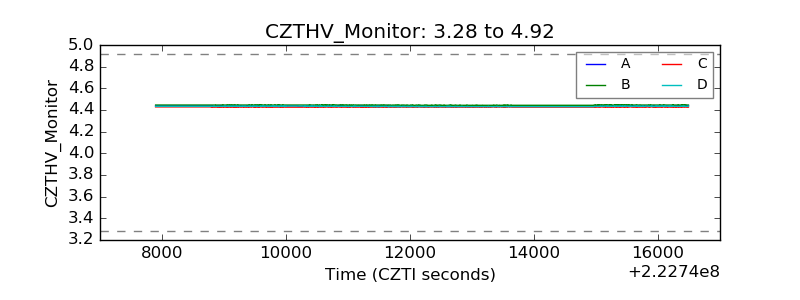 |
| D_VDD | 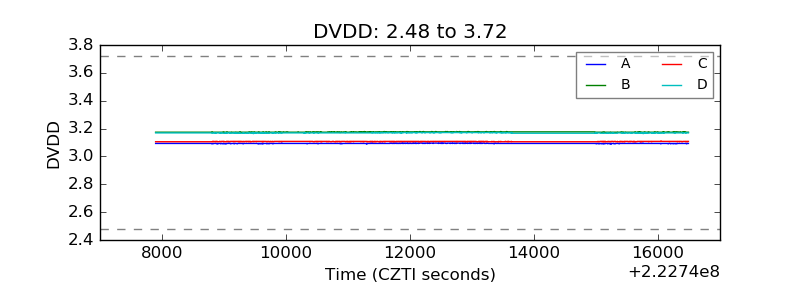 |
| Temperature 1 | 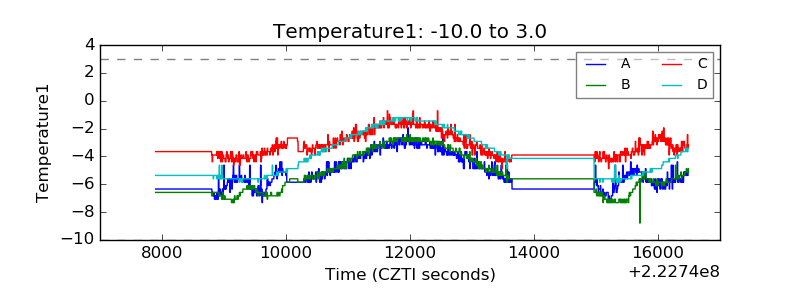 |
| Veto HV Monitor | 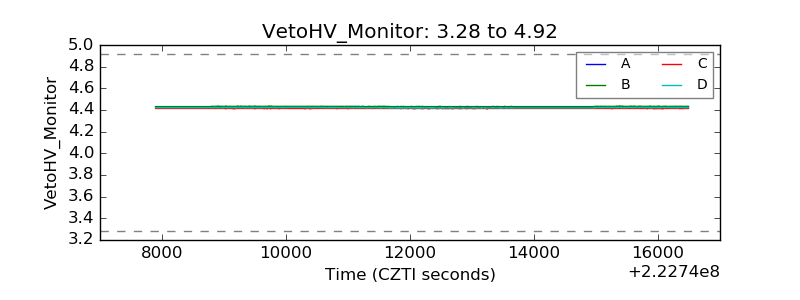 |
| Veto LLD | 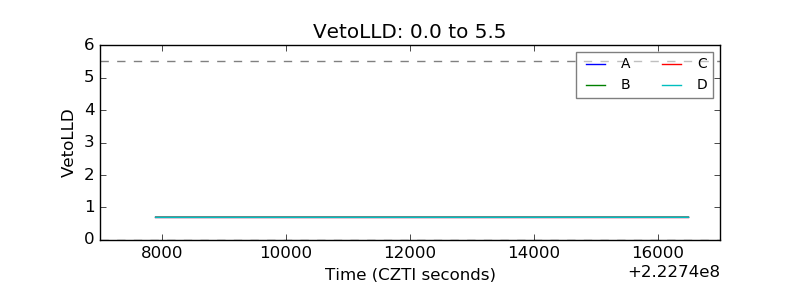 |
| Alpha Counter | 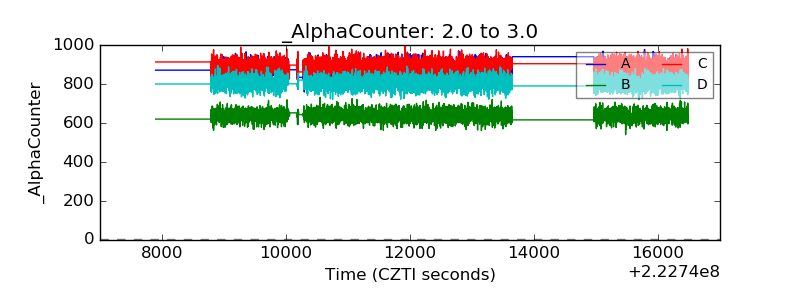 |
| _CPM_Rate | 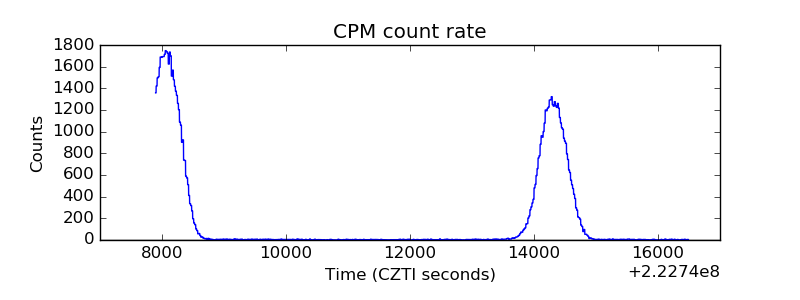 |
| CZT Counter | 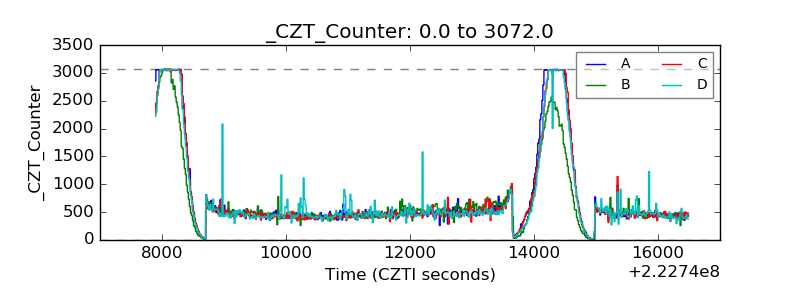 |
| +2.5 Volts monitor |  |
| +5 Volts monitor |  |
| _ROLL_ROT | 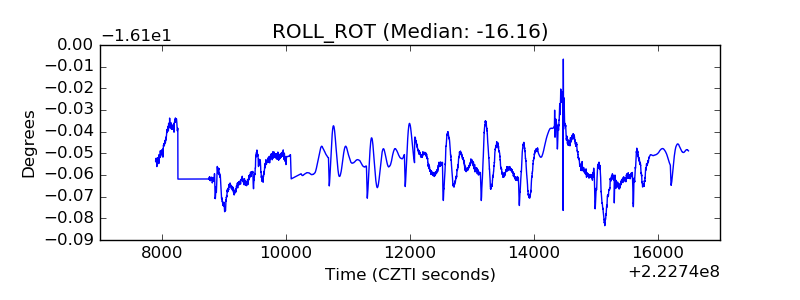 |
| _Roll_DEC | 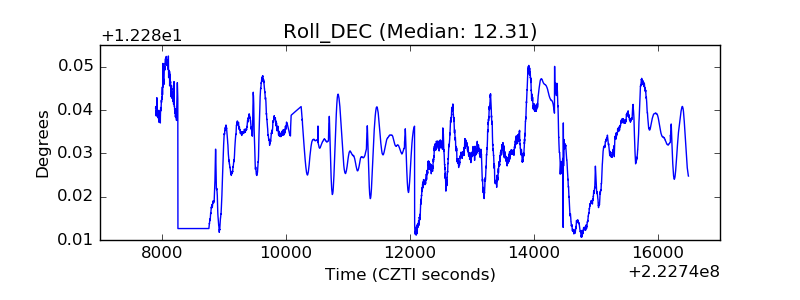 |
| _Roll_RA | 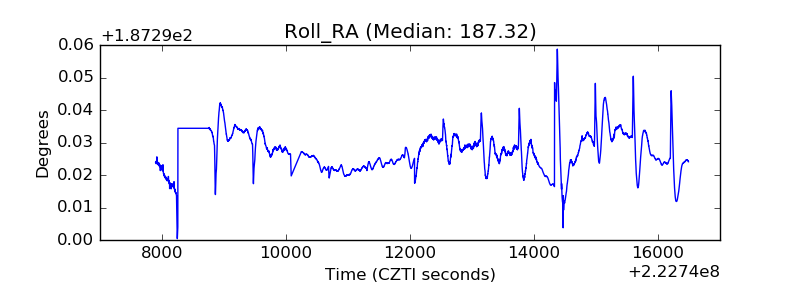 |
| Veto Counter | 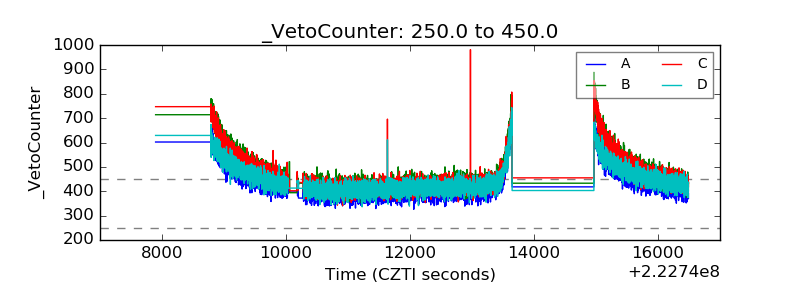 |