| Param | Original file | Final file |
|---|---|---|
| Filename | modeM0/AS1G06_051T01_9000000972_07137cztM0_level2.evt | modeM0/AS1G06_051T01_9000000972_07137cztM0_level2_quad_clean.evt |
| Size (bytes) | 433,837,440 | 86,034,240 |
| Size | 413.7 MB | 82.0 MB |
| Events in quadrant A | 3,229,719 | 541,325 |
| Events in quadrant B | 3,173,322 | 553,943 |
| Events in quadrant C | 3,096,239 | 541,035 |
| Events in quadrant D | 3,201,427 | 519,611 |
| Mode M9 | |||
|---|---|---|---|
| Quadrant | BADHDUFLAG | Total packets | Discarded packets |
| A | 0 | 18 | 0 |
| B | 0 | 18 | 0 |
| C | 0 | 18 | 0 |
| D | 0 | 19 | 0 |
| Mode SS | |||
|---|---|---|---|
| Quadrant | BADHDUFLAG | Total packets | Discarded packets |
| A | 0 | 130 | 0 |
| B | 0 | 130 | 0 |
| C | 0 | 130 | 0 |
| D | 0 | 130 | 0 |
| Mode M0 | |||
|---|---|---|---|
| Quadrant | BADHDUFLAG | Total packets | Discarded packets |
| A | 0 | 13722 | 3 |
| B | 0 | 13440 | 2 |
| C | 0 | 13299 | 2 |
| D | 0 | 13740 | 2 |
| Quadrant | Total seconds | Saturated seconds | Saturation percentage |
|---|---|---|---|
| A | 6445 | 101 | 1.567106% |
| B | 6445 | 75 | 1.163693% |
| C | 6445 | 47 | 0.729247% |
| D | 6445 | 71 | 1.101629% |
Noise dominated data is calculated using 1-second bins in cleaned event files. If a bin has >2000 counts, and if more than 50% of those come from <1% of pixels, then it is considered to be noise-dominated and hence unusable.
| Quadrant | # 1 sec bins | Bins with >0 counts | Bins with >2000 counts | High rate bins dominated by noise | Noise dominated (total time) | Noise dominated (detector-on time) | Marked lightcurve |
|---|---|---|---|---|---|---|---|
| A | 7515 | 6445 | 1 | 1 | 0.01% | 0.02% | 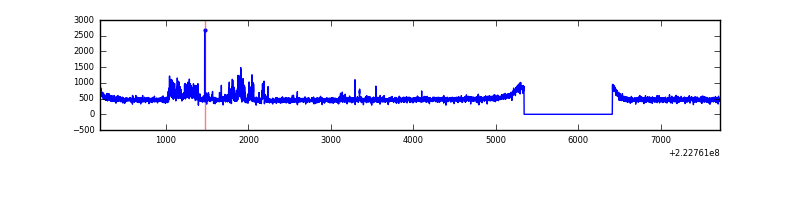 |
| B | 7515 | 6445 | 1 | 1 | 0.01% | 0.02% | 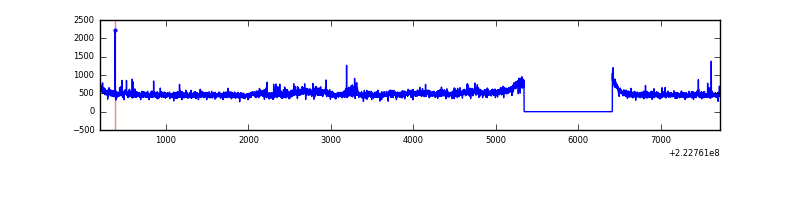 |
| C | 7515 | 6446 | 1 | 1 | 0.01% | 0.02% | 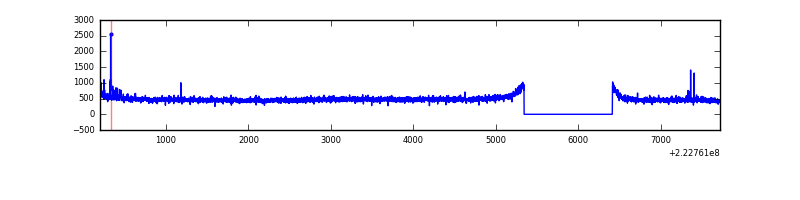 |
| D | 7515 | 6445 | 13 | 13 | 0.17% | 0.20% | 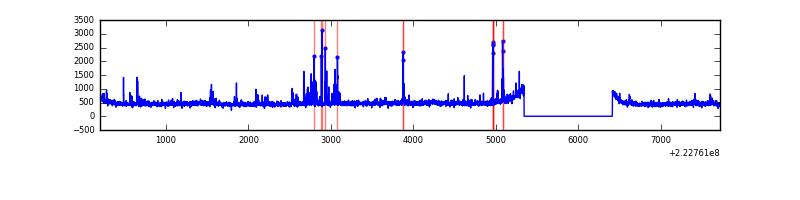 |
Top three noisy pixels from each quadrant. If the there are fewer than three noisy pixels in the level2.evt file, extra rows are filled as -1
| Pixel properties | Quadrant properties | ||||||
|---|---|---|---|---|---|---|---|
| Quadrant | DetID | PixID | Counts | Sigma | Mean | Median | Sigma |
| A | 14 | 111 | 166313 | 1032.72 | 786 | 770 | 160.3 |
| A | 8 | 15 | 21639 | 130.19 | 786 | 770 | 160.3 |
| A | 13 | 248 | 16379 | 97.38 | 786 | 770 | 160.3 |
| B | 0 | 219 | 86441 | 571.29 | 785 | 765 | 150.0 |
| B | 4 | 81 | 27859 | 180.66 | 785 | 765 | 150.0 |
| B | 12 | 111 | 15462 | 98.0 | 785 | 765 | 150.0 |
| C | 9 | 68 | 73937 | 413.38 | 762 | 766 | 177.0 |
| C | 7 | 247 | 30370 | 167.25 | 762 | 766 | 177.0 |
| C | 4 | 254 | 10367 | 54.24 | 762 | 766 | 177.0 |
| D | 2 | 216 | 79931 | 418.13 | 765 | 740 | 189.4 |
| D | 12 | 233 | 78278 | 409.4 | 765 | 740 | 189.4 |
| D | 8 | 195 | 47778 | 248.36 | 765 | 740 | 189.4 |
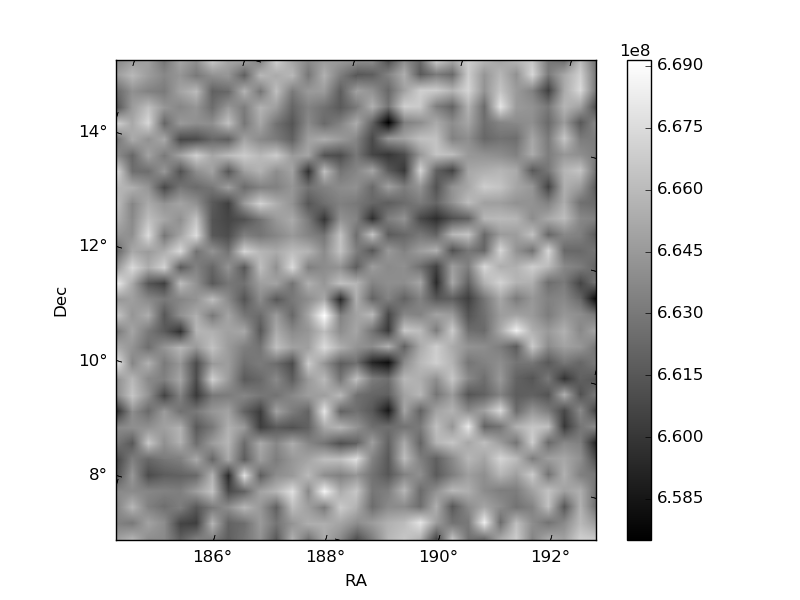
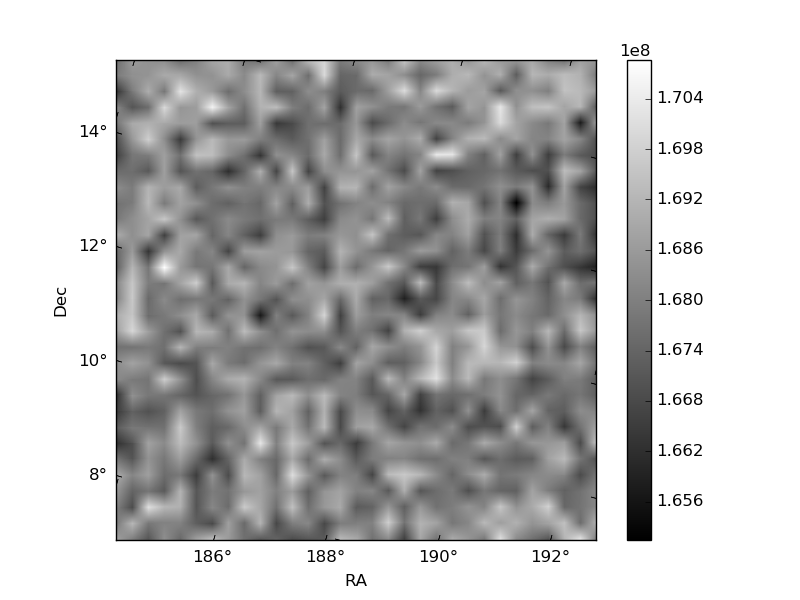
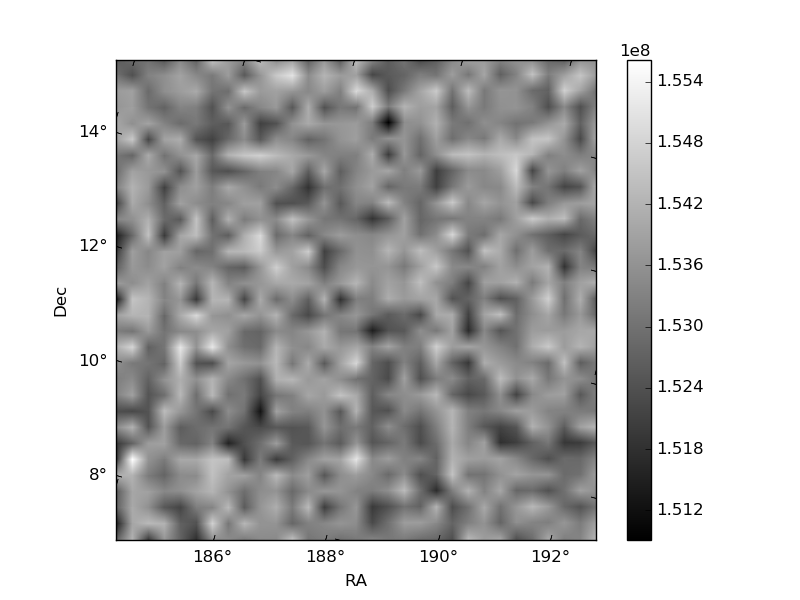
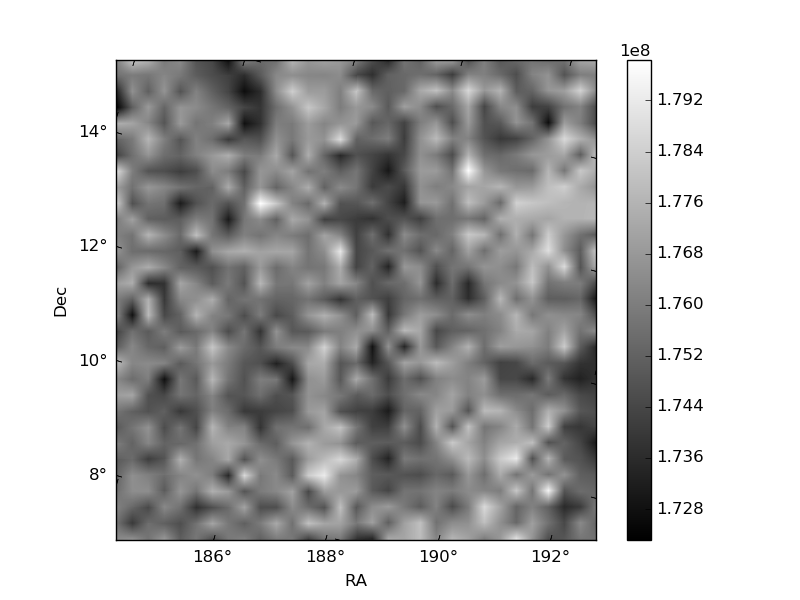
Histogram calculated using DETX and DETY for each event in the final _common_clean file
| Quadrant A | 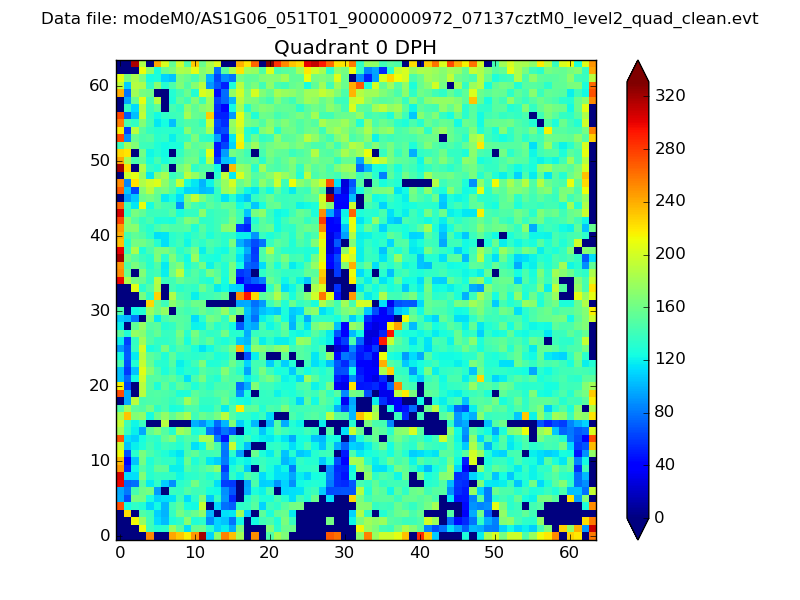 |
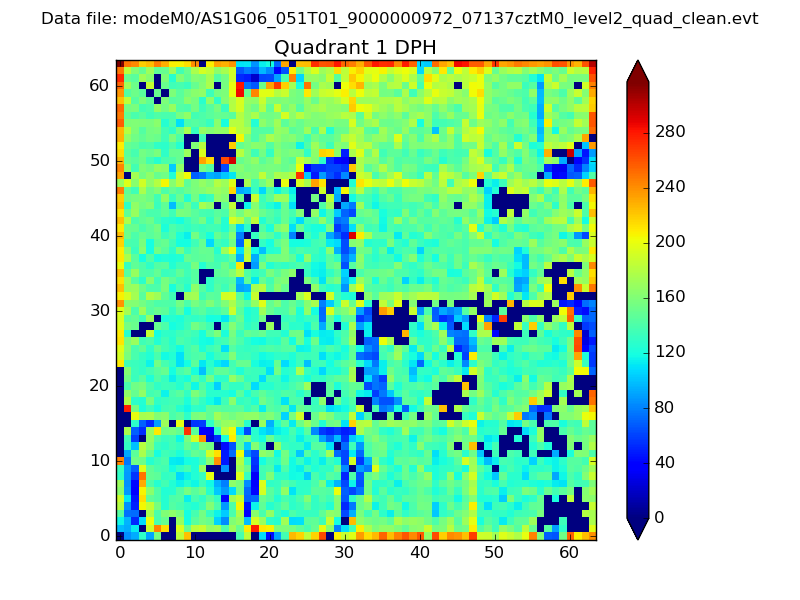 |
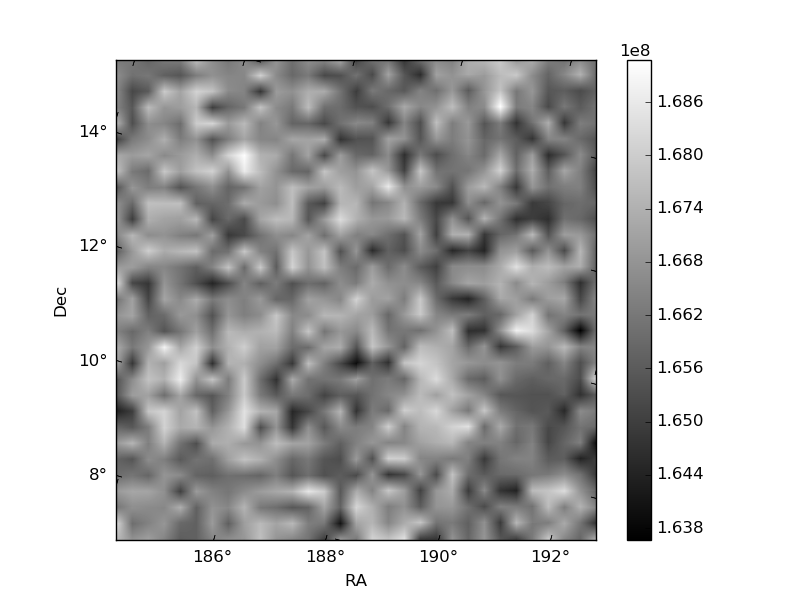
Quadrant B |
|---|---|---|---|
| Quadrant D | 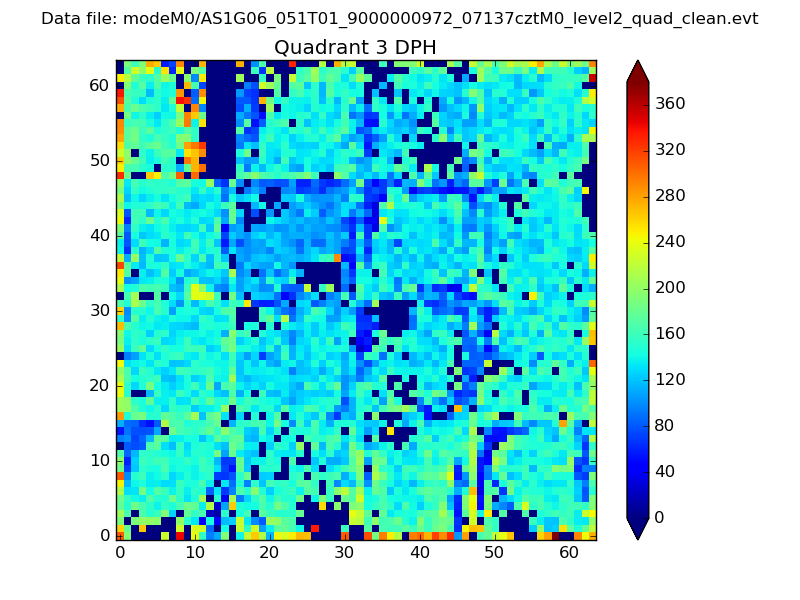 |
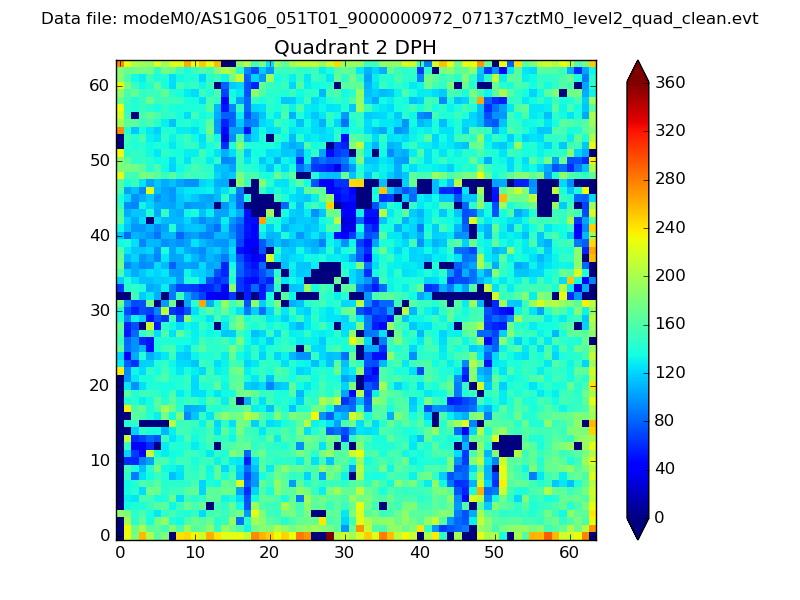 |
Quadrant C |
| Plot type | Count rate plots | Images |
|---|---|---|
| Comparison with Poisson distribution Blue bars denote a histogram of data divided into 1 sec bins. Red curve is a Poisson curve with rate = median count rate of data. |
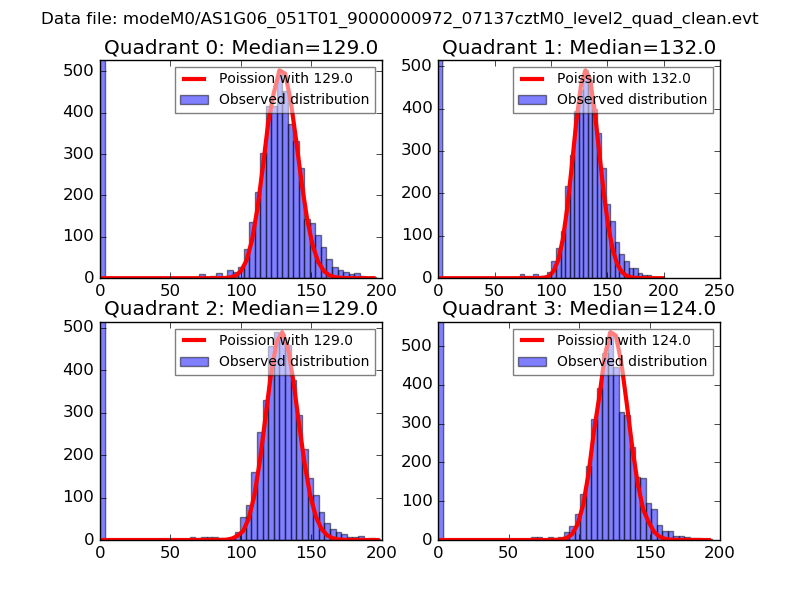 |
 |
| Quadrant-wise count rates Data is divided into 100 sec bins |
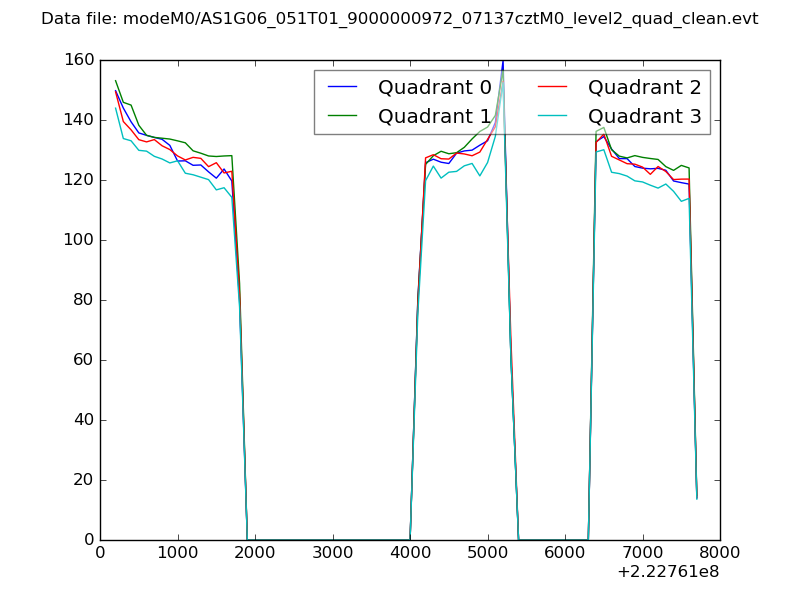 |
|
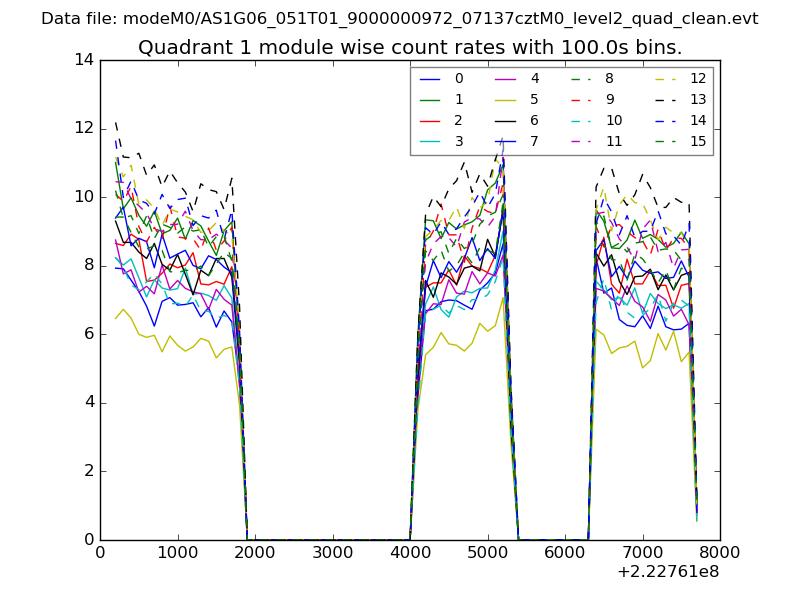
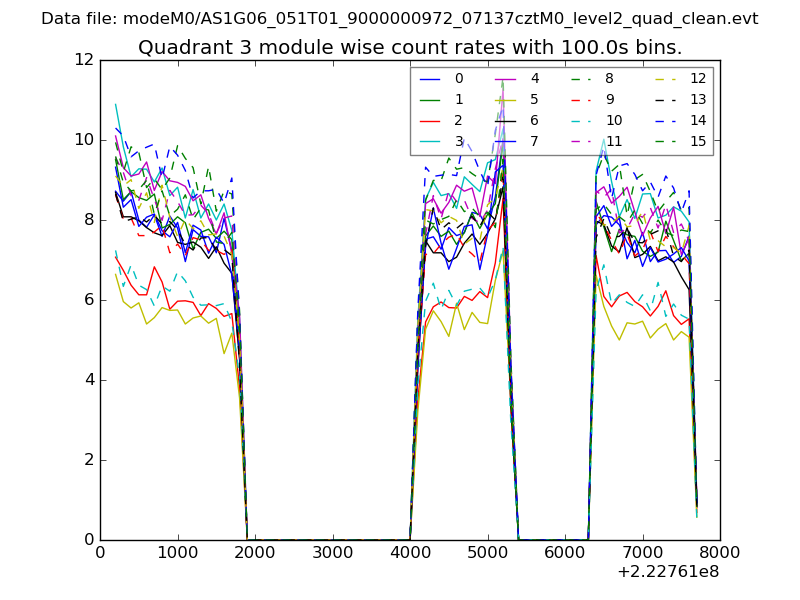
| Module-wise count rates for Quadrant A Data is divided into 100 sec bins |
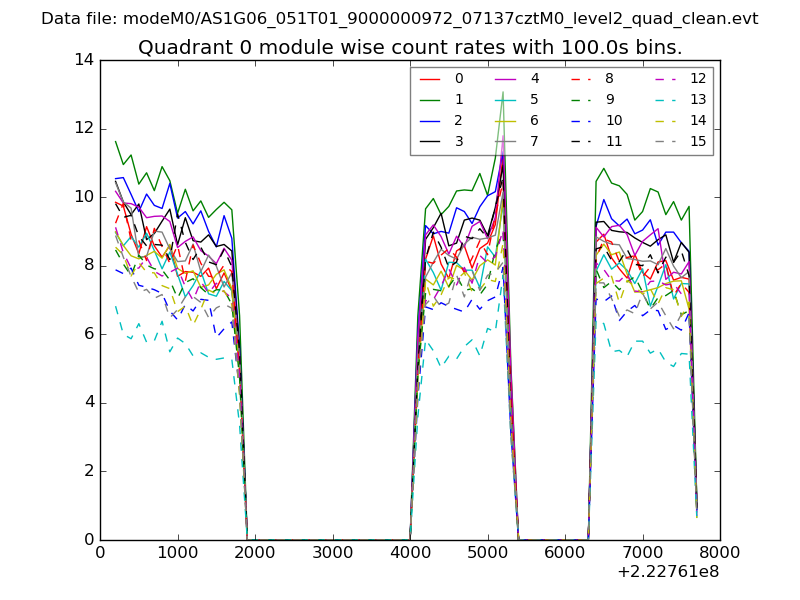 |
 |
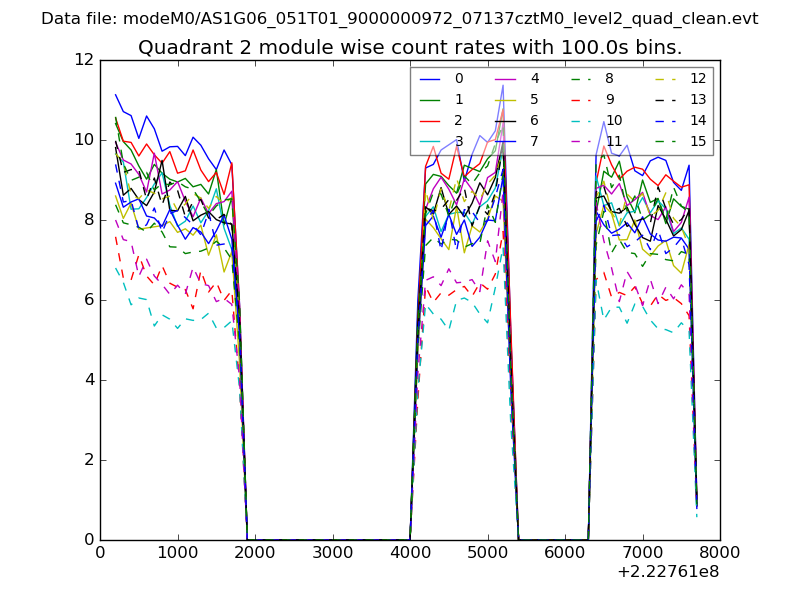
| Module-wise count rates for Quadrant B Data is divided into 100 sec bins |
 |
 |
| Module-wise count rates for Quadrant C Data is divided into 100 sec bins |
 |
 |
| Module-wise count rates for Quadrant D Data is divided into 100 sec bins |
 |
 |
| Parameter | Plot |
|---|---|
| CZT HV Monitor | 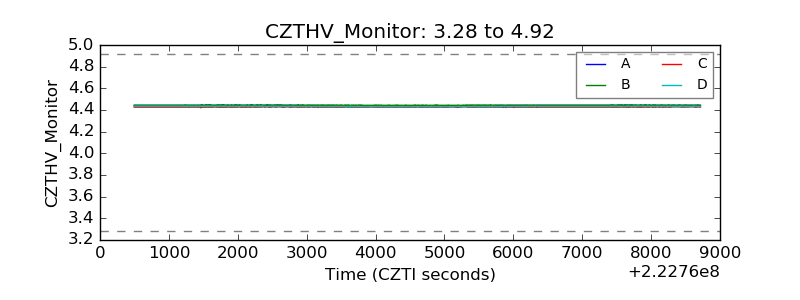 |
| D_VDD | 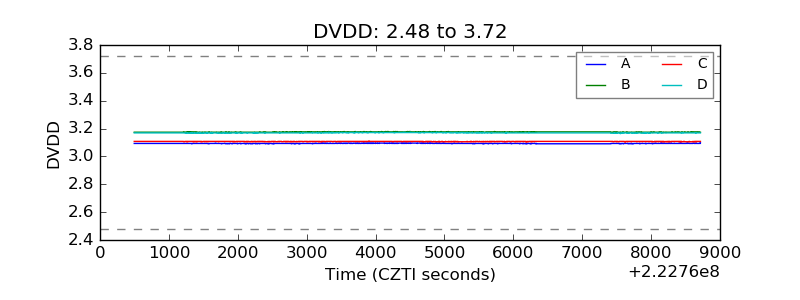 |
| Temperature 1 | 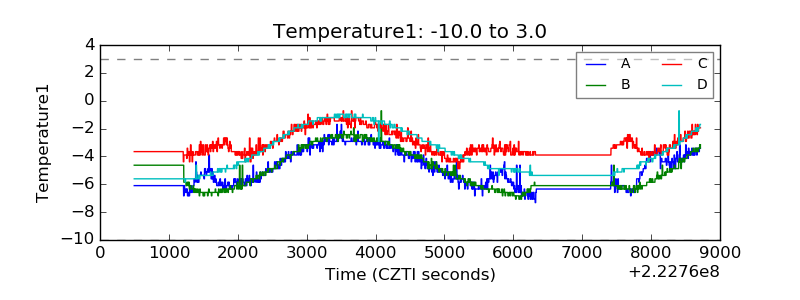 |
| Veto HV Monitor | 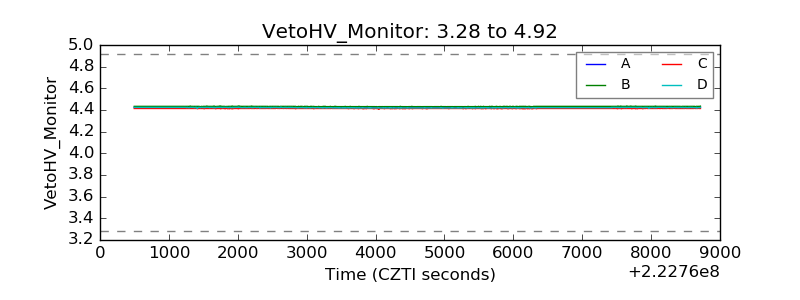 |
| Veto LLD | 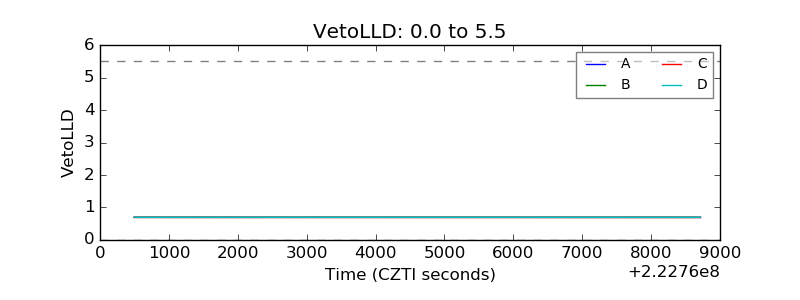 |
| Alpha Counter | 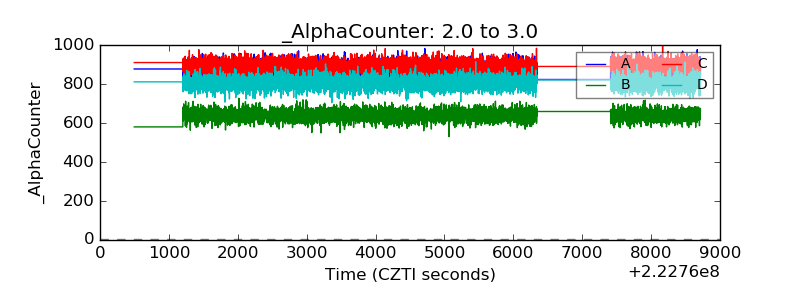 |
| _CPM_Rate | 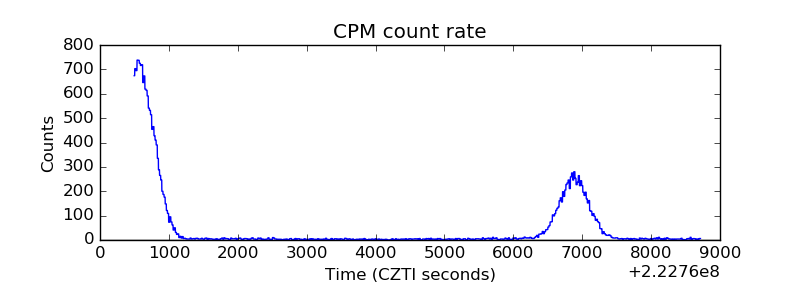 |
| CZT Counter | 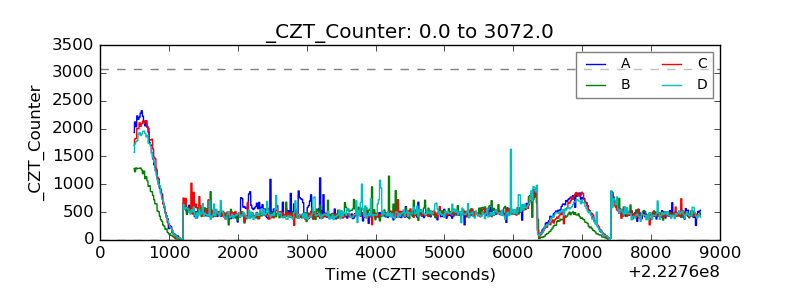 |
| +2.5 Volts monitor |  |
| +5 Volts monitor |  |
| _ROLL_ROT | 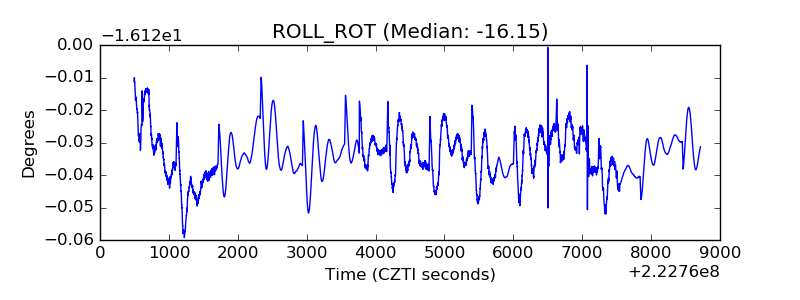 |
| _Roll_DEC | 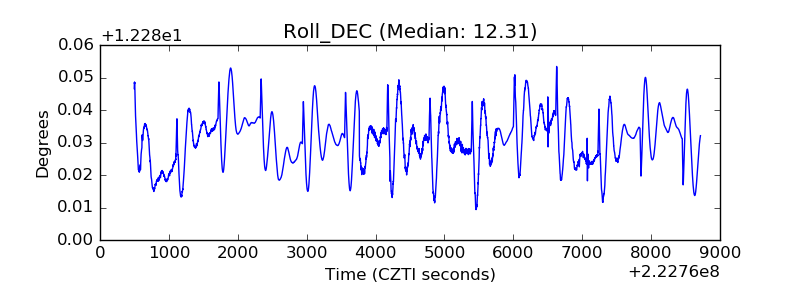 |
| _Roll_RA | 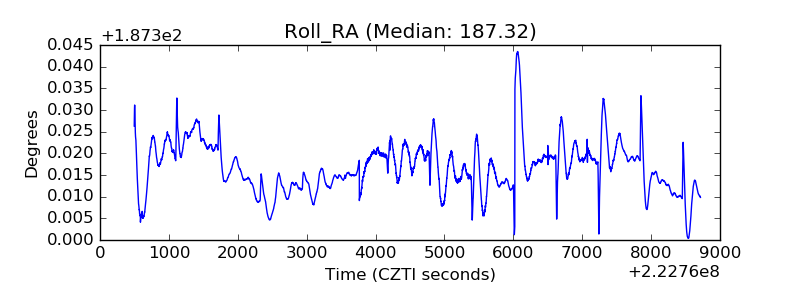 |
| Veto Counter | 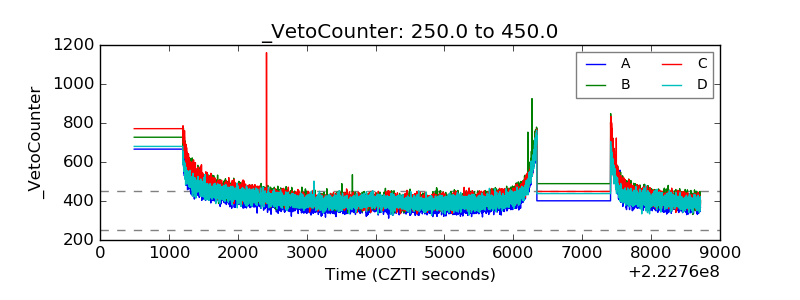 |