| Param | Original file | Final file |
|---|---|---|
| Filename | modeM0/AS1G06_051T01_9000000972_07138cztM0_level2.evt | modeM0/AS1G06_051T01_9000000972_07138cztM0_level2_quad_clean.evt |
| Size (bytes) | 454,726,080 | 82,408,320 |
| Size | 433.7 MB | 78.6 MB |
| Events in quadrant A | 3,255,535 | 503,278 |
| Events in quadrant B | 3,335,114 | 513,769 |
| Events in quadrant C | 3,295,276 | 505,751 |
| Events in quadrant D | 3,412,827 | 488,646 |
| Mode M9 | |||
|---|---|---|---|
| Quadrant | BADHDUFLAG | Total packets | Discarded packets |
| A | 0 | 7 | 0 |
| B | 0 | 7 | 0 |
| C | 0 | 7 | 0 |
| D | 0 | 7 | 0 |
| Mode SS | |||
|---|---|---|---|
| Quadrant | BADHDUFLAG | Total packets | Discarded packets |
| A | 0 | 140 | 0 |
| B | 0 | 140 | 0 |
| C | 0 | 140 | 0 |
| D | 0 | 140 | 0 |
| Mode M0 | |||
|---|---|---|---|
| Quadrant | BADHDUFLAG | Total packets | Discarded packets |
| A | 0 | 14281 | 2 |
| B | 0 | 14354 | 1 |
| C | 0 | 14392 | 1 |
| D | 0 | 14865 | 1 |
| Quadrant | Total seconds | Saturated seconds | Saturation percentage |
|---|---|---|---|
| A | 6950 | 138 | 1.985612% |
| B | 6950 | 139 | 2.000000% |
| C | 6950 | 113 | 1.625899% |
| D | 6950 | 129 | 1.856115% |
Noise dominated data is calculated using 1-second bins in cleaned event files. If a bin has >2000 counts, and if more than 50% of those come from <1% of pixels, then it is considered to be noise-dominated and hence unusable.
| Quadrant | # 1 sec bins | Bins with >0 counts | Bins with >2000 counts | High rate bins dominated by noise | Noise dominated (total time) | Noise dominated (detector-on time) | Marked lightcurve |
|---|---|---|---|---|---|---|---|
| A | 7665 | 6950 | 0 | 0 | 0.00% | 0.00% | 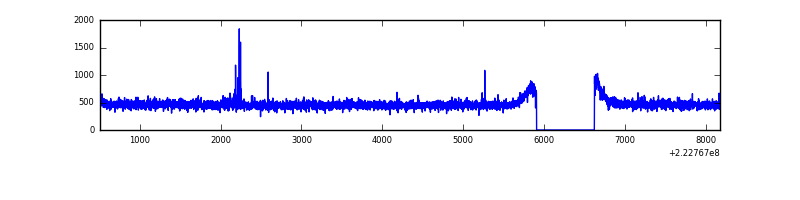 |
| B | 7665 | 6950 | 1 | 1 | 0.01% | 0.01% | 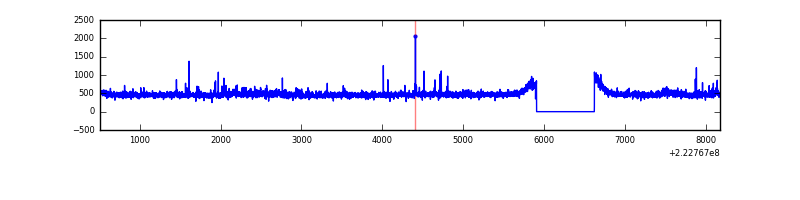 |
| C | 7665 | 6950 | 0 | 0 | 0.00% | 0.00% | 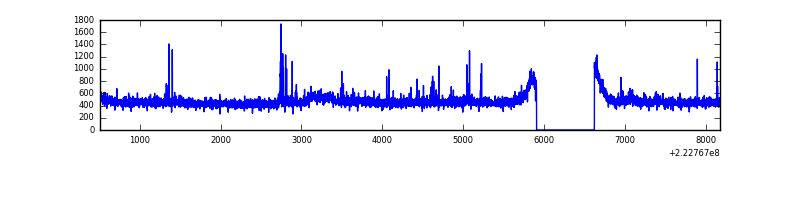 |
| D | 7665 | 6950 | 8 | 8 | 0.10% | 0.12% | 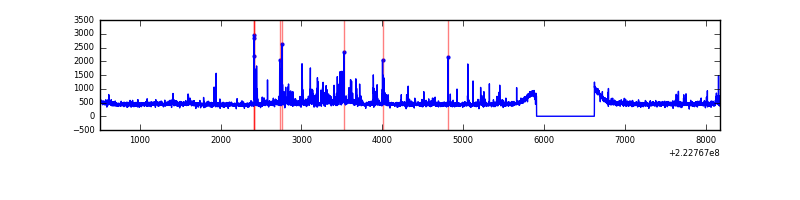 |
Top three noisy pixels from each quadrant. If the there are fewer than three noisy pixels in the level2.evt file, extra rows are filled as -1
| Pixel properties | Quadrant properties | ||||||
|---|---|---|---|---|---|---|---|
| Quadrant | DetID | PixID | Counts | Sigma | Mean | Median | Sigma |
| A | 8 | 15 | 45300 | 260.36 | 831 | 810 | 170.9 |
| A | 0 | 226 | 7996 | 42.05 | 831 | 810 | 170.9 |
| A | 12 | 194 | 7449 | 38.85 | 831 | 810 | 170.9 |
| B | 0 | 214 | 46853 | 286.91 | 832 | 812 | 160.5 |
| B | 0 | 219 | 39184 | 239.12 | 832 | 812 | 160.5 |
| B | 12 | 111 | 16714 | 99.1 | 832 | 812 | 160.5 |
| C | 4 | 254 | 57477 | 301.95 | 806 | 809 | 187.7 |
| C | 9 | 68 | 57245 | 300.71 | 806 | 809 | 187.7 |
| C | 9 | 15 | 15058 | 75.92 | 806 | 809 | 187.7 |
| D | 2 | 216 | 144466 | 726.0 | 810 | 785 | 197.9 |
| D | 12 | 233 | 69020 | 344.78 | 810 | 785 | 197.9 |
| D | 8 | 195 | 55023 | 274.06 | 810 | 785 | 197.9 |
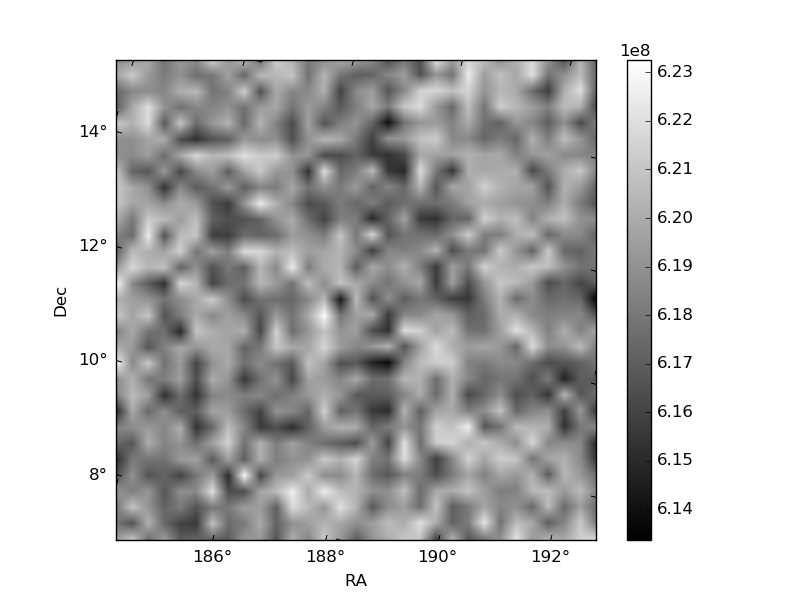
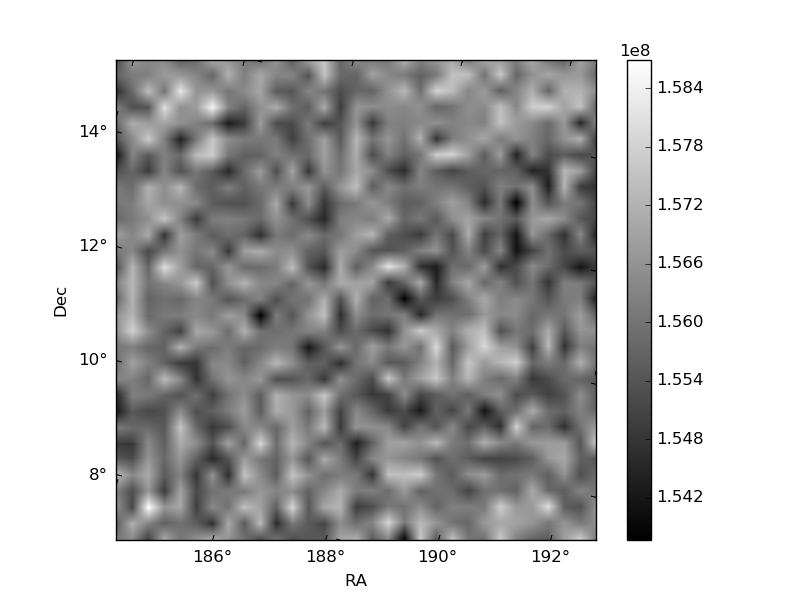
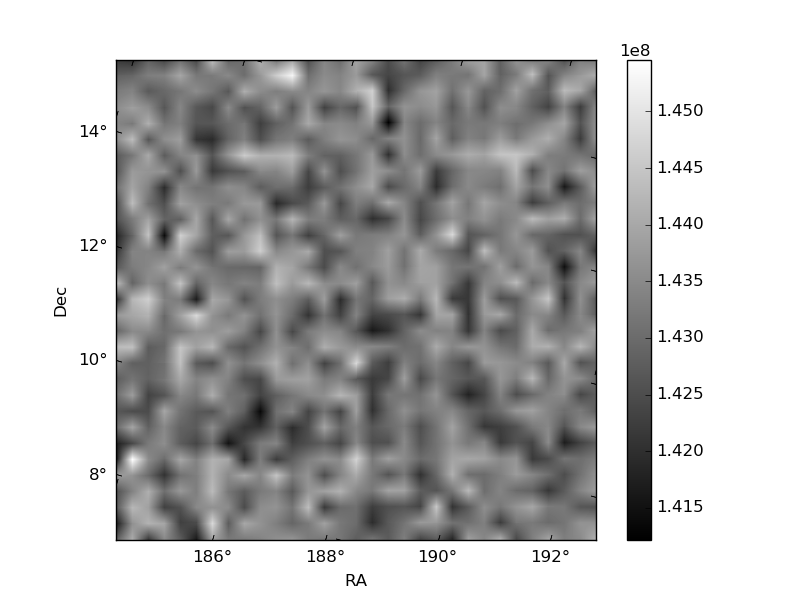
Histogram calculated using DETX and DETY for each event in the final _common_clean file
| Quadrant A | 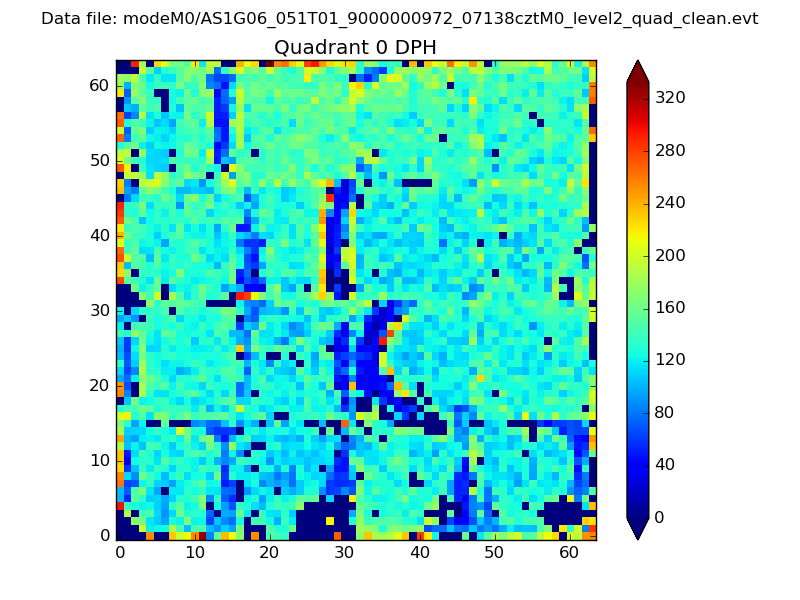 |
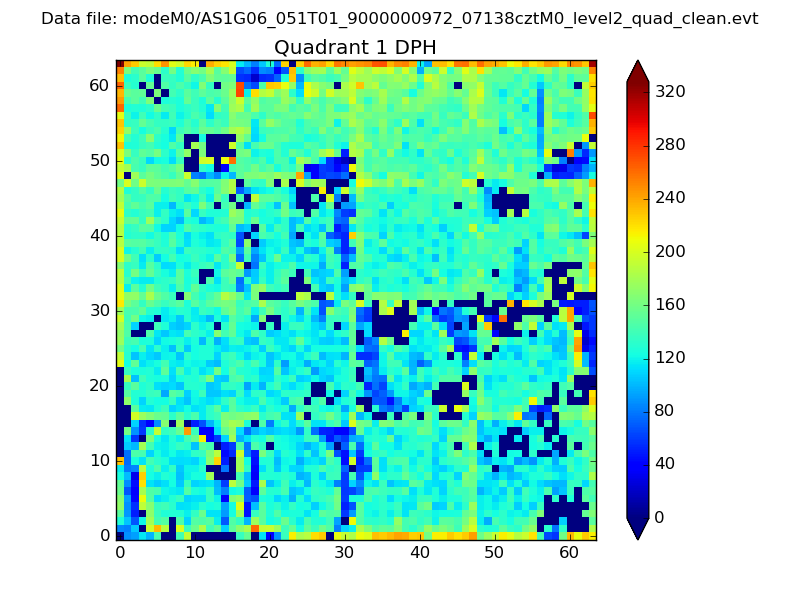 |
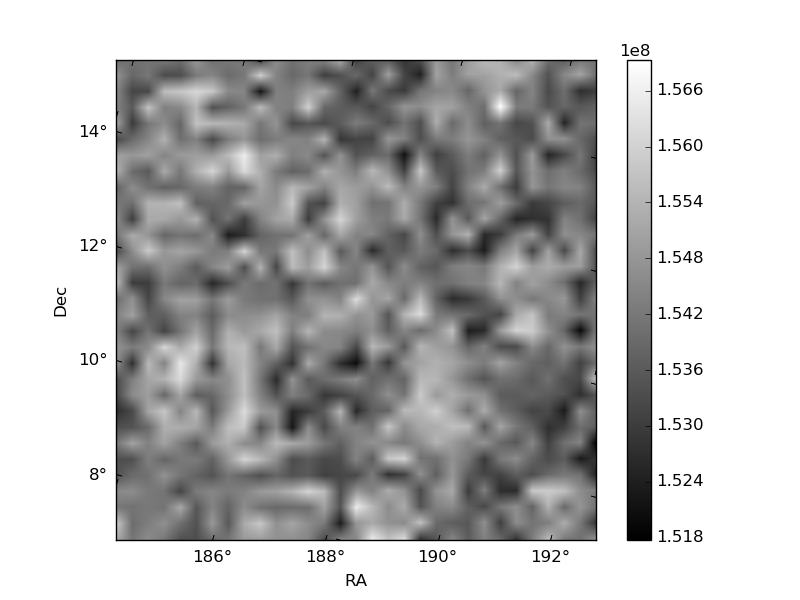
Quadrant B |
|---|---|---|---|
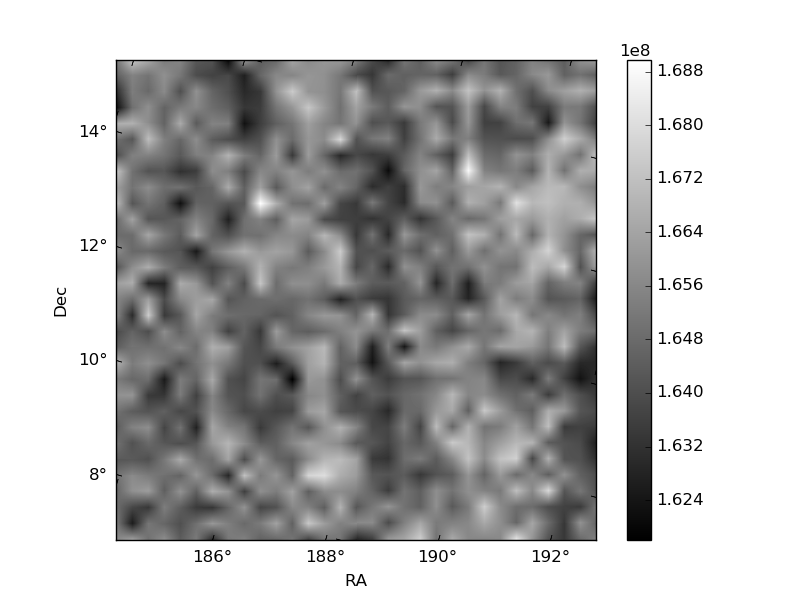
| Quadrant D | 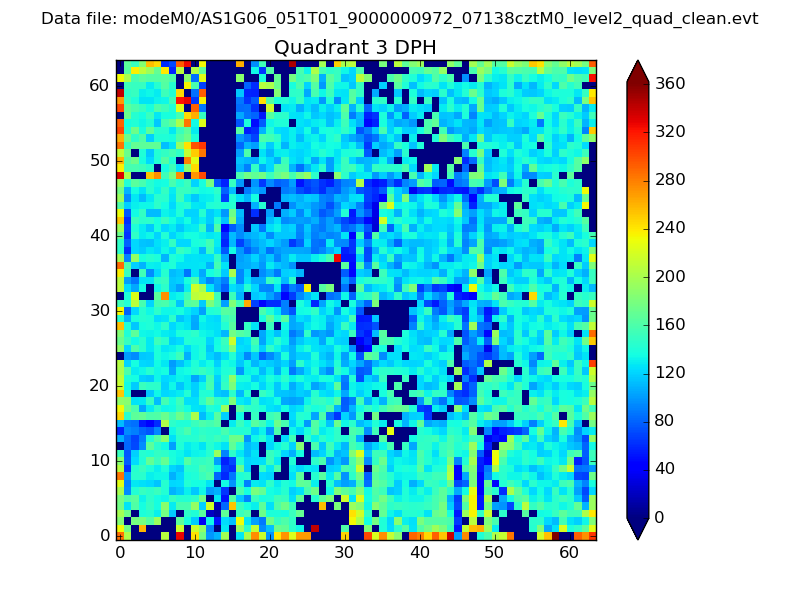 |
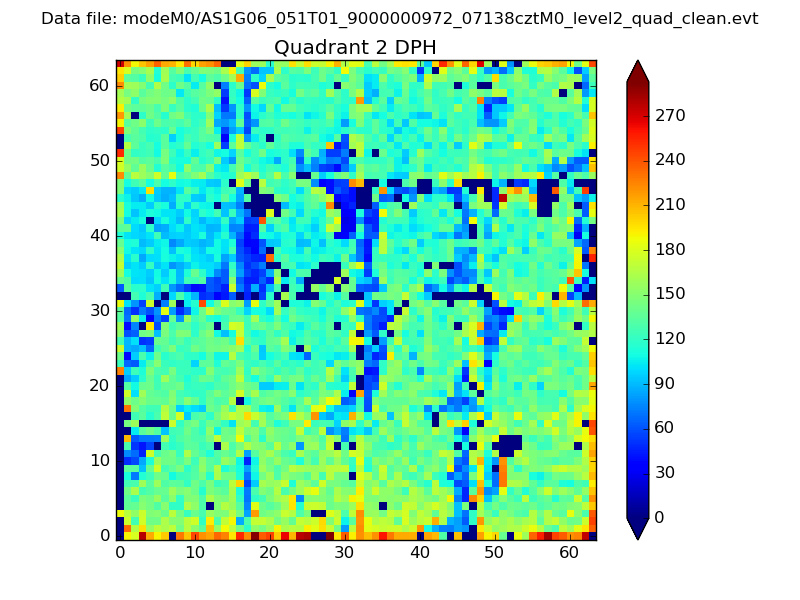 |
Quadrant C |
| Plot type | Count rate plots | Images |
|---|---|---|
| Comparison with Poisson distribution Blue bars denote a histogram of data divided into 1 sec bins. Red curve is a Poisson curve with rate = median count rate of data. |
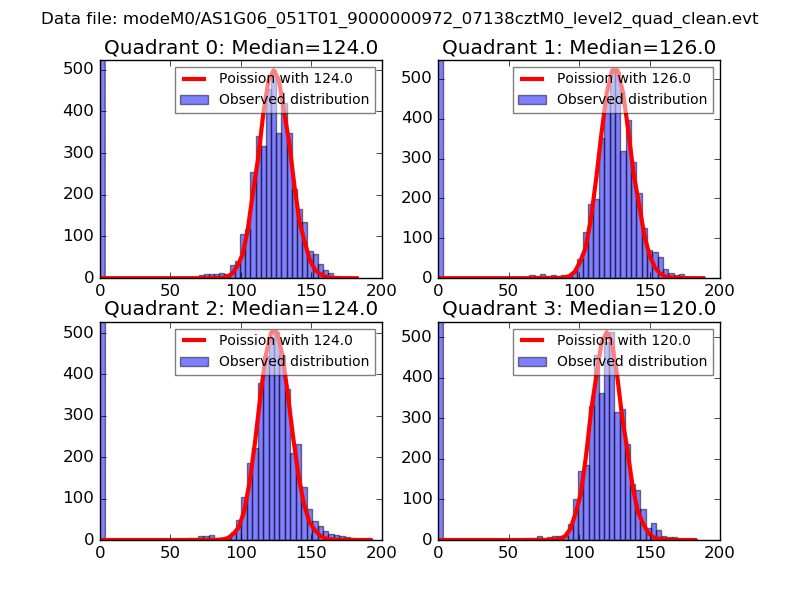 |
 |
| Quadrant-wise count rates Data is divided into 100 sec bins |
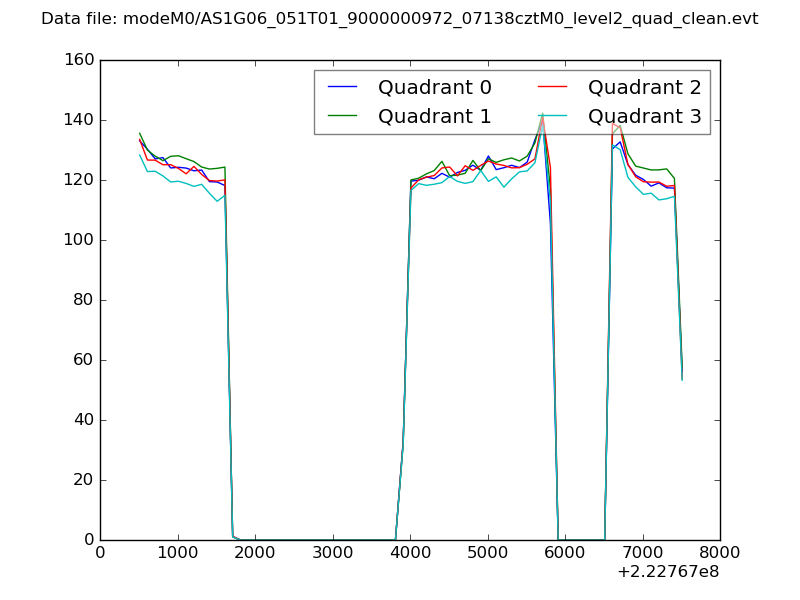 |
|
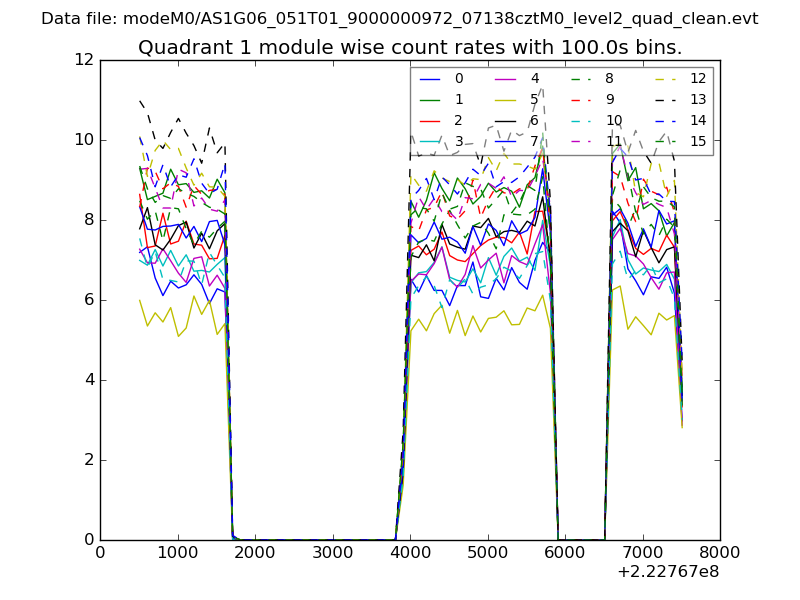
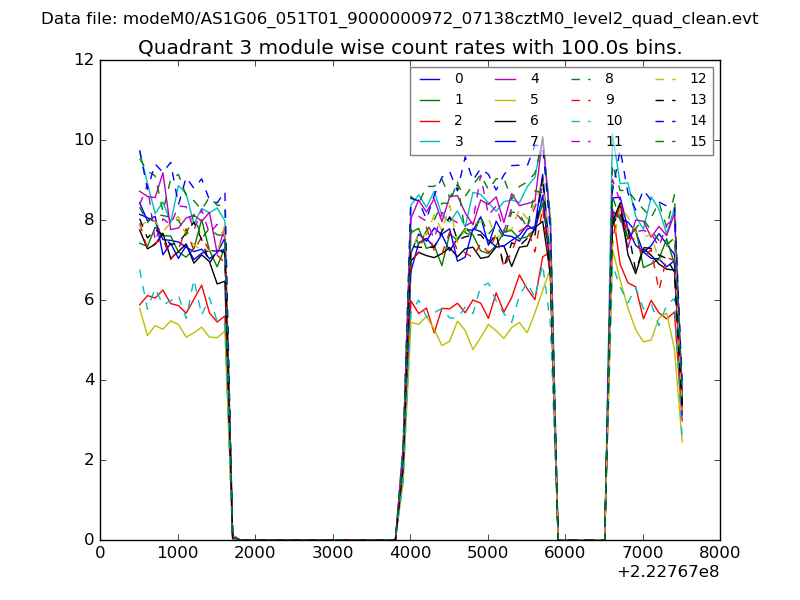
| Module-wise count rates for Quadrant A Data is divided into 100 sec bins |
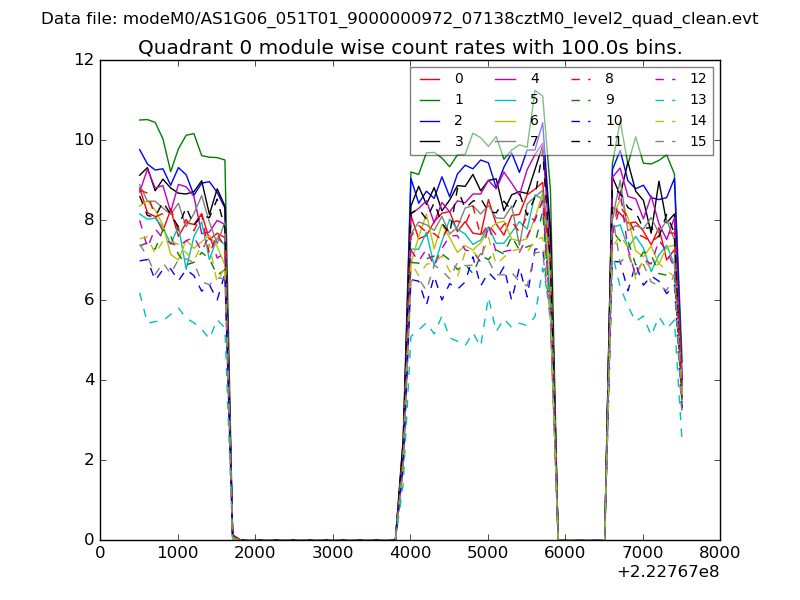 |
 |
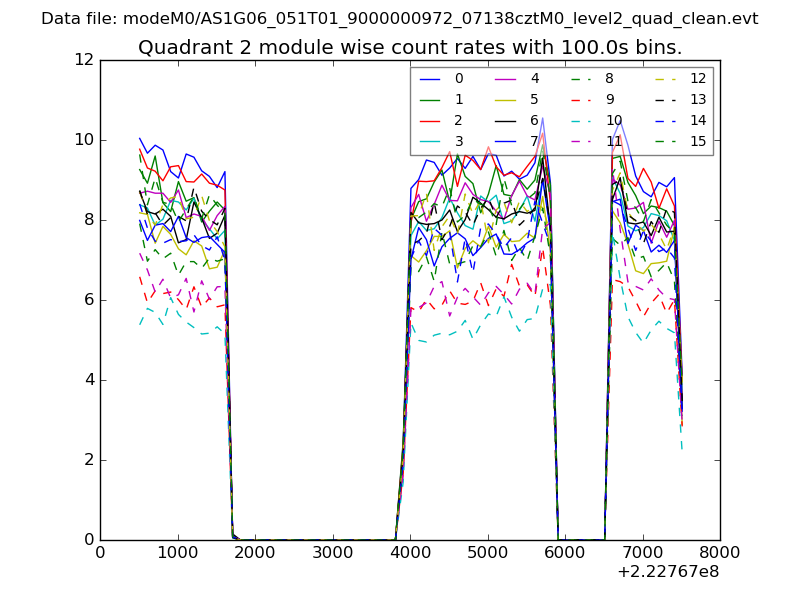
| Module-wise count rates for Quadrant B Data is divided into 100 sec bins |
 |
 |
| Module-wise count rates for Quadrant C Data is divided into 100 sec bins |
 |
 |
| Module-wise count rates for Quadrant D Data is divided into 100 sec bins |
 |
 |
| Parameter | Plot |
|---|---|
| CZT HV Monitor | 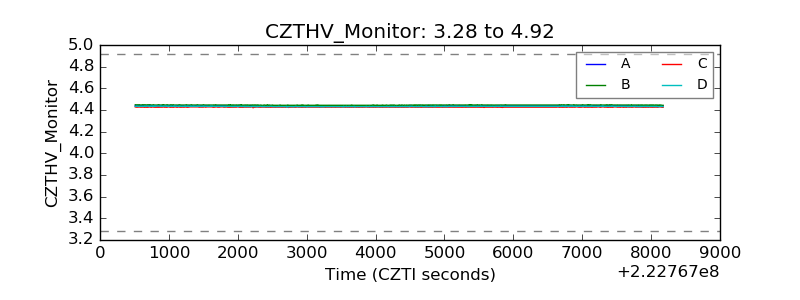 |
| D_VDD | 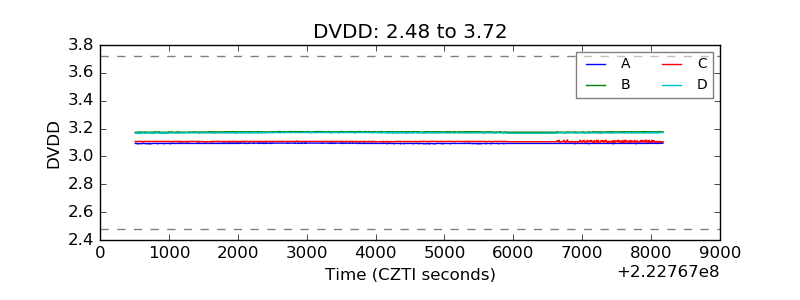 |
| Temperature 1 | 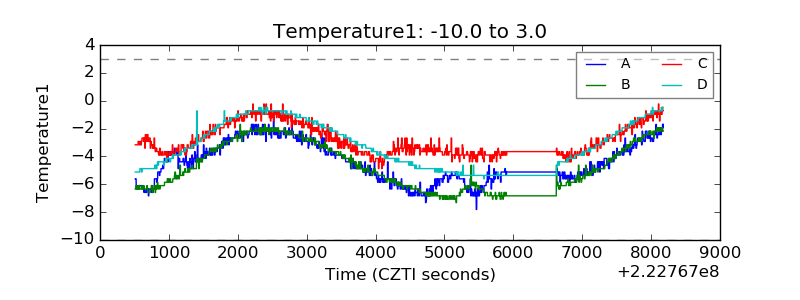 |
| Veto HV Monitor | 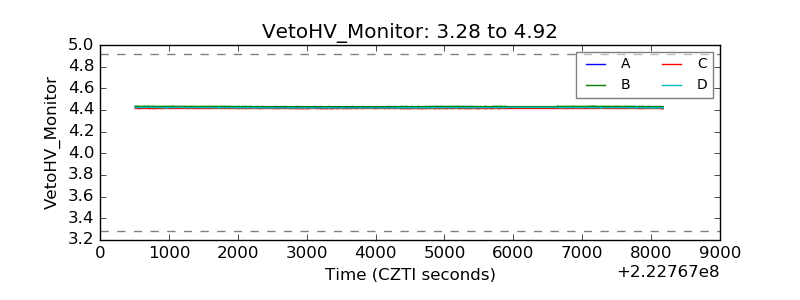 |
| Veto LLD | 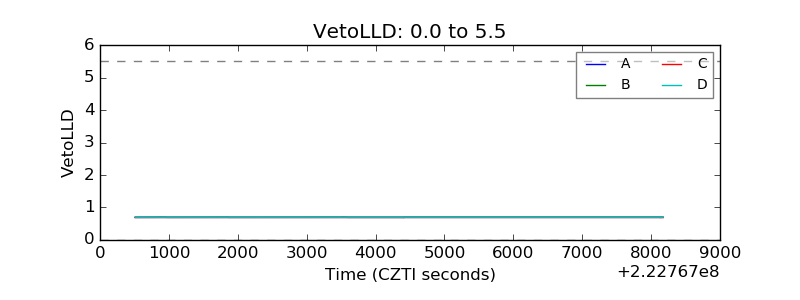 |
| Alpha Counter | 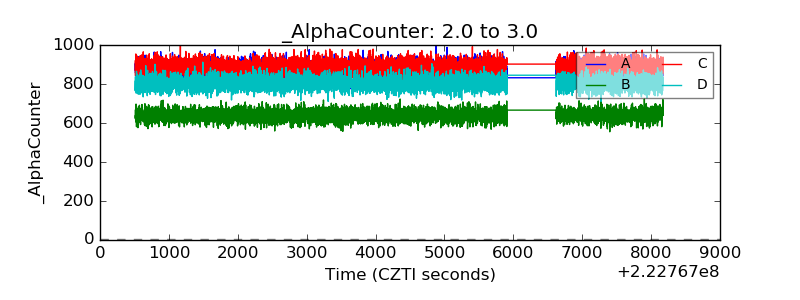 |
| _CPM_Rate | 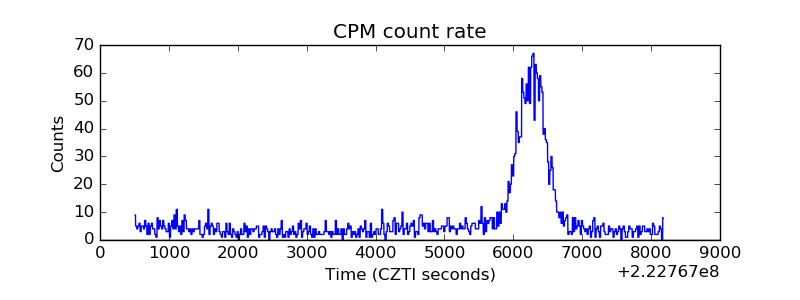 |
| CZT Counter | 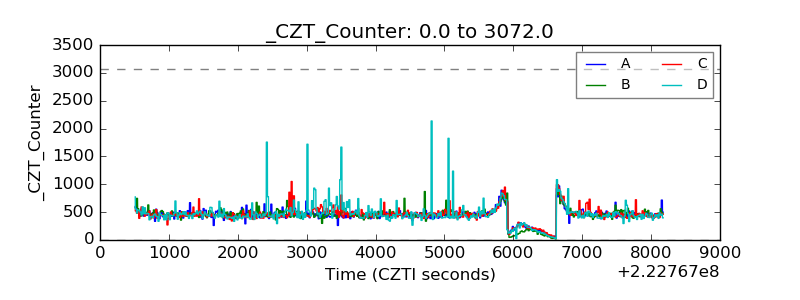 |
| +2.5 Volts monitor |  |
| +5 Volts monitor |  |
| _ROLL_ROT | 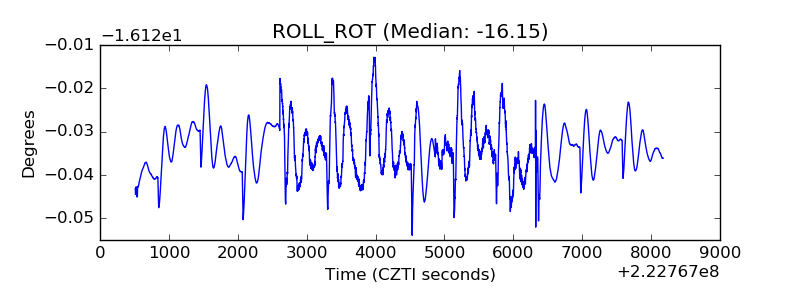 |
| _Roll_DEC | 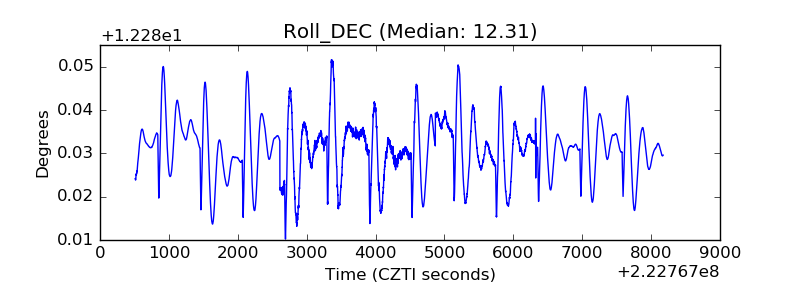 |
| _Roll_RA | 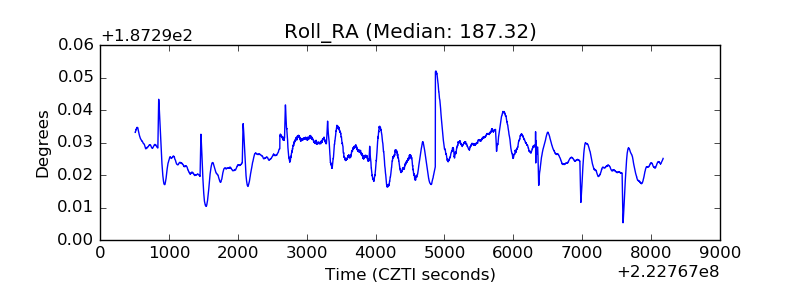 |
| Veto Counter | 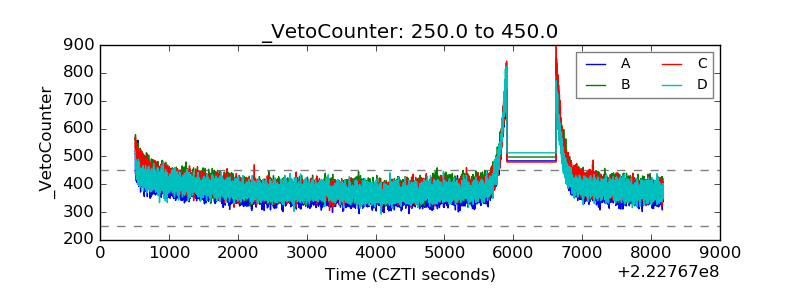 |