| Param | Original file | Final file |
|---|---|---|
| Filename | modeM0/AS1G06_051T01_9000000972_07141cztM0_level2.evt | modeM0/AS1G06_051T01_9000000972_07141cztM0_level2_quad_clean.evt |
| Size (bytes) | 573,215,040 | 81,774,720 |
| Size | 546.7 MB | 78.0 MB |
| Events in quadrant A | 3,862,777 | 483,388 |
| Events in quadrant B | 4,049,200 | 490,123 |
| Events in quadrant C | 3,845,005 | 483,198 |
| Events in quadrant D | 5,055,690 | 458,913 |
| Mode M9 | |||
|---|---|---|---|
| Quadrant | BADHDUFLAG | Total packets | Discarded packets |
| A | 0 | 4 | 0 |
| B | 0 | 4 | 0 |
| C | 0 | 4 | 0 |
| D | 0 | 4 | 0 |
| Mode SS | |||
|---|---|---|---|
| Quadrant | BADHDUFLAG | Total packets | Discarded packets |
| A | 0 | 168 | 0 |
| B | 0 | 168 | 0 |
| C | 0 | 168 | 0 |
| D | 0 | 168 | 0 |
| Mode M0 | |||
|---|---|---|---|
| Quadrant | BADHDUFLAG | Total packets | Discarded packets |
| A | 0 | 16942 | 45 |
| B | 0 | 17341 | 68 |
| C | 0 | 17030 | 42 |
| D | 0 | 20539 | 111 |
| Quadrant | Total seconds | Saturated seconds | Saturation percentage |
|---|---|---|---|
| A | 8055 | 244 | 3.029174% |
| B | 8045 | 259 | 3.219391% |
| C | 8057 | 219 | 2.718133% |
| D | 8044 | 412 | 5.121830% |
Noise dominated data is calculated using 1-second bins in cleaned event files. If a bin has >2000 counts, and if more than 50% of those come from <1% of pixels, then it is considered to be noise-dominated and hence unusable.
| Quadrant | # 1 sec bins | Bins with >0 counts | Bins with >2000 counts | High rate bins dominated by noise | Noise dominated (total time) | Noise dominated (detector-on time) | Marked lightcurve |
|---|---|---|---|---|---|---|---|
| A | 8566 | 8076 | 0 | 0 | 0.00% | 0.00% | 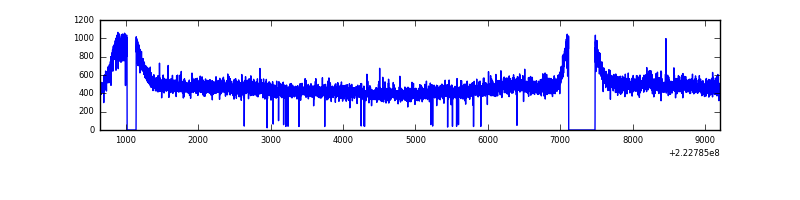 |
| B | 8566 | 8076 | 0 | 0 | 0.00% | 0.00% | 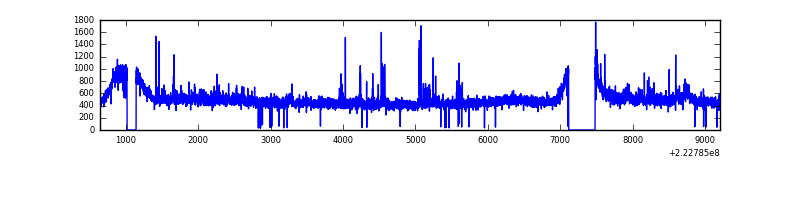 |
| C | 8566 | 8076 | 1 | 1 | 0.01% | 0.01% | 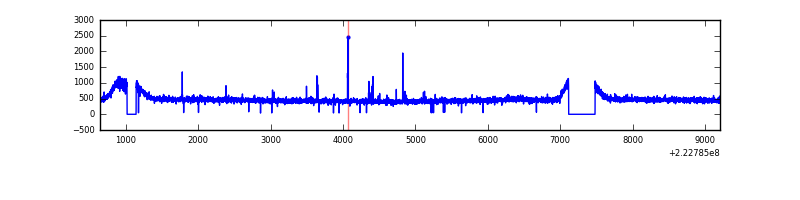 |
| D | 8566 | 8076 | 156 | 156 | 1.82% | 1.93% | 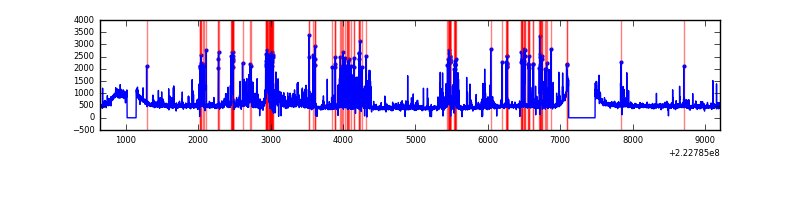 |
Top three noisy pixels from each quadrant. If the there are fewer than three noisy pixels in the level2.evt file, extra rows are filled as -1
| Pixel properties | Quadrant properties | ||||||
|---|---|---|---|---|---|---|---|
| Quadrant | DetID | PixID | Counts | Sigma | Mean | Median | Sigma |
| A | 8 | 15 | 34394 | 162.53 | 994 | 972 | 205.6 |
| A | 0 | 226 | 9356 | 40.77 | 994 | 972 | 205.6 |
| A | 12 | 194 | 8971 | 38.9 | 994 | 972 | 205.6 |
| B | 0 | 214 | 96391 | 488.62 | 992 | 967 | 195.3 |
| B | 4 | 81 | 45519 | 228.13 | 992 | 967 | 195.3 |
| B | 0 | 219 | 39883 | 199.27 | 992 | 967 | 195.3 |
| C | 4 | 254 | 36425 | 157.07 | 965 | 971 | 225.7 |
| C | 8 | 128 | 14366 | 59.34 | 965 | 971 | 225.7 |
| C | 1 | 16 | 10981 | 44.35 | 965 | 971 | 225.7 |
| D | 2 | 216 | 783696 | 3247.12 | 962 | 932 | 241.1 |
| D | 14 | 34 | 283880 | 1173.75 | 962 | 932 | 241.1 |
| D | 12 | 233 | 116360 | 478.83 | 962 | 932 | 241.1 |
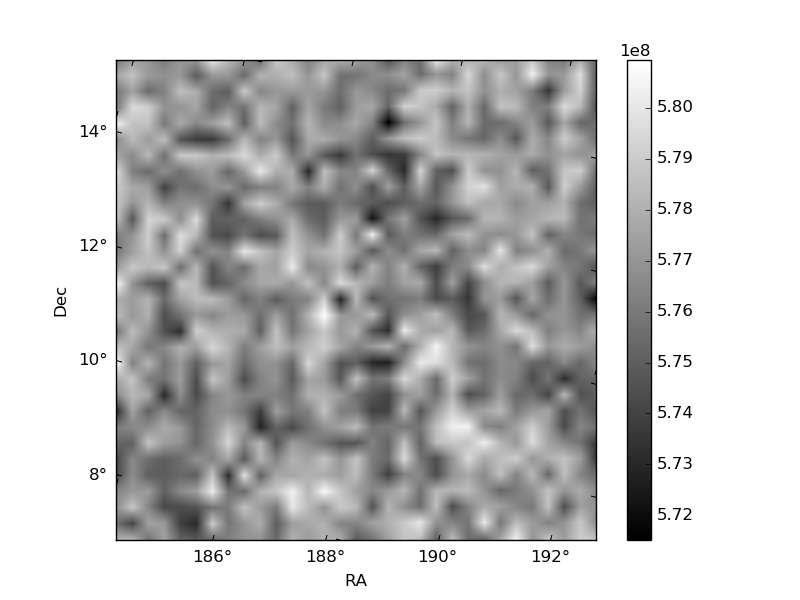
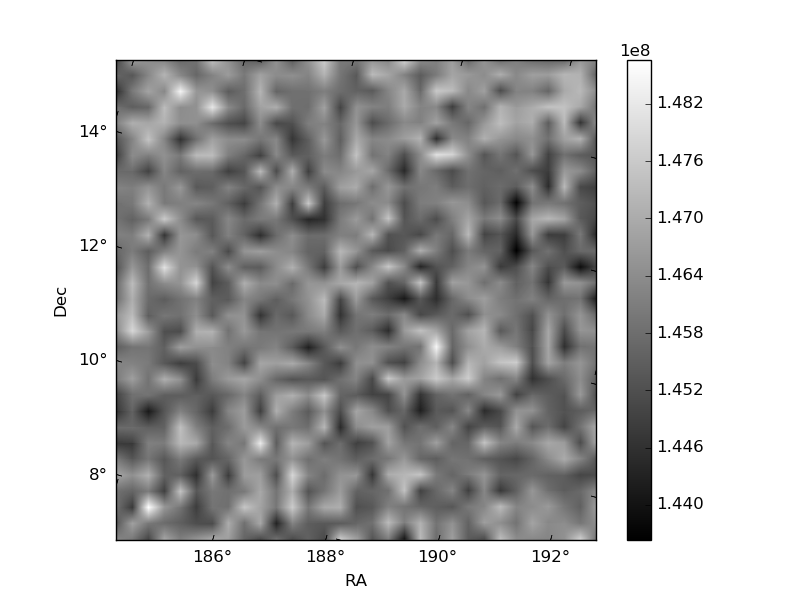
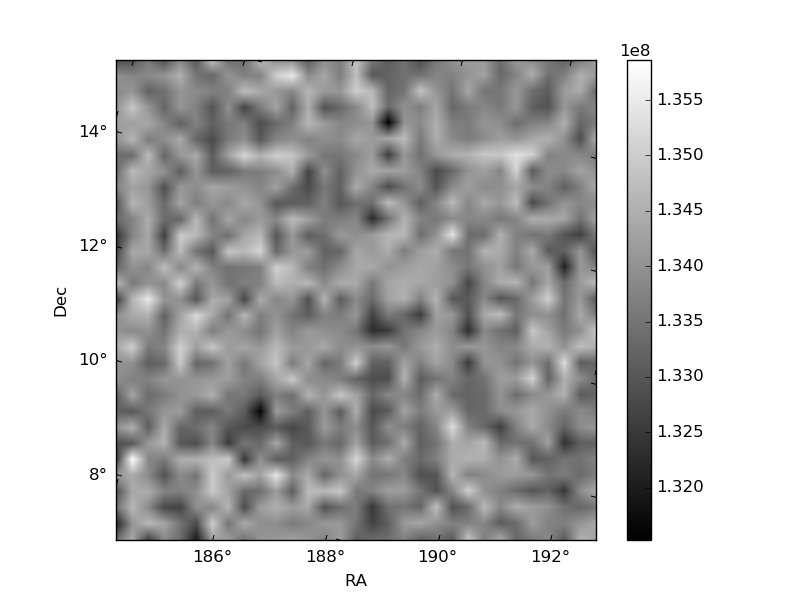
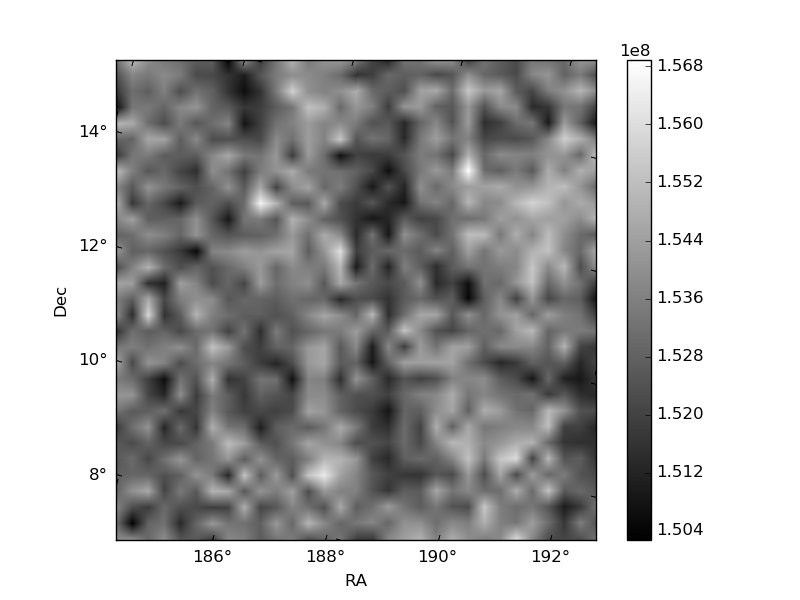
Histogram calculated using DETX and DETY for each event in the final _common_clean file
| Quadrant A | 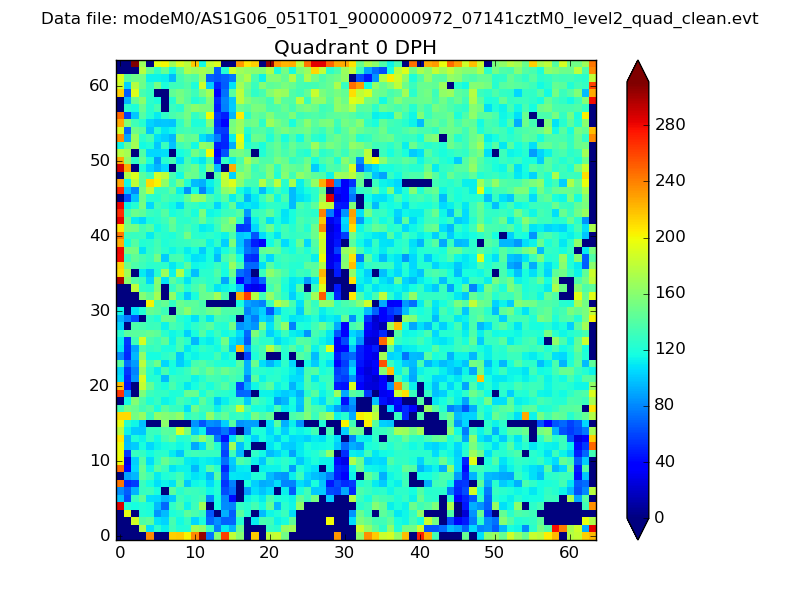 |
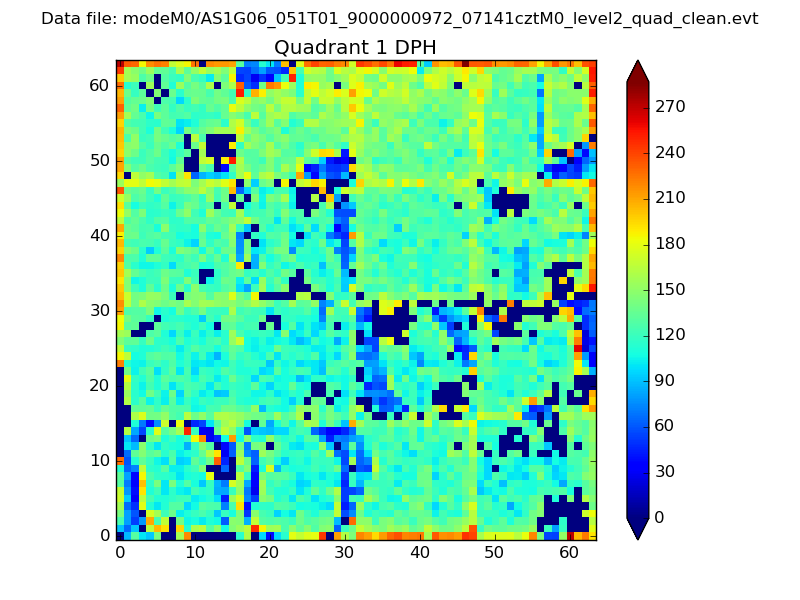 |
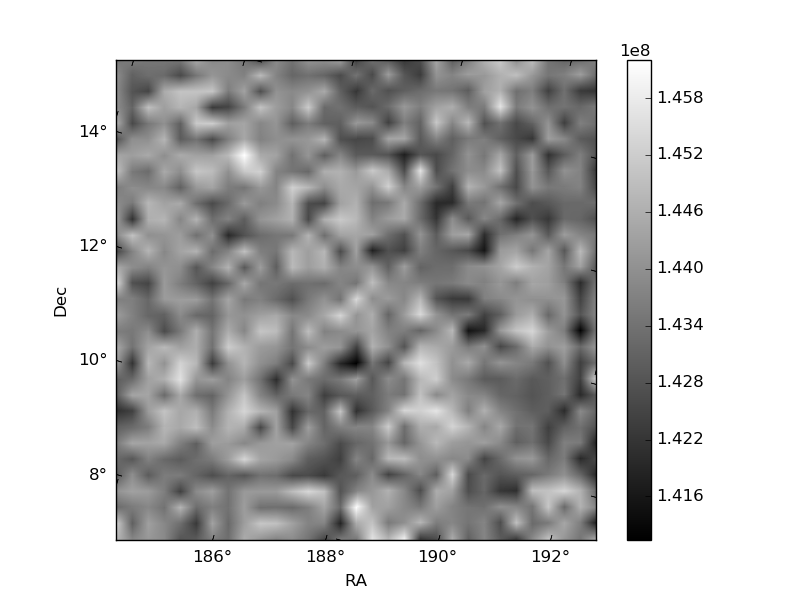
Quadrant B |
|---|---|---|---|
| Quadrant D | 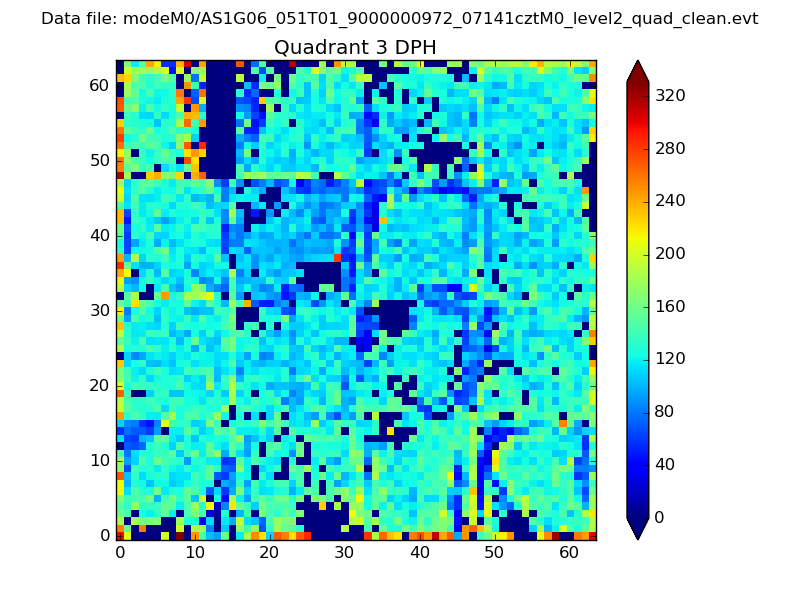 |
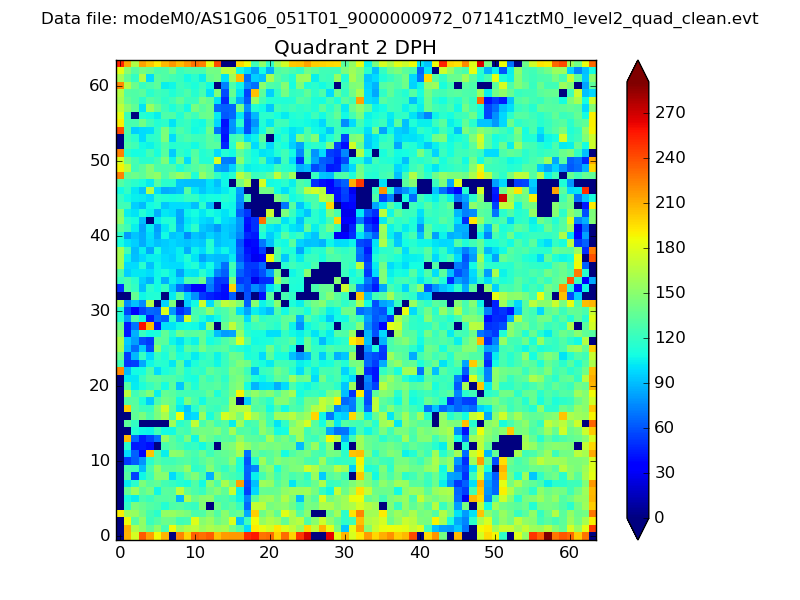 |
Quadrant C |
| Plot type | Count rate plots | Images |
|---|---|---|
| Comparison with Poisson distribution Blue bars denote a histogram of data divided into 1 sec bins. Red curve is a Poisson curve with rate = median count rate of data. |
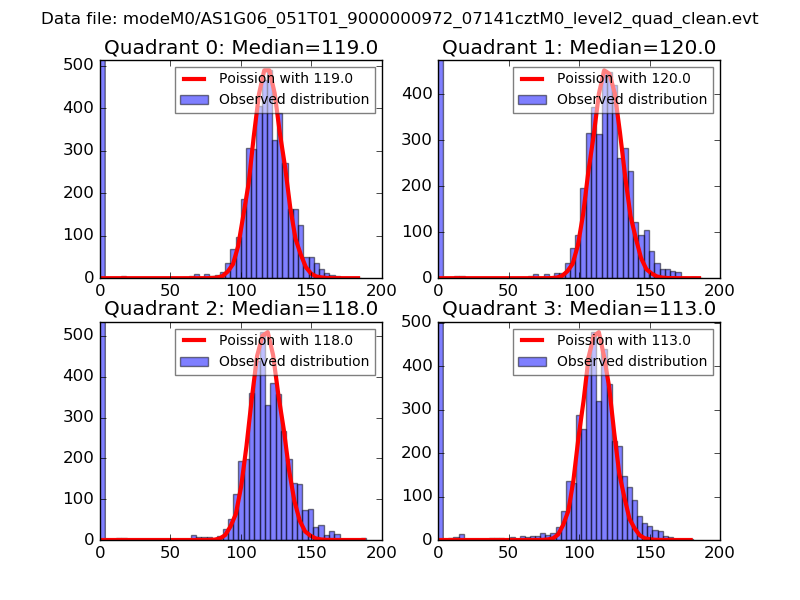 |
 |
| Quadrant-wise count rates Data is divided into 100 sec bins |
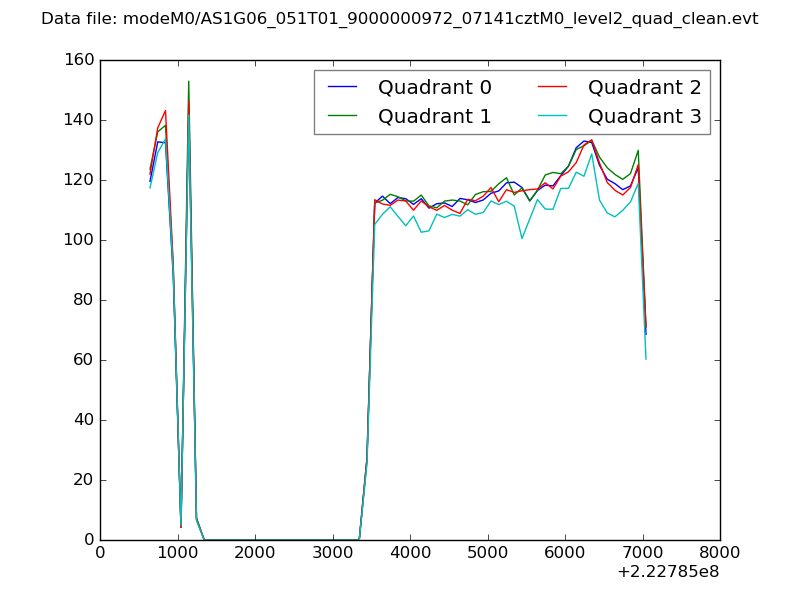 |
|
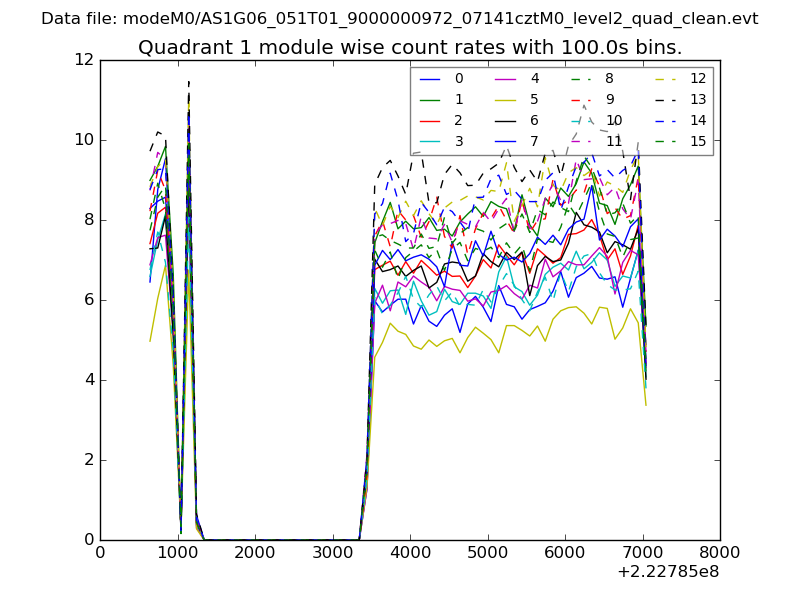
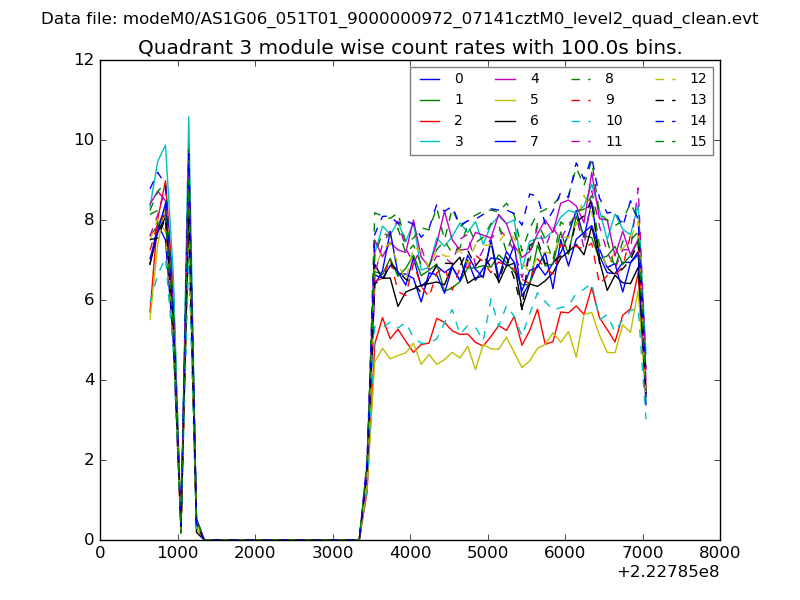
| Module-wise count rates for Quadrant A Data is divided into 100 sec bins |
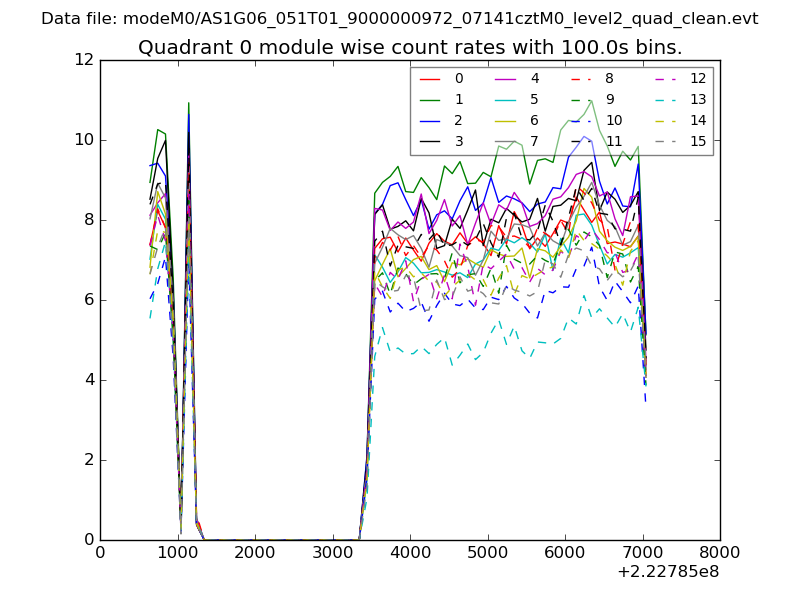 |
 |
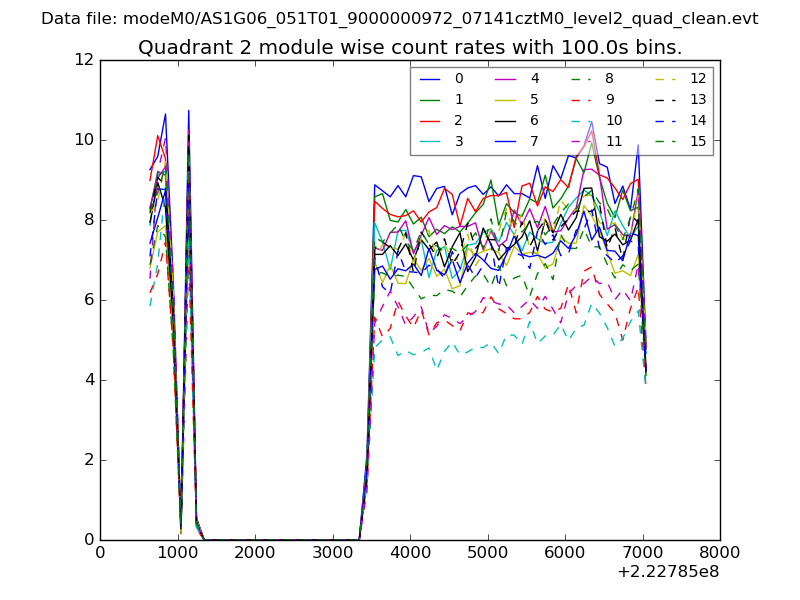
| Module-wise count rates for Quadrant B Data is divided into 100 sec bins |
 |
 |
| Module-wise count rates for Quadrant C Data is divided into 100 sec bins |
 |
 |
| Module-wise count rates for Quadrant D Data is divided into 100 sec bins |
 |
 |
| Parameter | Plot |
|---|---|
| CZT HV Monitor | 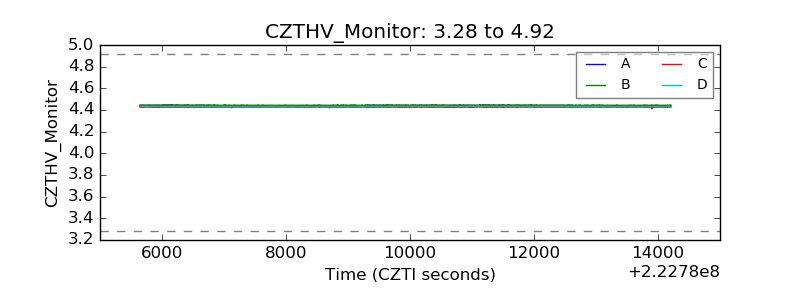 |
| D_VDD | 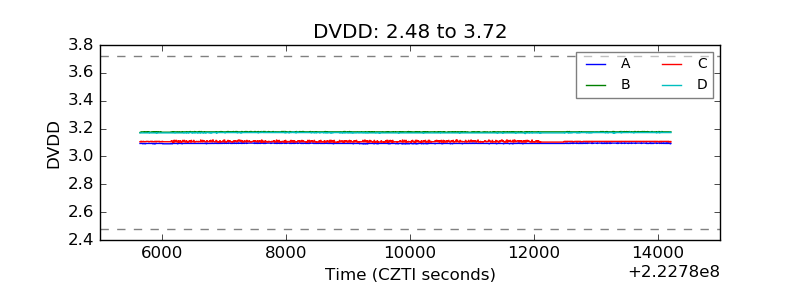 |
| Temperature 1 | 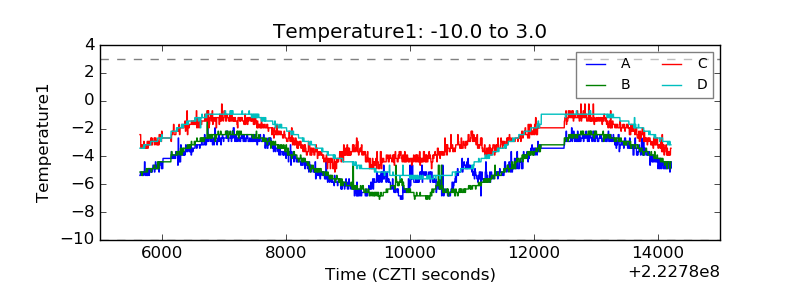 |
| Veto HV Monitor | 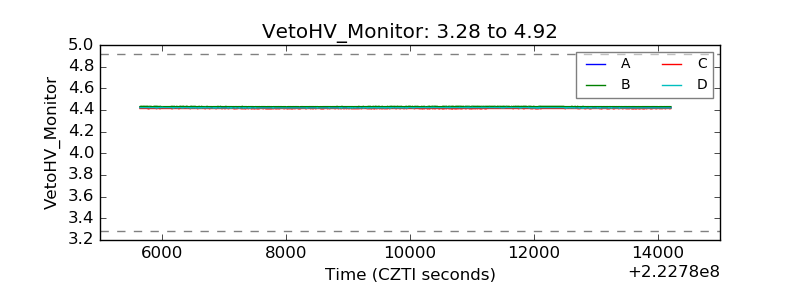 |
| Veto LLD | 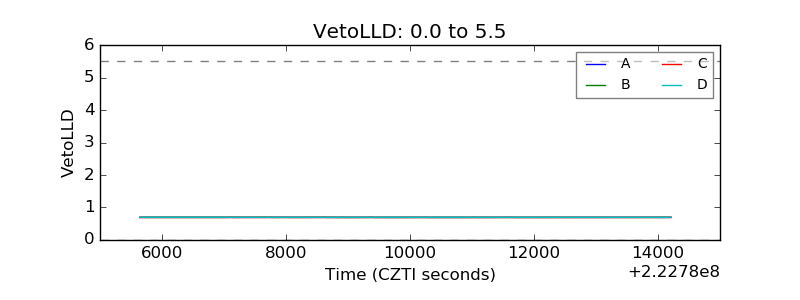 |
| Alpha Counter | 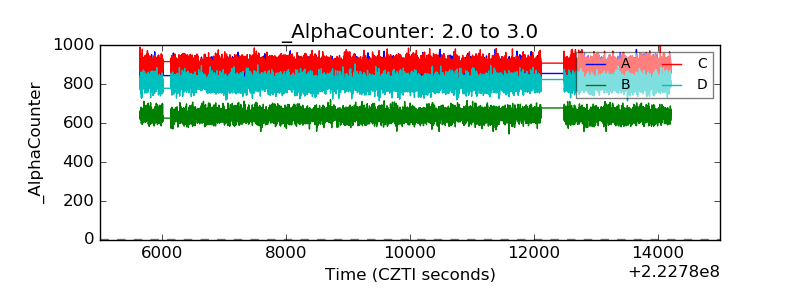 |
| _CPM_Rate | 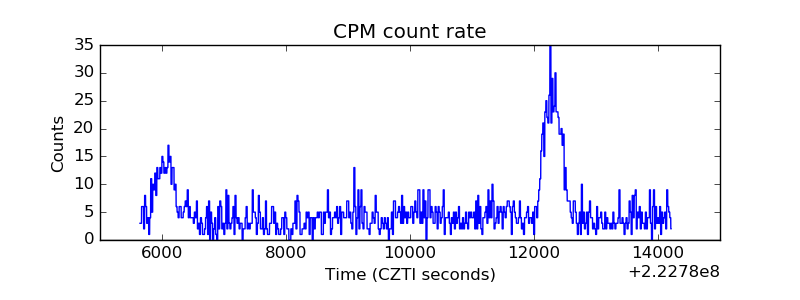 |
| CZT Counter | 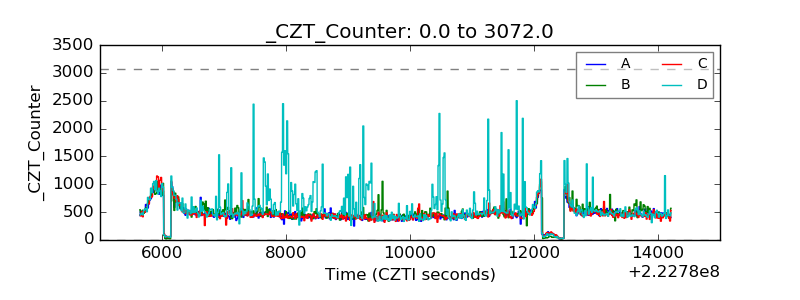 |
| +2.5 Volts monitor | 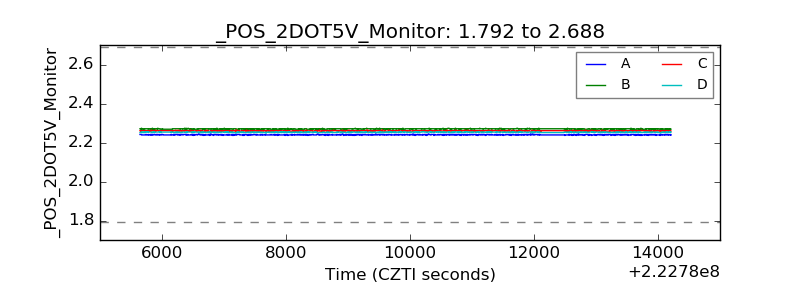 |
| +5 Volts monitor |  |
| _ROLL_ROT | 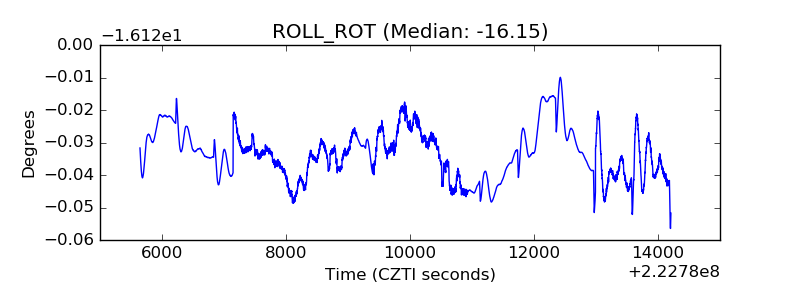 |
| _Roll_DEC | 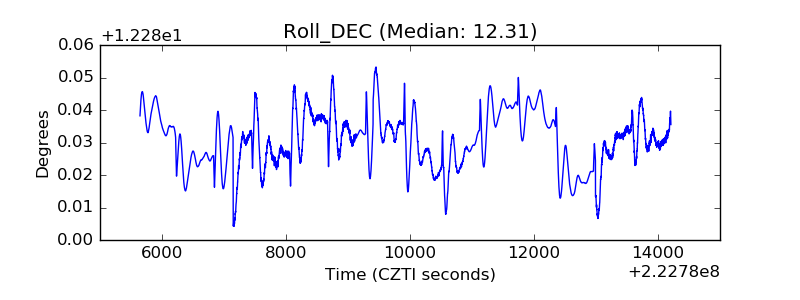 |
| _Roll_RA | 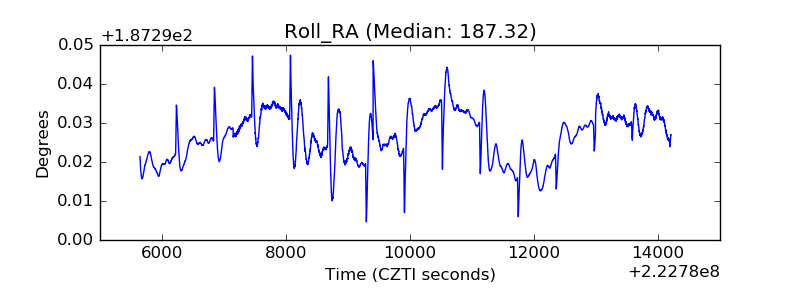 |
| Veto Counter | 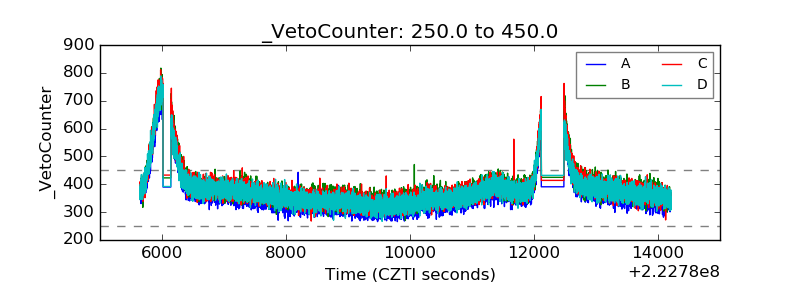 |