| Param | Original file | Final file |
|---|---|---|
| Filename | modeM0/AS1G06_051T01_9000000972_07315cztM0_level2.evt | modeM0/AS1G06_051T01_9000000972_07315cztM0_level2_quad_clean.evt |
| Size (bytes) | 25,505,280 | 2,612,160 |
| Size | 24.3 MB | 2.5 MB |
| Events in quadrant A | 189,224 | 9,976 |
| Events in quadrant B | 185,110 | 10,492 |
| Events in quadrant C | 181,005 | 10,604 |
| Events in quadrant D | 184,988 | 10,124 |
| Mode M9 | |||
|---|---|---|---|
| Quadrant | BADHDUFLAG | Total packets | Discarded packets |
| A | 1 | 251318637792 | 0 |
| B | 1 | -1 | -1 |
| C | 1 | -1 | -1 |
| D | 1 | -1 | -1 |
| Mode SS | |||
|---|---|---|---|
| Quadrant | BADHDUFLAG | Total packets | Discarded packets |
| A | 0 | 10 | 2 |
| B | 0 | 9 | 1 |
| C | 0 | 11 | 3 |
| D | 0 | 10 | 2 |
| Mode M0 | |||
|---|---|---|---|
| Quadrant | BADHDUFLAG | Total packets | Discarded packets |
| A | 0 | 1144 | 285 |
| B | 0 | 1126 | 291 |
| C | 0 | 1126 | 293 |
| D | 0 | 1145 | 277 |
| Quadrant | Total seconds | Saturated seconds | Saturation percentage |
|---|---|---|---|
| A | 418 | 2 | 0.478469% |
| B | 417 | 0 | 0.000000% |
| C | 415 | 2 | 0.481928% |
| D | 419 | 4 | 0.954654% |
Noise dominated data is calculated using 1-second bins in cleaned event files. If a bin has >2000 counts, and if more than 50% of those come from <1% of pixels, then it is considered to be noise-dominated and hence unusable.
| Quadrant | # 1 sec bins | Bins with >0 counts | Bins with >2000 counts | High rate bins dominated by noise | Noise dominated (total time) | Noise dominated (detector-on time) | Marked lightcurve |
|---|---|---|---|---|---|---|---|
| A | 431 | 423 | 0 | 0 | 0.00% | 0.00% | 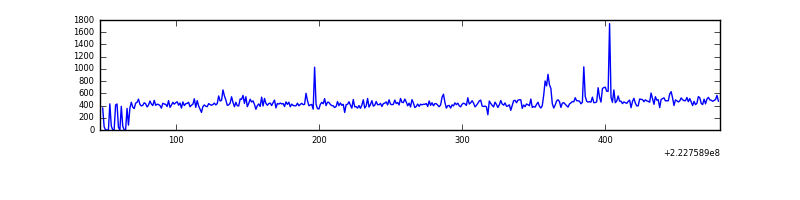 |
| B | 426 | 425 | 0 | 0 | 0.00% | 0.00% | 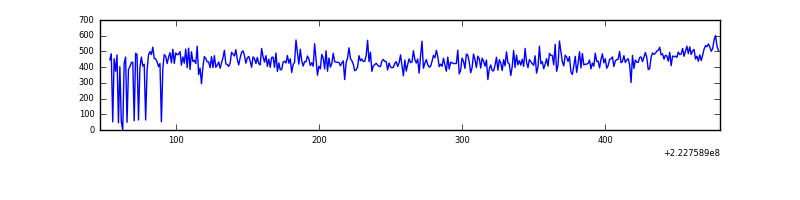 |
| C | 423 | 419 | 0 | 0 | 0.00% | 0.00% | 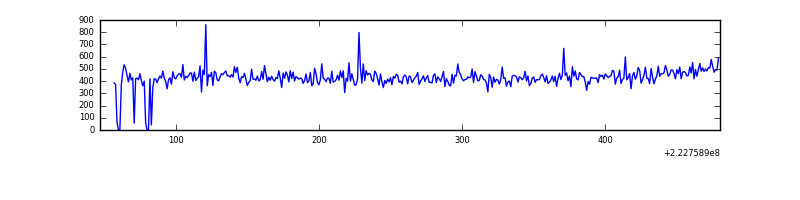 |
| D | 433 | 427 | 4 | 4 | 0.92% | 0.94% | 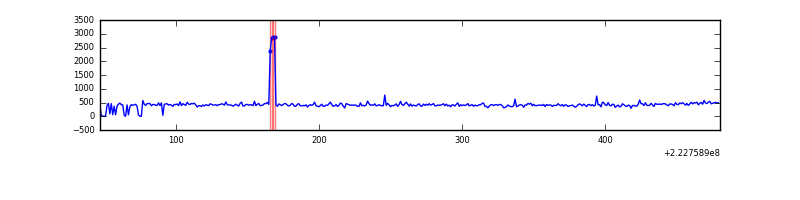 |
Top three noisy pixels from each quadrant. If the there are fewer than three noisy pixels in the level2.evt file, extra rows are filled as -1
| Pixel properties | Quadrant properties | ||||||
|---|---|---|---|---|---|---|---|
| Quadrant | DetID | PixID | Counts | Sigma | Mean | Median | Sigma |
| A | 14 | 111 | 4630 | 388.69 | 46 | 45 | 11.8 |
| A | 8 | 15 | 4151 | 348.08 | 46 | 45 | 11.8 |
| A | 15 | 234 | 749 | 59.68 | 46 | 45 | 11.8 |
| B | 12 | 111 | 991 | 81.49 | 47 | 46 | 11.6 |
| B | 11 | 111 | 759 | 61.48 | 47 | 46 | 11.6 |
| B | 4 | 81 | 580 | 46.05 | 47 | 46 | 11.6 |
| C | 13 | 61 | 355 | 24.4 | 46 | 46 | 12.7 |
| C | 9 | 68 | 239 | 15.24 | 46 | 46 | 12.7 |
| C | 10 | 22 | 209 | 12.87 | 46 | 46 | 12.7 |
| D | 12 | 233 | 11607 | 884.51 | 44 | 42 | 13.1 |
| D | 1 | 20 | 5681 | 431.28 | 44 | 42 | 13.1 |
| D | 2 | 14 | 1503 | 111.74 | 44 | 42 | 13.1 |
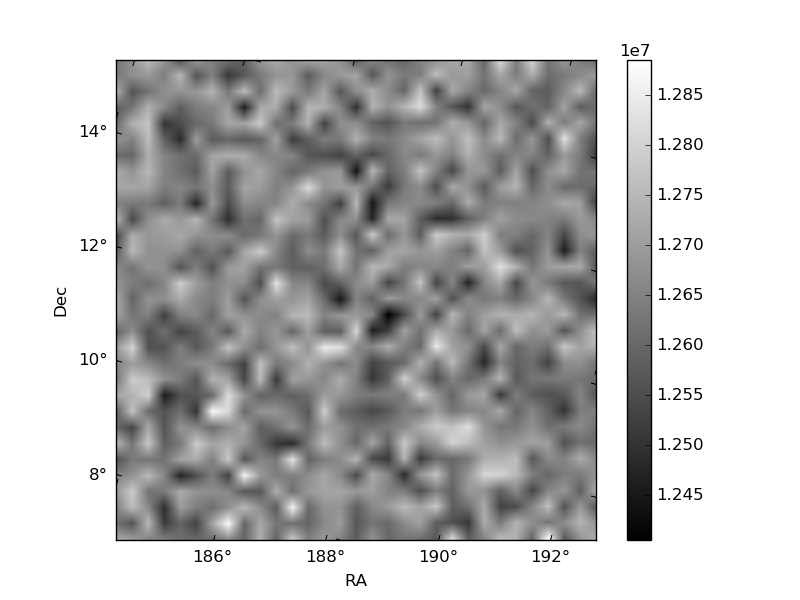
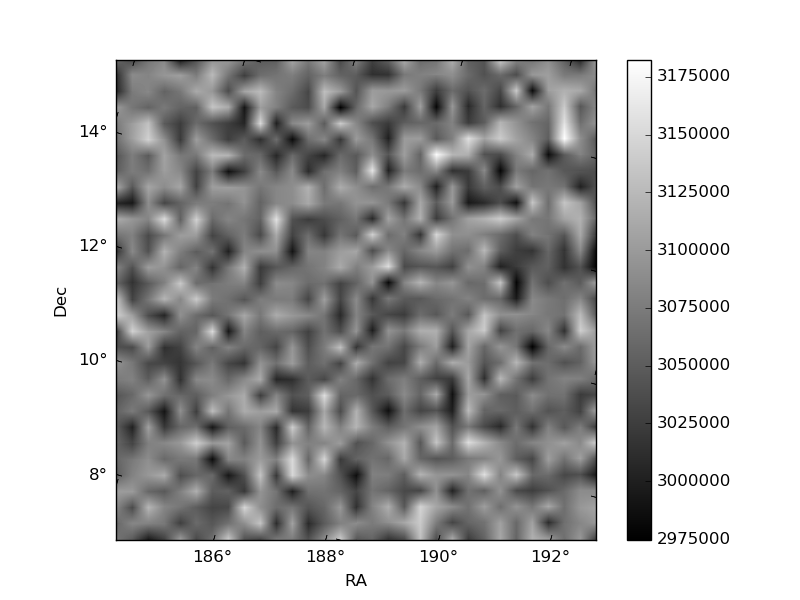
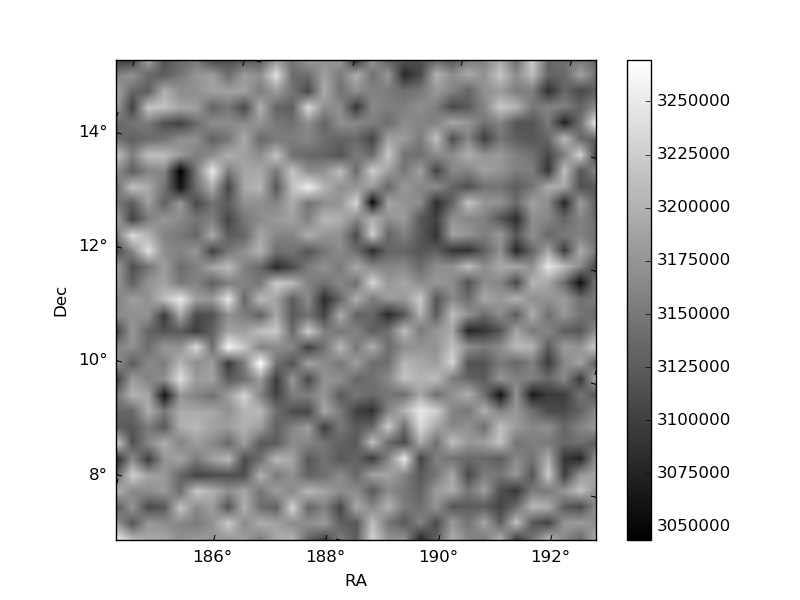
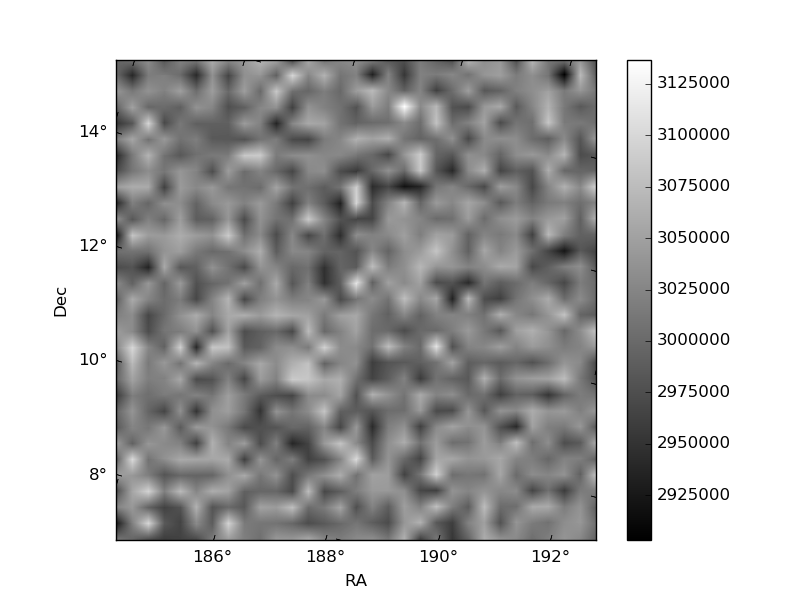
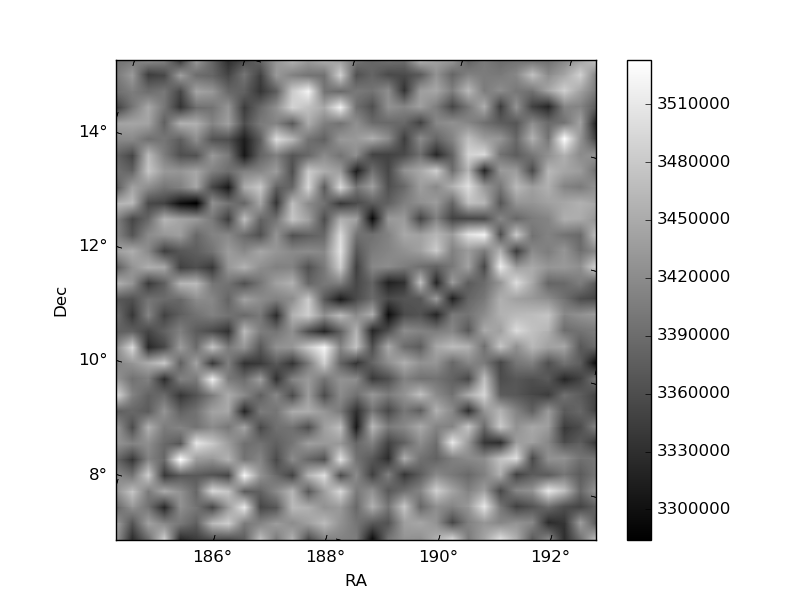
Histogram calculated using DETX and DETY for each event in the final _common_clean file
| Quadrant A | 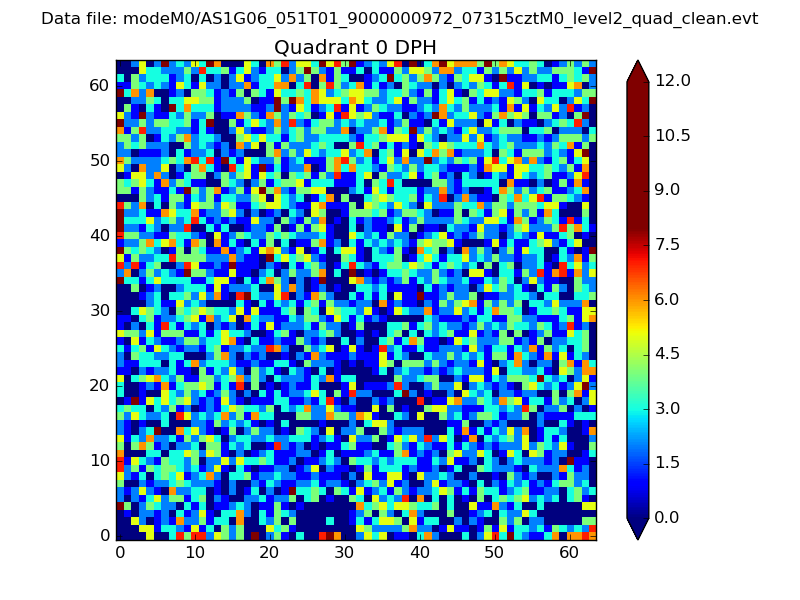 |
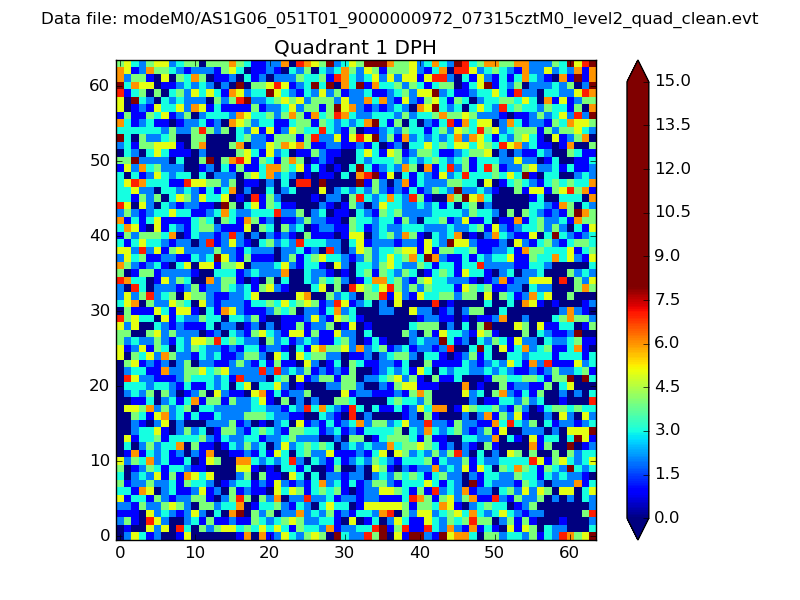 |
Quadrant B |
|---|---|---|---|
| Quadrant D | 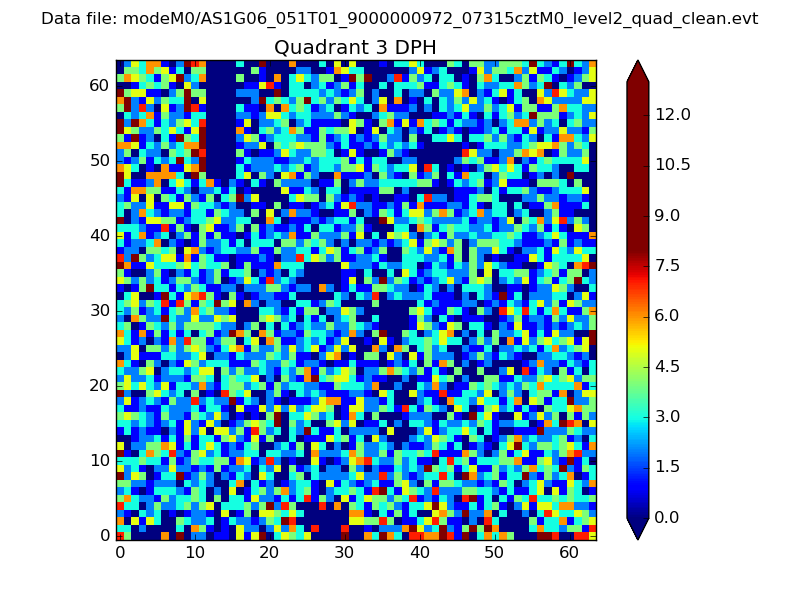 |
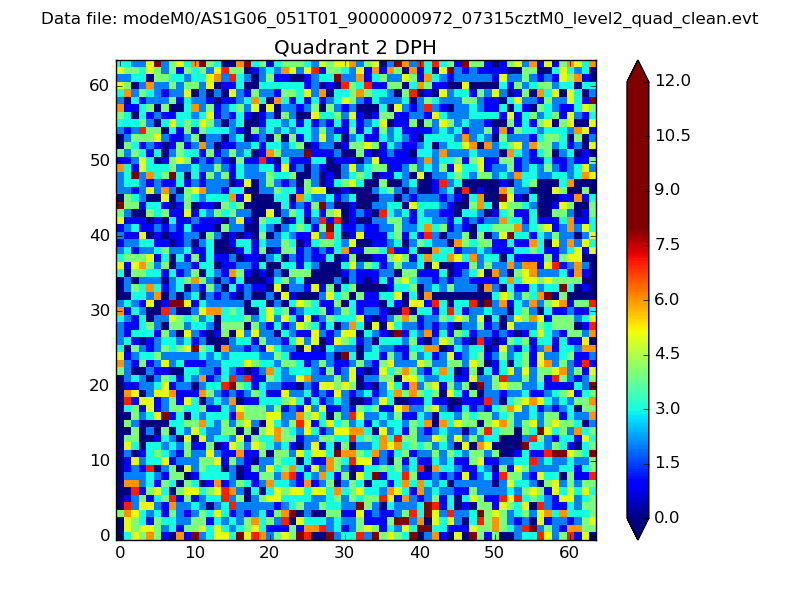 |
Quadrant C |
| Plot type | Count rate plots | Images |
|---|---|---|
| Comparison with Poisson distribution Blue bars denote a histogram of data divided into 1 sec bins. Red curve is a Poisson curve with rate = median count rate of data. |
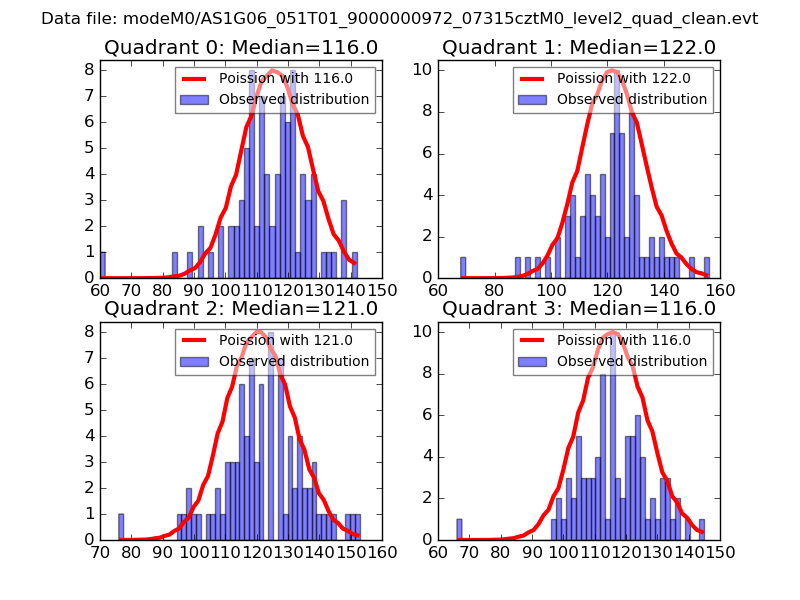 |
 |
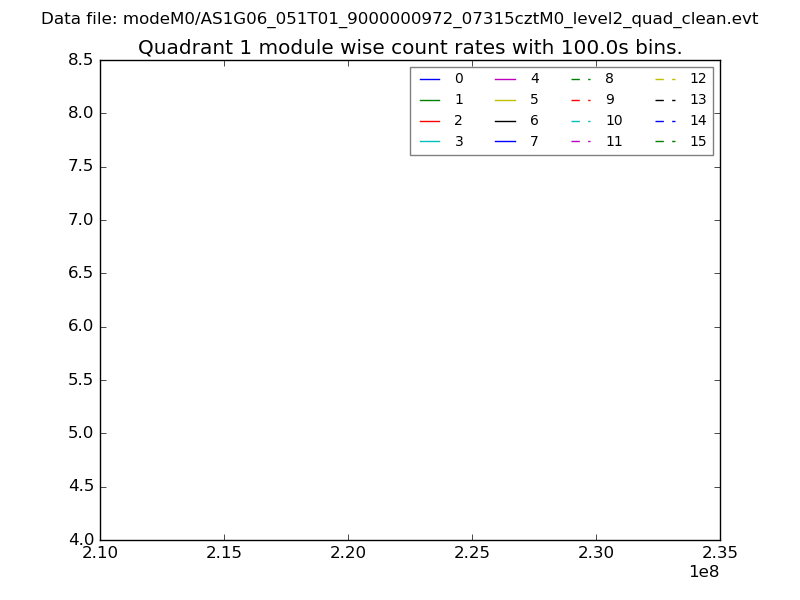
| Quadrant-wise count rates Data is divided into 100 sec bins |
 |
|
| Module-wise count rates for Quadrant A Data is divided into 100 sec bins |
 |
 |
| Module-wise count rates for Quadrant B Data is divided into 100 sec bins |
 |
 |
| Module-wise count rates for Quadrant C Data is divided into 100 sec bins |
 |
 |
| Module-wise count rates for Quadrant D Data is divided into 100 sec bins |
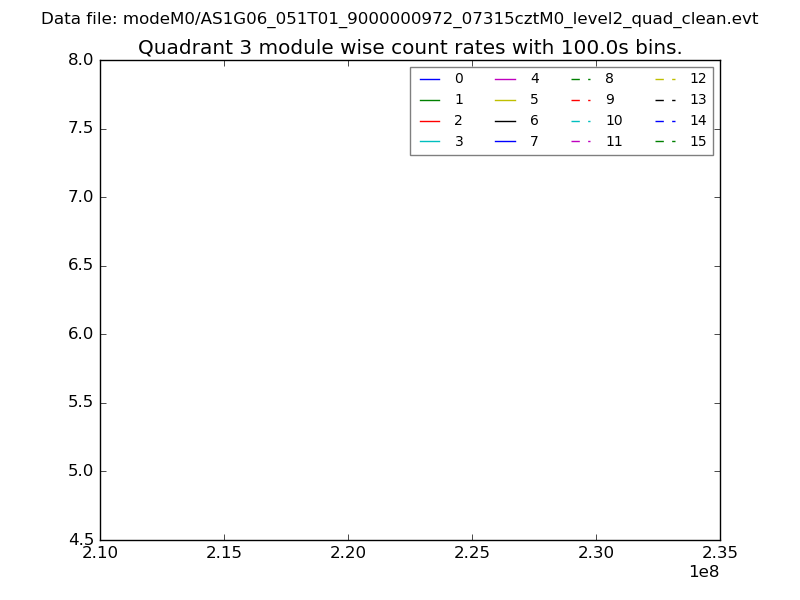 |
 |
| Parameter | Plot |
|---|---|
| CZT HV Monitor | 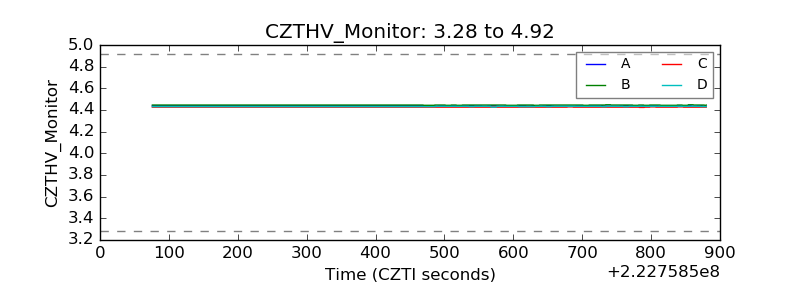 |
| D_VDD | 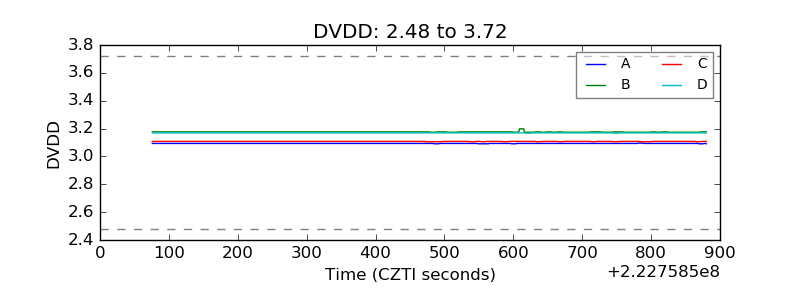 |
| Temperature 1 | 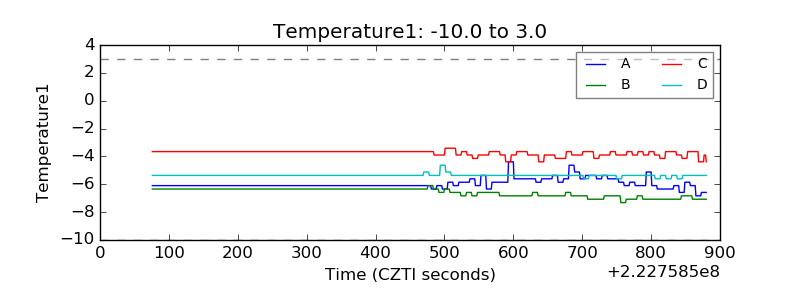 |
| Veto HV Monitor | 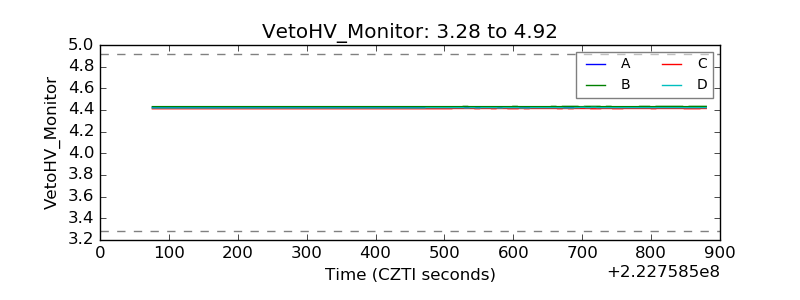 |
| Veto LLD | 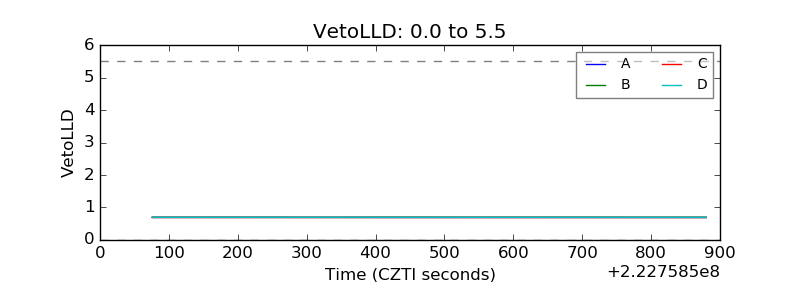 |
| Alpha Counter | 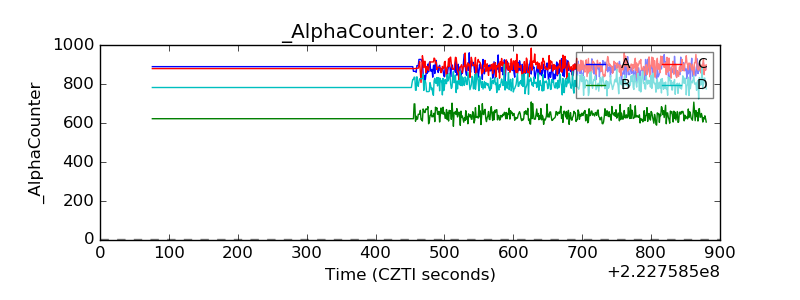 |
| _CPM_Rate | 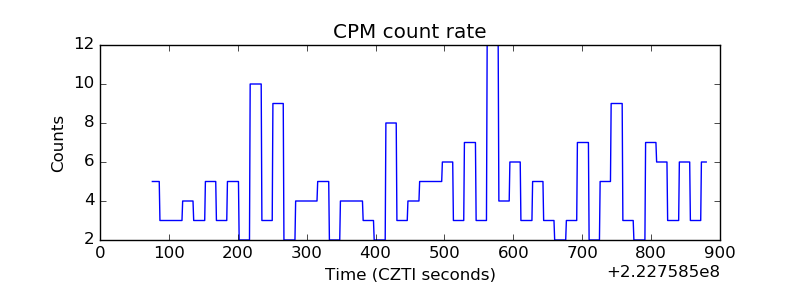 |
| CZT Counter | 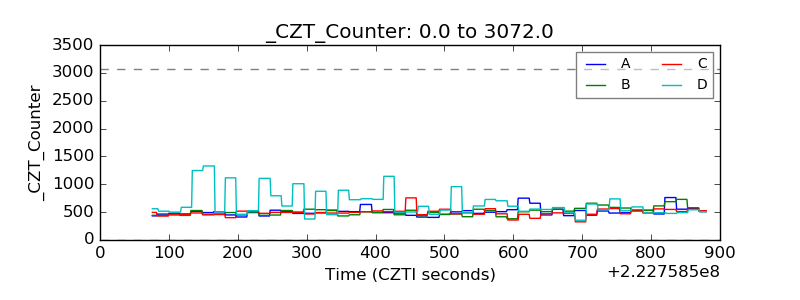 |
| +2.5 Volts monitor |  |
| +5 Volts monitor | 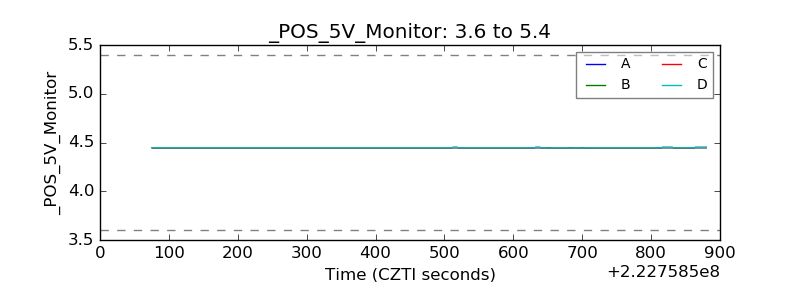 |
| _ROLL_ROT | 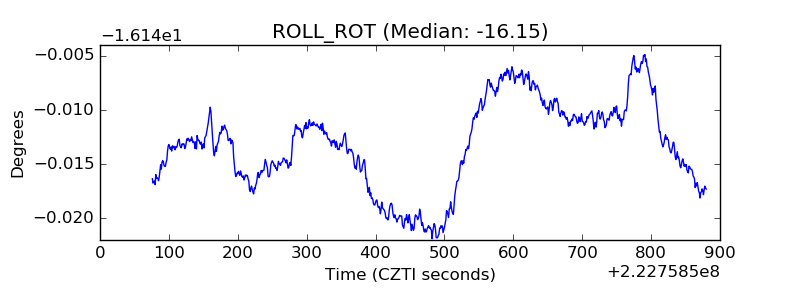 |
| _Roll_DEC | 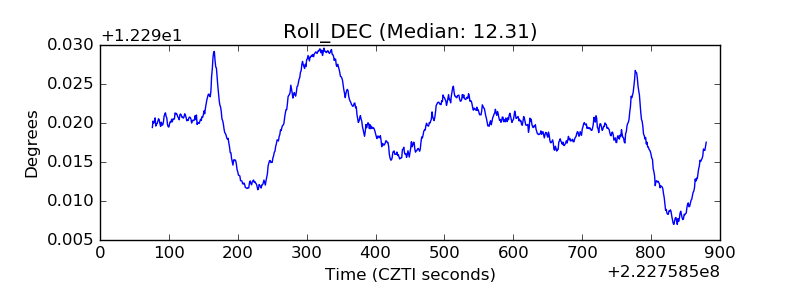 |
| _Roll_RA | 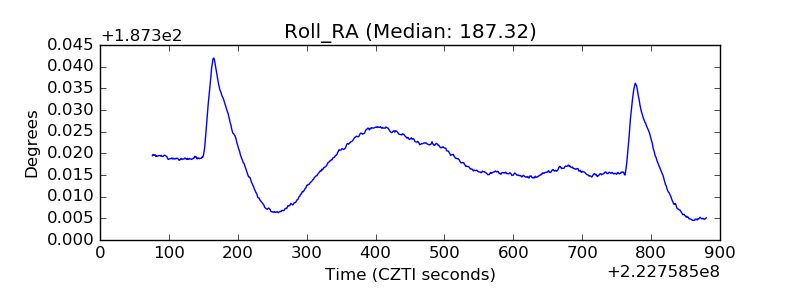 |
| Veto Counter | 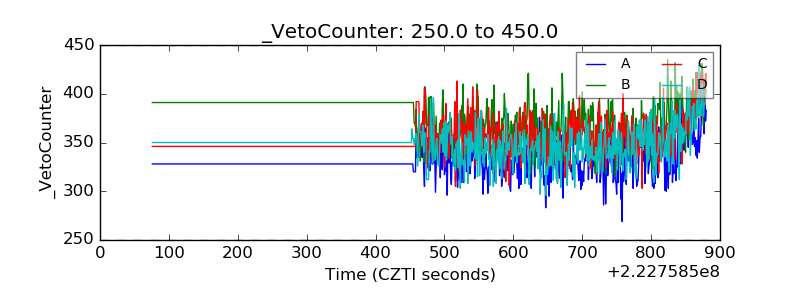 |