| Param | Original file | Final file |
|---|---|---|
| Filename | modeM0/AS1G06_029T02_9000000974cztM0_level2.fits | modeM0/AS1G06_029T02_9000000974cztM0_level2_quad_clean.evt |
| Size (bytes) | 801,748,800 | 773,994,240 |
| Size | 764.6 MB | 738.1 MB |
| Events in quadrant A | 4,796,692 | 4,539,952 |
| Events in quadrant B | 4,676,672 | 4,581,105 |
| Events in quadrant C | 4,746,512 | 4,365,196 |
| Events in quadrant D | 4,045,660 | 3,940,622 |
| Mode M9 | |||
|---|---|---|---|
| Quadrant | BADHDUFLAG | Total packets | Discarded packets |
| A | 0 | 134 | 0 |
| B | 0 | 134 | 0 |
| C | 0 | 134 | 0 |
| D | 0 | 134 | 0 |
| Mode SS | |||
|---|---|---|---|
| Quadrant | BADHDUFLAG | Total packets | Discarded packets |
| A | 0 | 1786 | 0 |
| B | 0 | 1786 | 0 |
| C | 0 | 1786 | 0 |
| D | 0 | 1786 | 0 |
| Mode M0 | |||
|---|---|---|---|
| Quadrant | BADHDUFLAG | Total packets | Discarded packets |
| A | 0 | 182482 | 0 |
| B | 0 | 185339 | 0 |
| C | 0 | 185005 | 0 |
| D | 0 | 226370 | 0 |
| Quadrant | Total seconds | Saturated seconds | Saturation percentage |
|---|---|---|---|
| A | 87732 | 1356 | 1.545616% |
| B | 87732 | 1169 | 1.332467% |
| C | 87732 | 1179 | 1.343865% |
| D | 87732 | 3557 | 4.054393% |
Noise dominated data is calculated using 1-second bins in cleaned event files. If a bin has >2000 counts, and if more than 50% of those come from <1% of pixels, then it is considered to be noise-dominated and hence unusable.
| Quadrant | # 1 sec bins | Bins with >0 counts | Bins with >2000 counts | High rate bins dominated by noise | Noise dominated (total time) | Noise dominated (detector-on time) | Marked lightcurve |
|---|---|---|---|---|---|---|---|
| A | 100972 | 87720 | 0 | 0 | 0.00% | 0.00% | 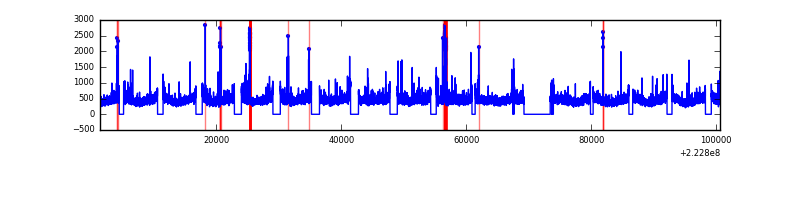 |
| B | 100972 | 87715 | 0 | 0 | 0.00% | 0.00% | 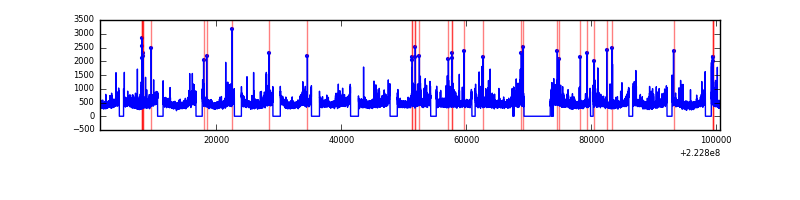 |
| C | 100972 | 87701 | 0 | 0 | 0.00% | 0.00% |  |
| D | 100972 | 87681 | 0 | 0 | 0.00% | 0.00% | 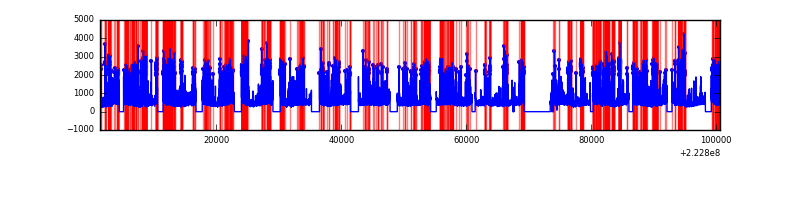 |
Top three noisy pixels from each quadrant. If the there are fewer than three noisy pixels in the level2.evt file, extra rows are filled as -1
| Pixel properties | Quadrant properties | ||||||
|---|---|---|---|---|---|---|---|
| Quadrant | DetID | PixID | Counts | Sigma | Mean | Median | Sigma |
| A | 0 | 29 | 4673 | 10.97 | 1246 | 1155 | 320.6 |
| A | 7 | 110 | 3899 | 8.56 | 1246 | 1155 | 320.6 |
| A | 0 | 30 | 3656 | 7.8 | 1246 | 1155 | 320.6 |
| B | 2 | 9 | 4022 | 11.59 | 1230 | 1166 | 246.4 |
| B | 5 | 128 | 3168 | 8.12 | 1230 | 1166 | 246.4 |
| B | 3 | 17 | 3159 | 8.09 | 1230 | 1166 | 246.4 |
| C | 1 | 80 | 3425 | 6.8 | 1253 | 1157 | 333.6 |
| C | 1 | 81 | 3327 | 6.5 | 1253 | 1157 | 333.6 |
| C | 12 | 241 | 3286 | 6.38 | 1253 | 1157 | 333.6 |
| D | 3 | 14 | 3077 | 6.55 | 1152 | 1044 | 310.4 |
| D | 6 | 231 | 2914 | 6.02 | 1152 | 1044 | 310.4 |
| D | 1 | 19 | 2890 | 5.95 | 1152 | 1044 | 310.4 |
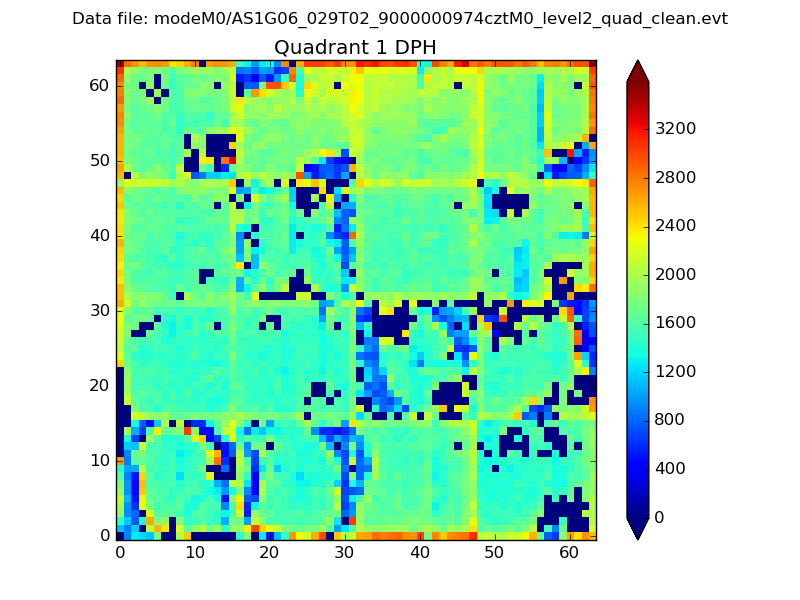
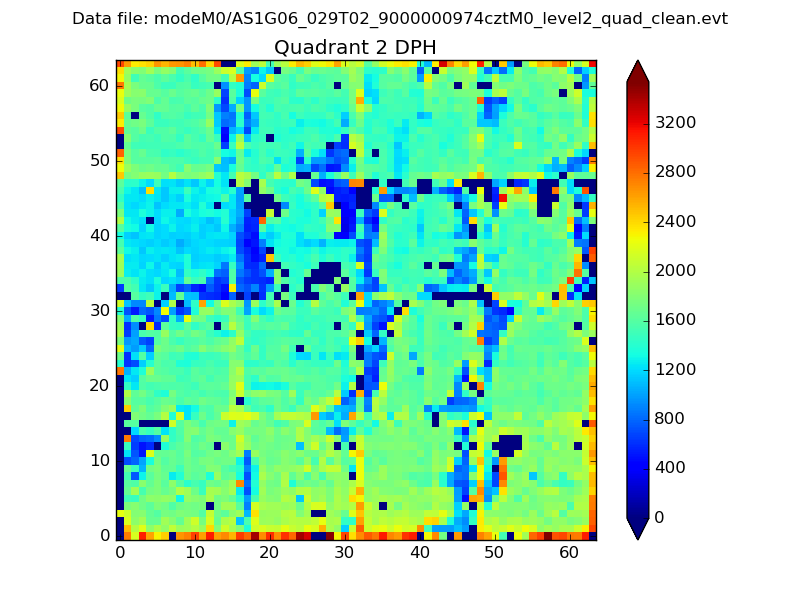
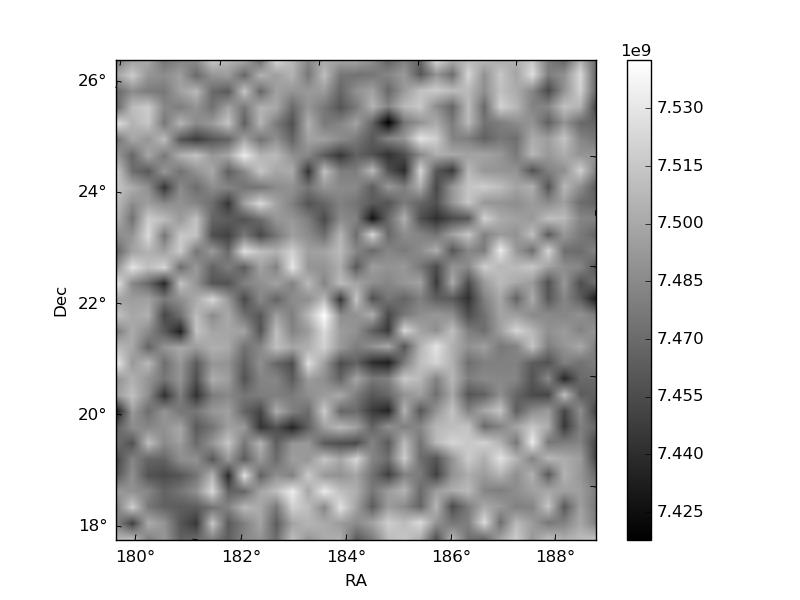
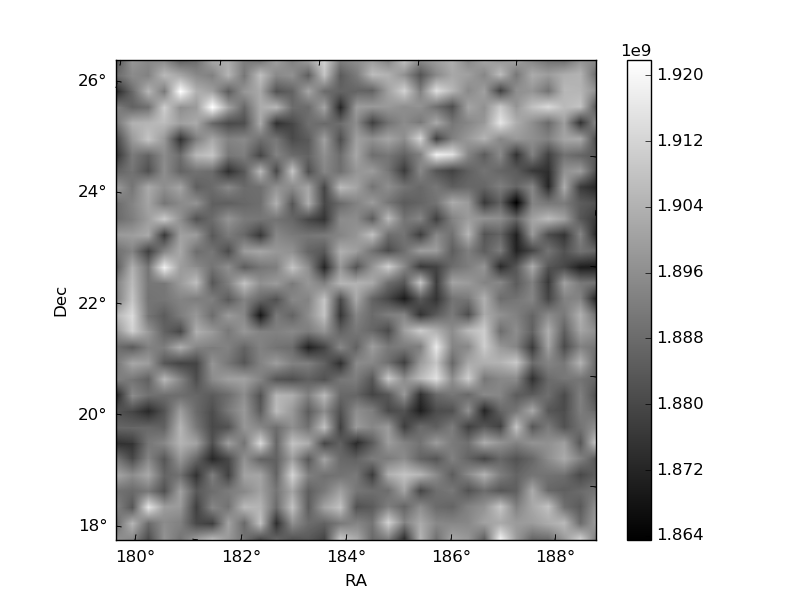
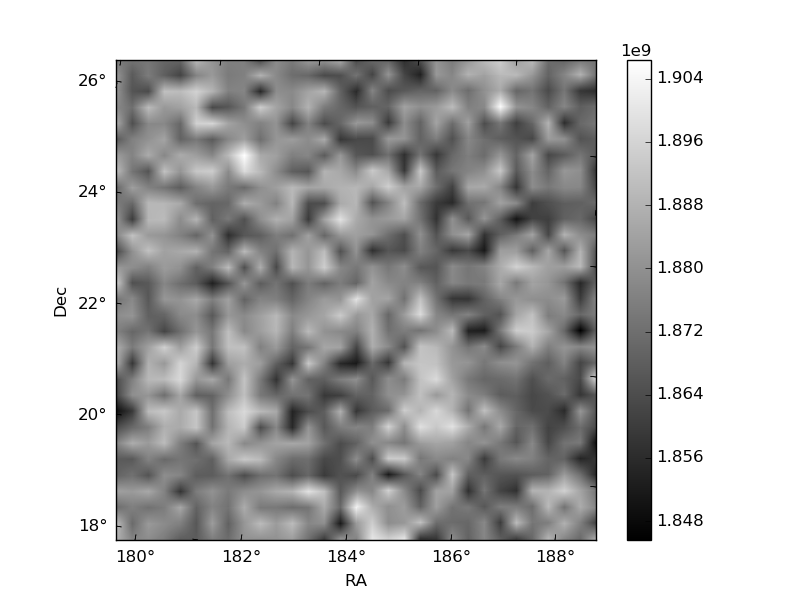
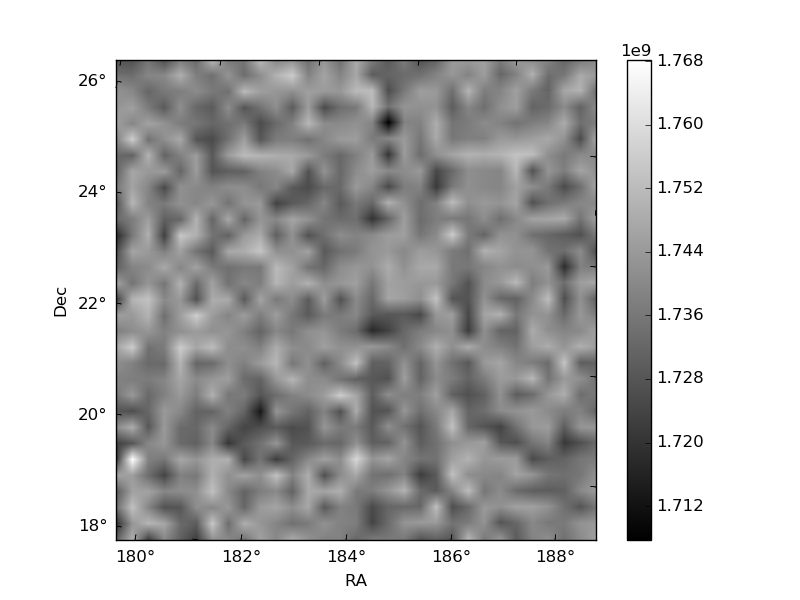
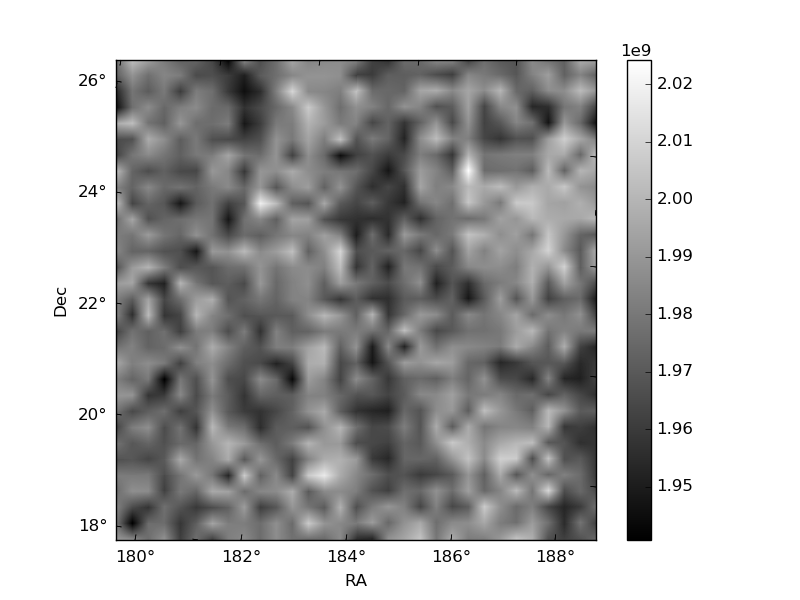
Histogram calculated using DETX and DETY for each event in the final _common_clean file
| Quadrant A | 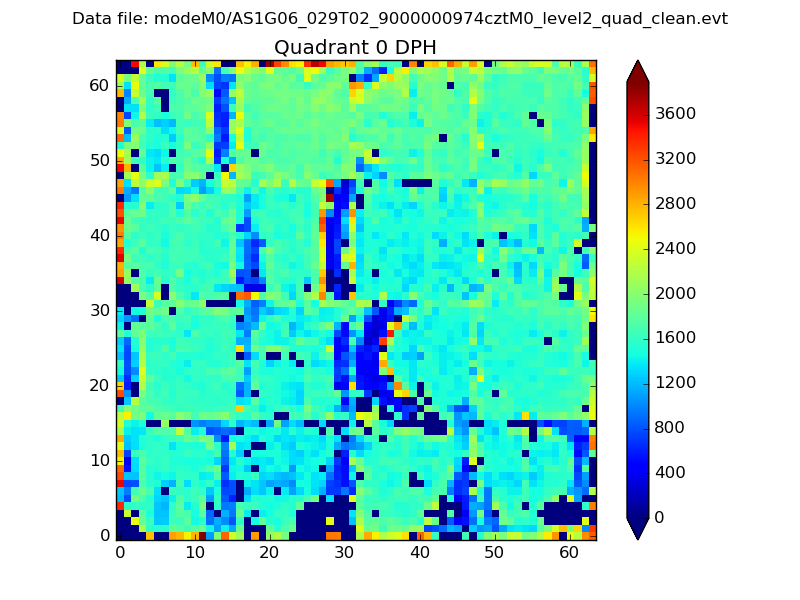 |
 |
Quadrant B |
|---|---|---|---|
| Quadrant D | 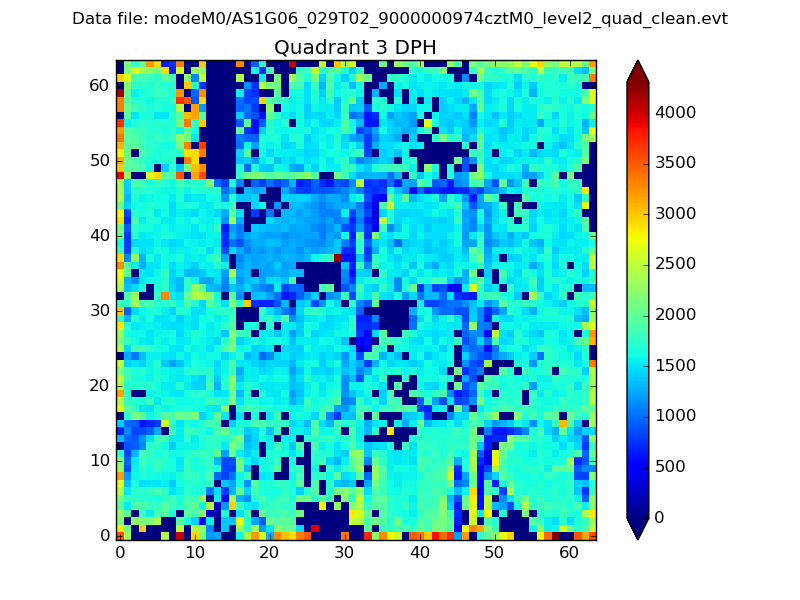 |
 |
Quadrant C |
| Plot type | Count rate plots | Images |
|---|---|---|
| Comparison with Poisson distribution Blue bars denote a histogram of data divided into 1 sec bins. Red curve is a Poisson curve with rate = median count rate of data. |
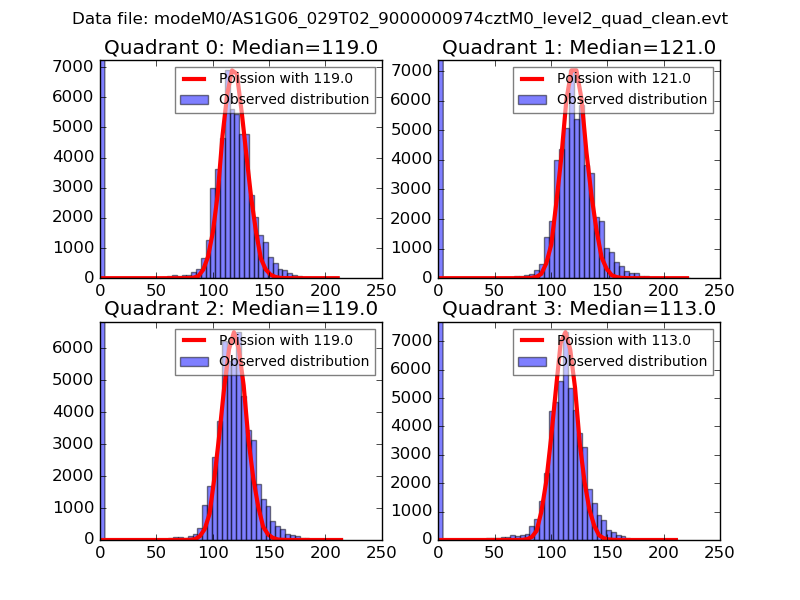 |
 |
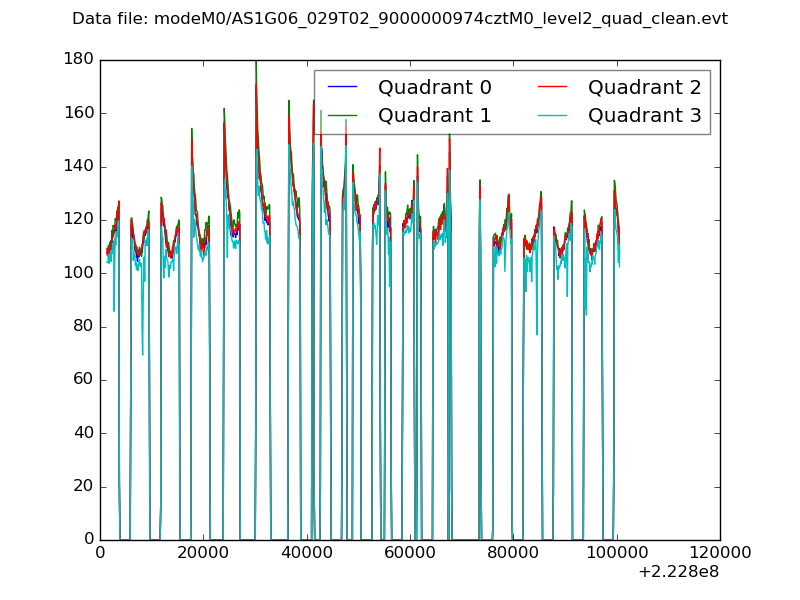
| Quadrant-wise count rates Data is divided into 100 sec bins |
 |
|
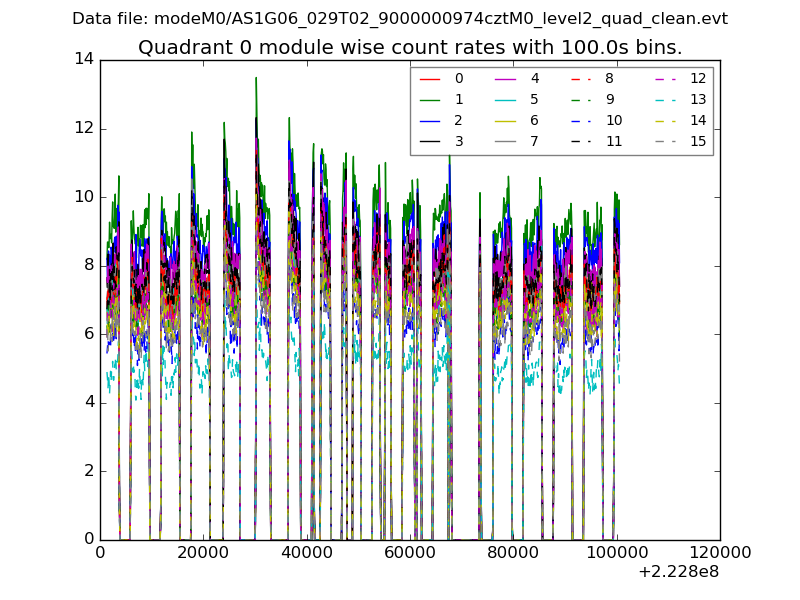
| Module-wise count rates for Quadrant A Data is divided into 100 sec bins |
 |
 |
| Module-wise count rates for Quadrant B Data is divided into 100 sec bins |
 |
 |
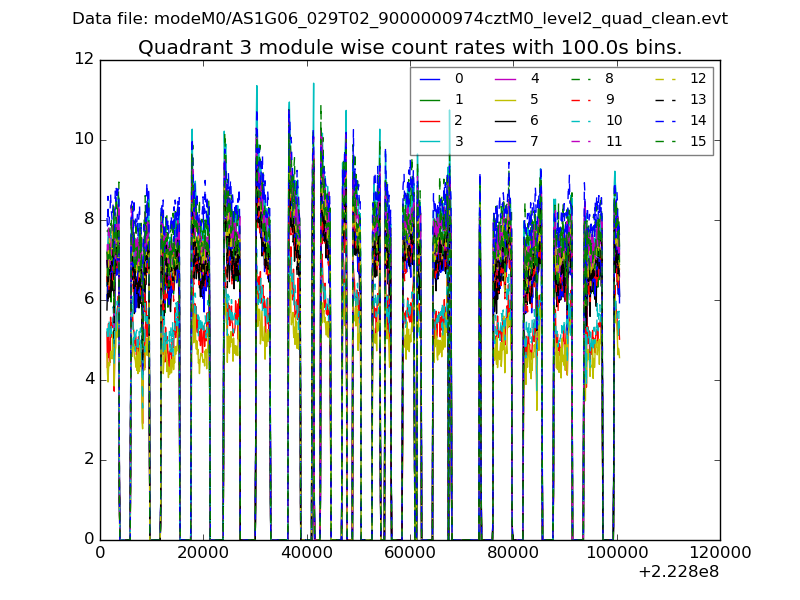
| Module-wise count rates for Quadrant C Data is divided into 100 sec bins |
 |
 |
| Module-wise count rates for Quadrant D Data is divided into 100 sec bins |
 |
 |
| Parameter | Plot |
|---|---|
| CZT HV Monitor |  |
| D_VDD | 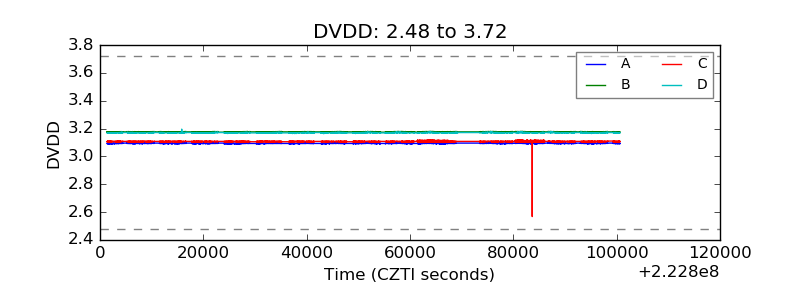 |
| Temperature 1 |  |
| Veto HV Monitor |  |
| Veto LLD | 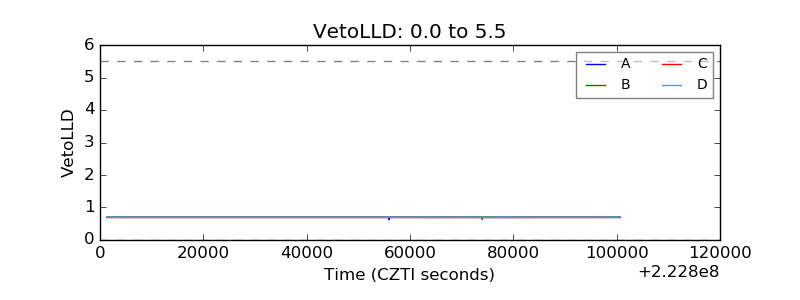 |
| Alpha Counter | 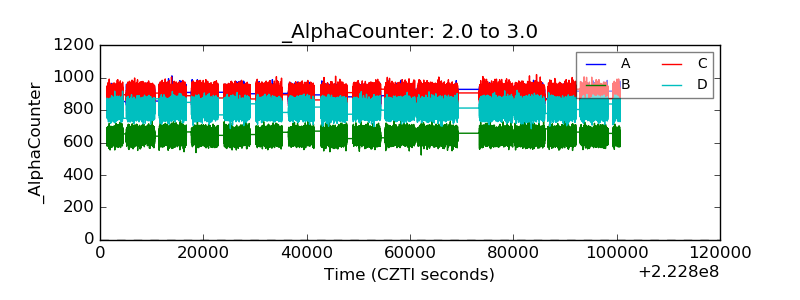 |
| _CPM_Rate |  |
| CZT Counter | 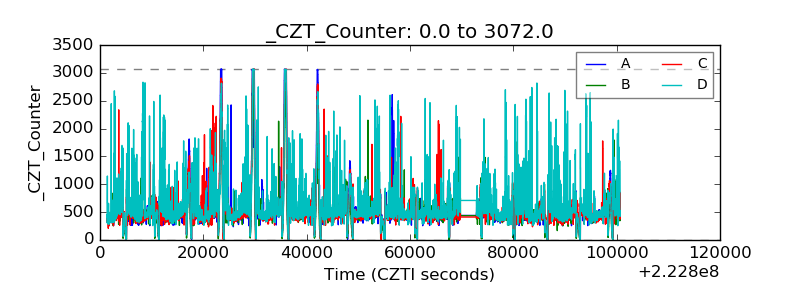 |
| +2.5 Volts monitor | 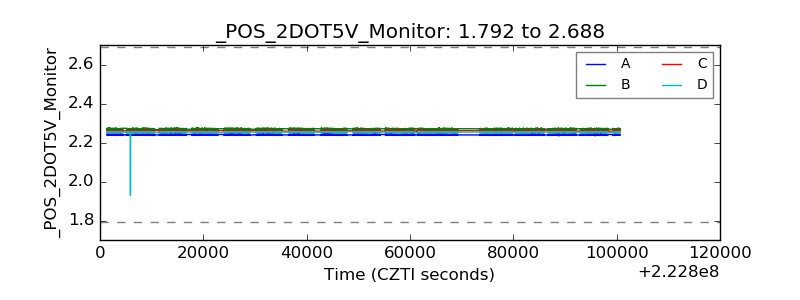 |
| +5 Volts monitor | 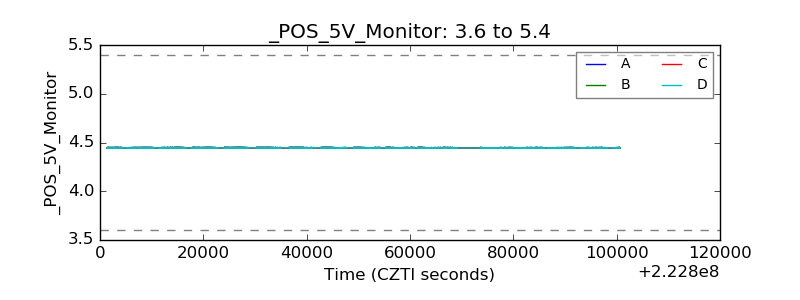 |
| _ROLL_ROT | 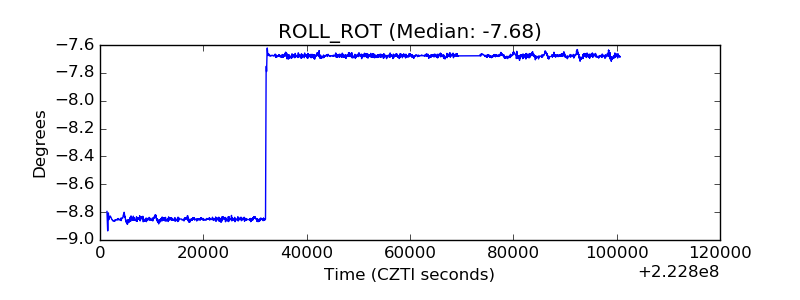 |
| _Roll_DEC | 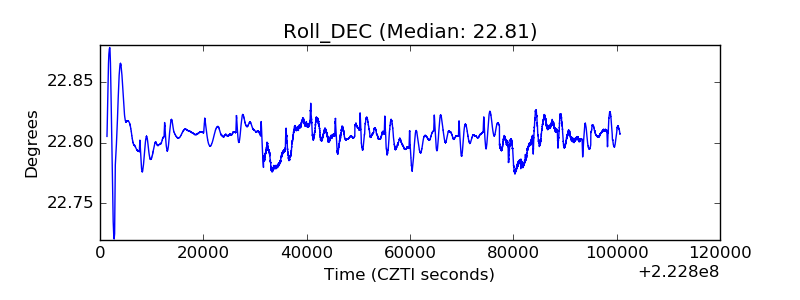 |
| _Roll_RA | 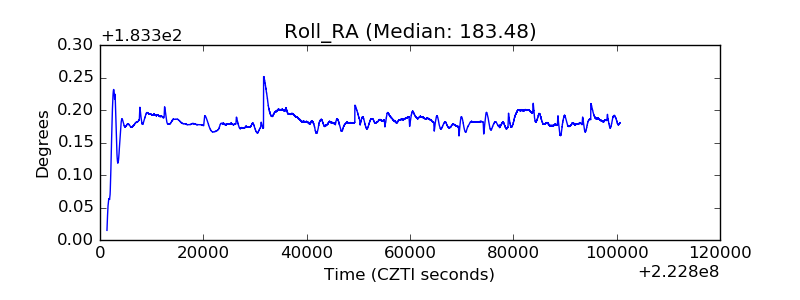 |
| Veto Counter | 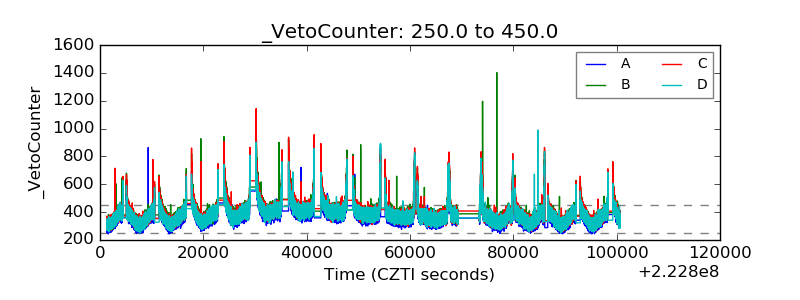 |