| Param | Original file | Final file |
|---|---|---|
| Filename | modeM0/AS1G06_029T02_9000000974_07144cztM0_level2.evt | modeM0/AS1G06_029T02_9000000974_07144cztM0_level2_quad_clean.evt |
| Size (bytes) | 138,084,480 | 38,206,080 |
| Size | 131.7 MB | 36.4 MB |
| Events in quadrant A | 926,165 | 251,530 |
| Events in quadrant B | 931,047 | 255,108 |
| Events in quadrant C | 887,358 | 250,884 |
| Events in quadrant D | 1,284,165 | 239,161 |
| Mode SS | |||
|---|---|---|---|
| Quadrant | BADHDUFLAG | Total packets | Discarded packets |
| A | 0 | 44 | 0 |
| B | 0 | 44 | 0 |
| C | 0 | 44 | 0 |
| D | 0 | 44 | 0 |
| Mode M0 | |||
|---|---|---|---|
| Quadrant | BADHDUFLAG | Total packets | Discarded packets |
| A | 0 | 4465 | 1 |
| B | 0 | 4453 | 0 |
| C | 0 | 4433 | 0 |
| D | 0 | 5527 | 0 |
| Quadrant | Total seconds | Saturated seconds | Saturation percentage |
|---|---|---|---|
| A | 2213 | 0 | 0.000000% |
| B | 2213 | 1 | 0.045188% |
| C | 2213 | 1 | 0.045188% |
| D | 2213 | 72 | 3.253502% |
Noise dominated data is calculated using 1-second bins in cleaned event files. If a bin has >2000 counts, and if more than 50% of those come from <1% of pixels, then it is considered to be noise-dominated and hence unusable.
| Quadrant | # 1 sec bins | Bins with >0 counts | Bins with >2000 counts | High rate bins dominated by noise | Noise dominated (total time) | Noise dominated (detector-on time) | Marked lightcurve |
|---|---|---|---|---|---|---|---|
| A | 2213 | 2213 | 0 | 0 | 0.00% | 0.00% | 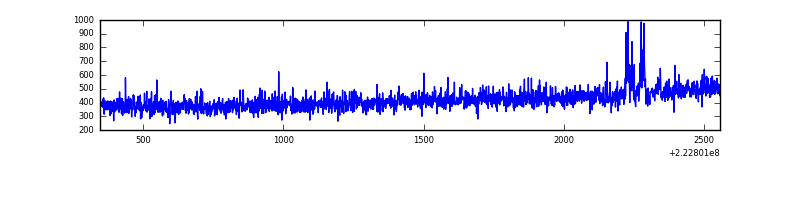 |
| B | 2213 | 2213 | 0 | 0 | 0.00% | 0.00% | 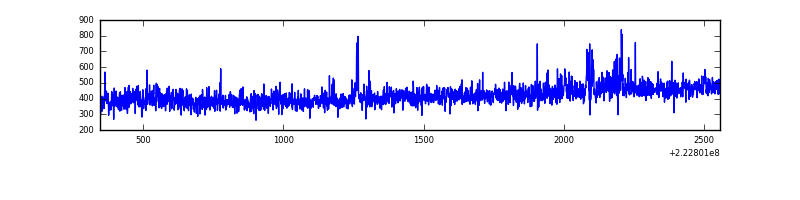 |
| C | 2213 | 2213 | 0 | 0 | 0.00% | 0.00% | 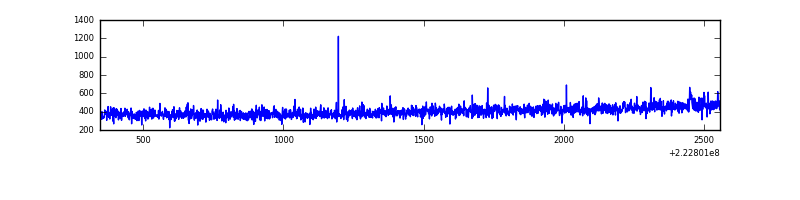 |
| D | 2213 | 2213 | 70 | 70 | 3.16% | 3.16% | 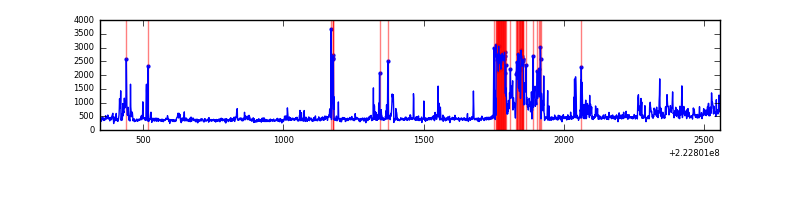 |
Top three noisy pixels from each quadrant. If the there are fewer than three noisy pixels in the level2.evt file, extra rows are filled as -1
| Pixel properties | Quadrant properties | ||||||
|---|---|---|---|---|---|---|---|
| Quadrant | DetID | PixID | Counts | Sigma | Mean | Median | Sigma |
| A | 8 | 15 | 28608 | 579.08 | 233 | 229 | 49.0 |
| A | 0 | 226 | 2194 | 40.1 | 233 | 229 | 49.0 |
| A | 12 | 194 | 2068 | 37.53 | 233 | 229 | 49.0 |
| B | 4 | 81 | 16249 | 341.12 | 235 | 230 | 47.0 |
| B | 12 | 111 | 4864 | 98.68 | 235 | 230 | 47.0 |
| B | 11 | 111 | 3740 | 74.74 | 235 | 230 | 47.0 |
| C | 4 | 254 | 3355 | 57.84 | 225 | 227 | 54.1 |
| C | 13 | 61 | 1760 | 28.35 | 225 | 227 | 54.1 |
| C | 10 | 22 | 1539 | 24.26 | 225 | 227 | 54.1 |
| D | 2 | 216 | 323293 | 5781.52 | 221 | 215 | 55.9 |
| D | 2 | 14 | 76126 | 1358.44 | 221 | 215 | 55.9 |
| D | 8 | 195 | 28425 | 504.82 | 221 | 215 | 55.9 |
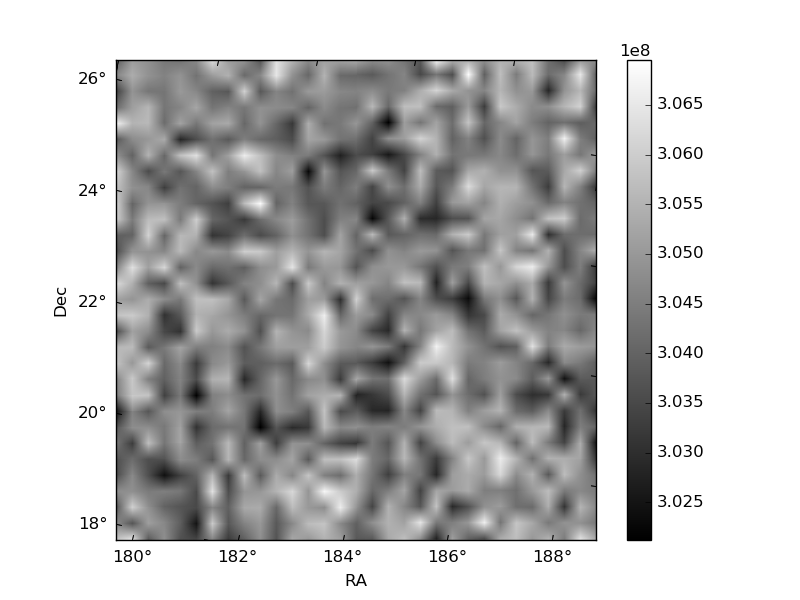
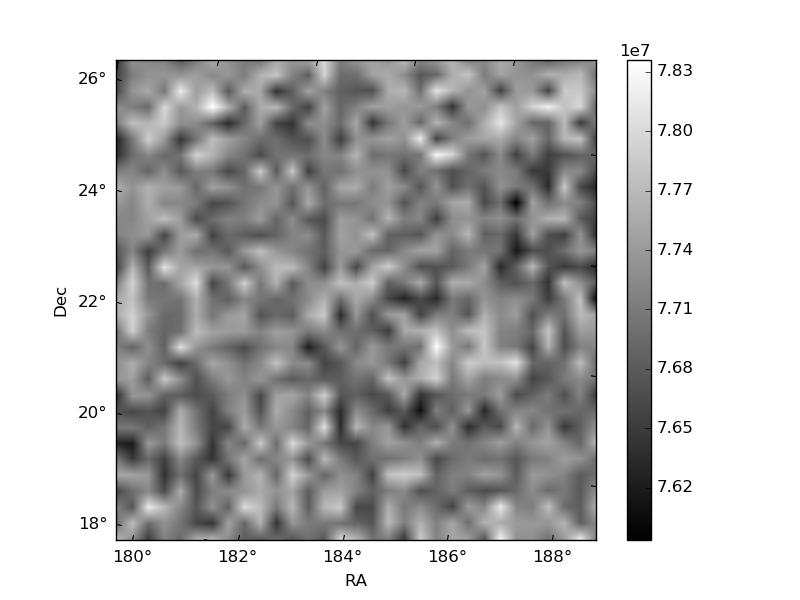
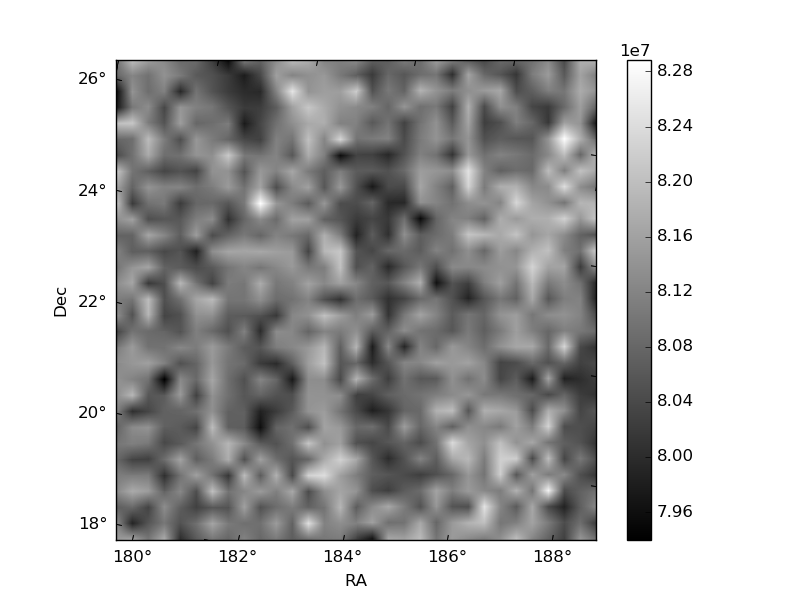
Histogram calculated using DETX and DETY for each event in the final _common_clean file
| Quadrant A | 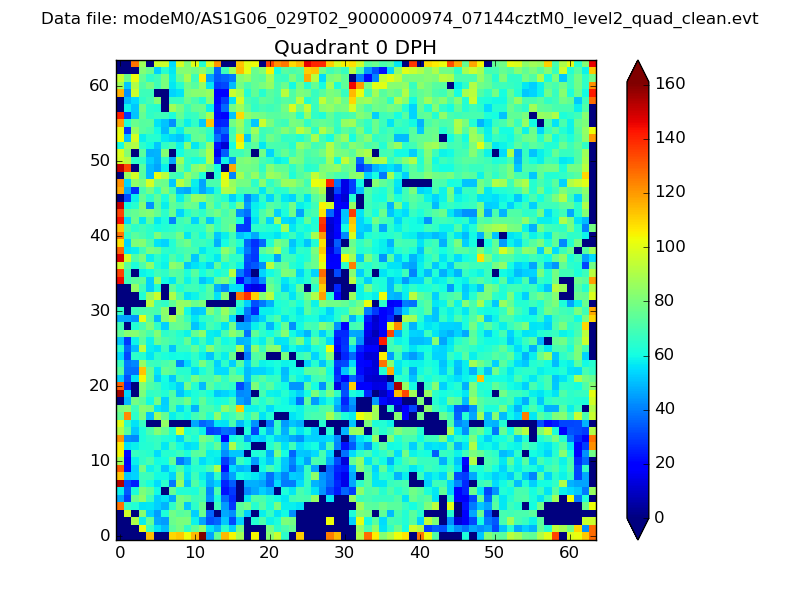 |
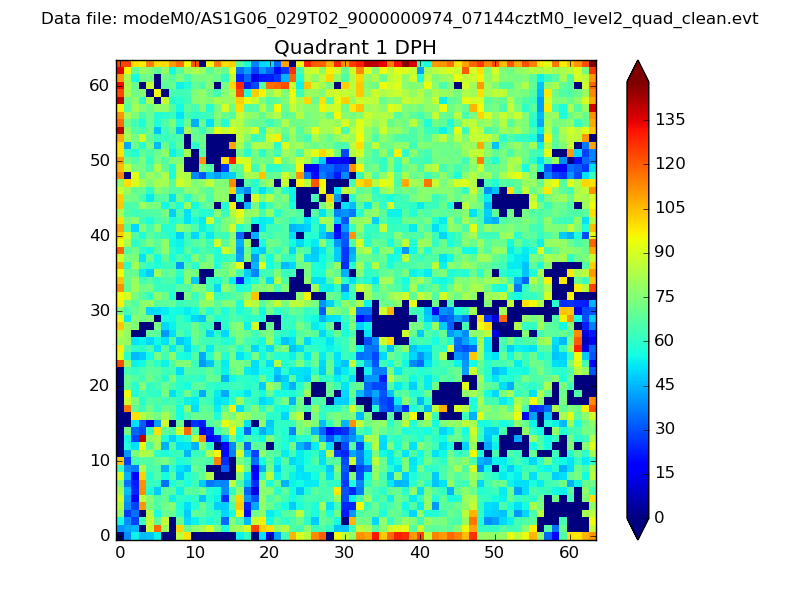 |
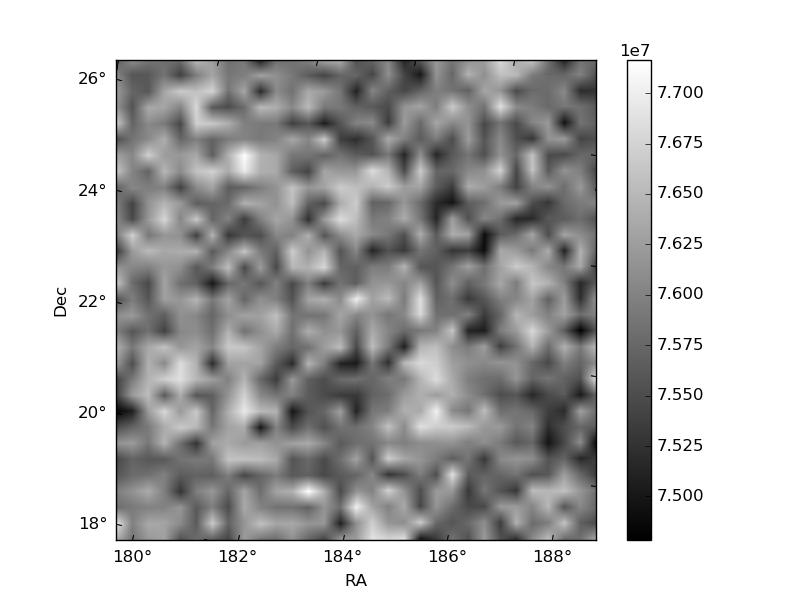
Quadrant B |
|---|---|---|---|
| Quadrant D | 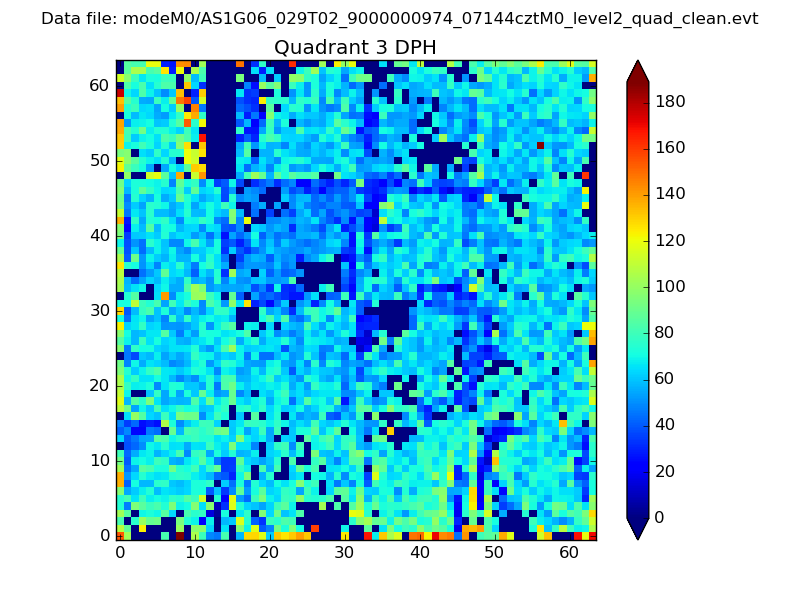 |
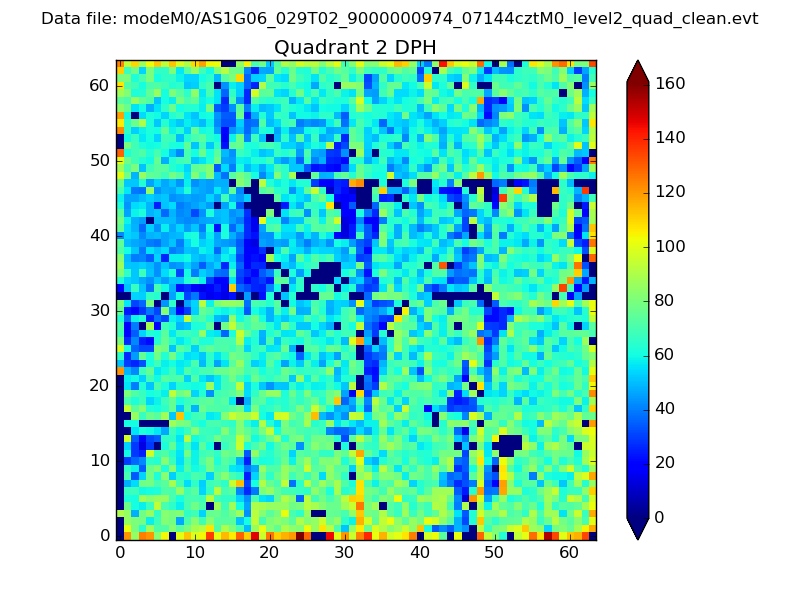 |
Quadrant C |
| Plot type | Count rate plots | Images |
|---|---|---|
| Comparison with Poisson distribution Blue bars denote a histogram of data divided into 1 sec bins. Red curve is a Poisson curve with rate = median count rate of data. |
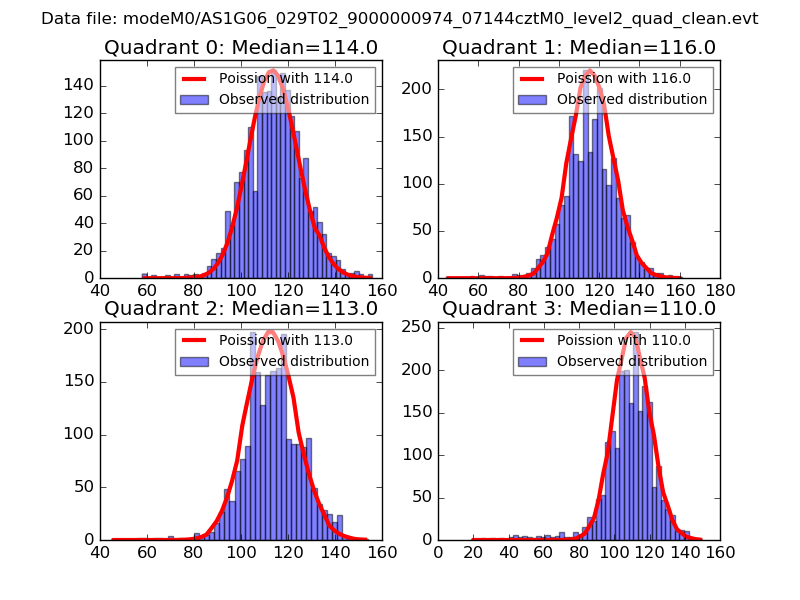 |
 |
| Quadrant-wise count rates Data is divided into 100 sec bins |
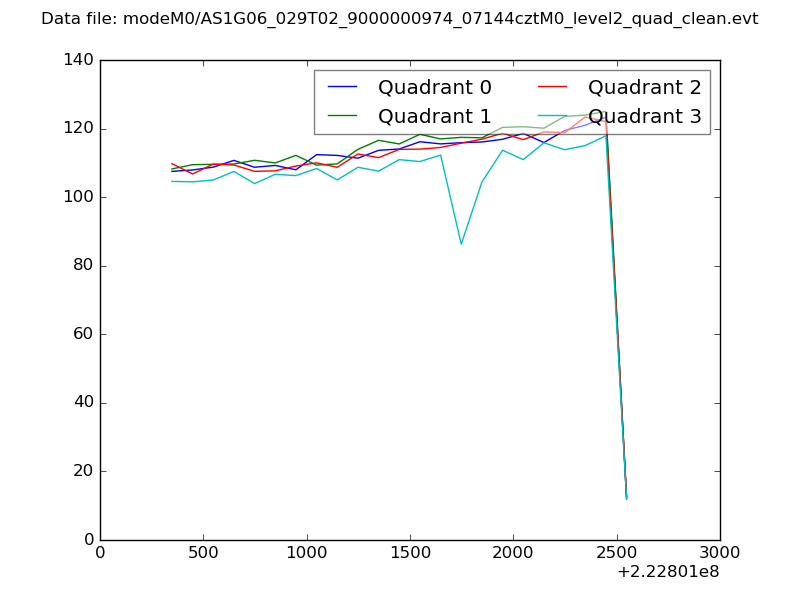 |
|
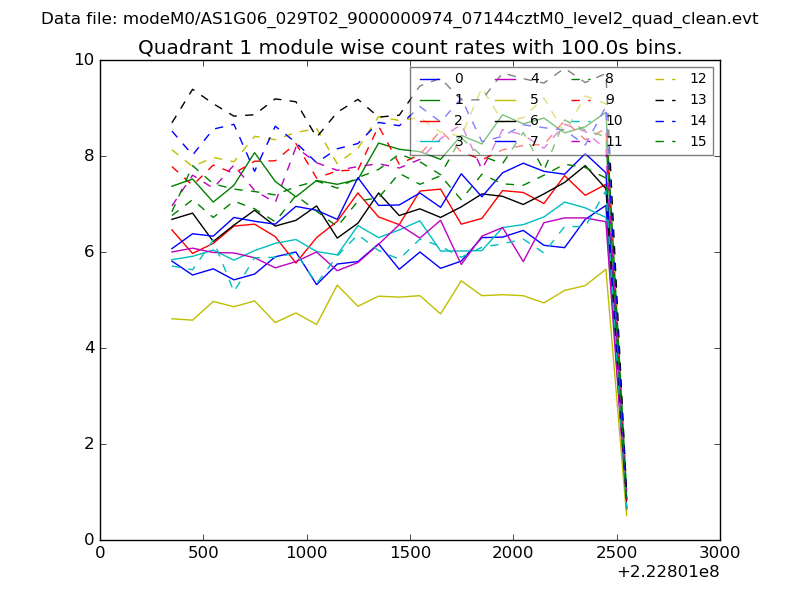
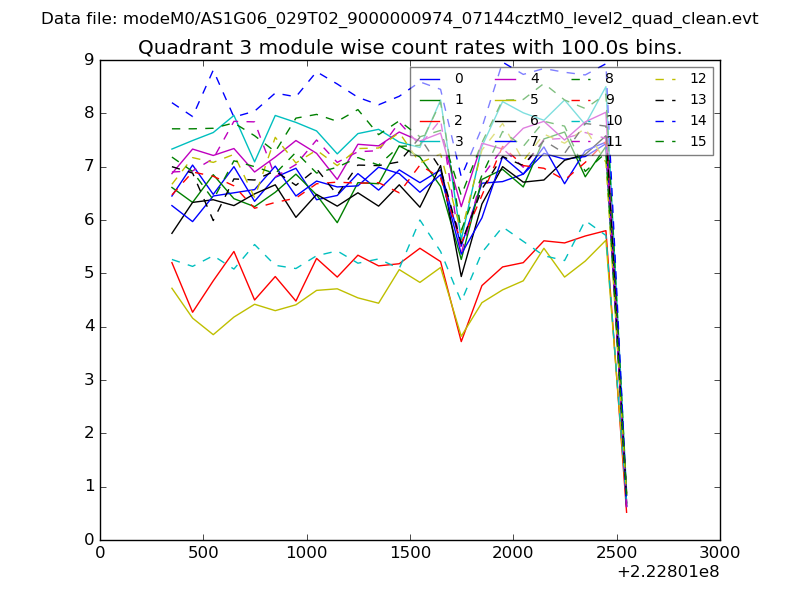
| Module-wise count rates for Quadrant A Data is divided into 100 sec bins |
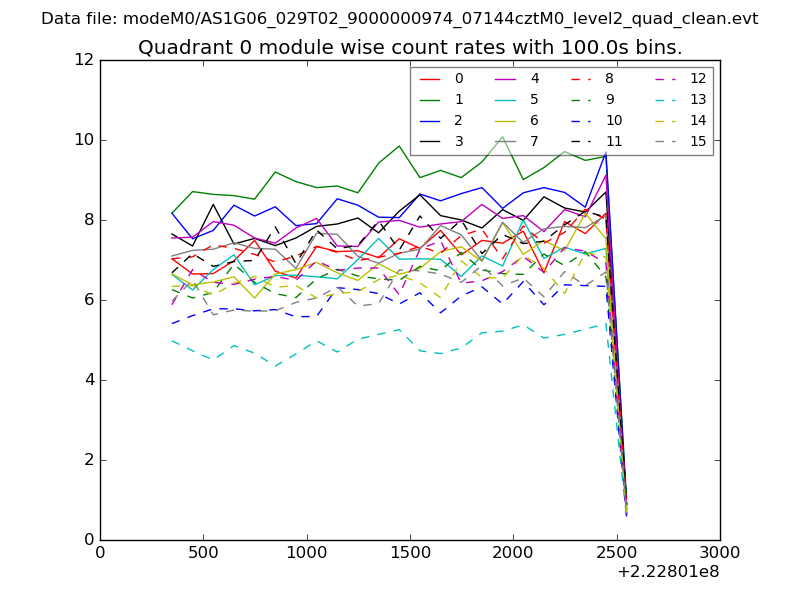 |
 |
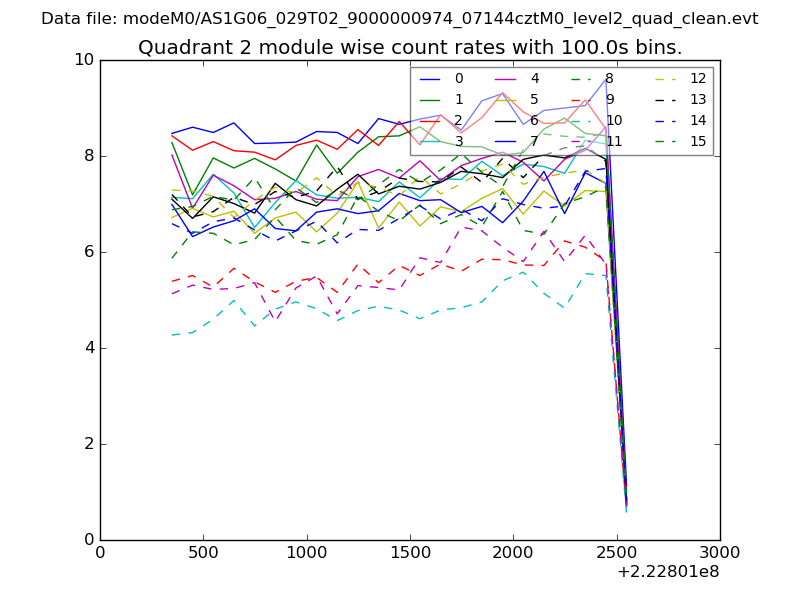
| Module-wise count rates for Quadrant B Data is divided into 100 sec bins |
 |
 |
| Module-wise count rates for Quadrant C Data is divided into 100 sec bins |
 |
 |
| Module-wise count rates for Quadrant D Data is divided into 100 sec bins |
 |
 |
| Parameter | Plot |
|---|---|
| CZT HV Monitor | 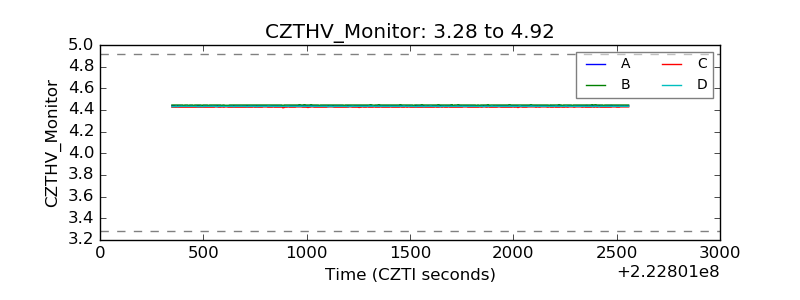 |
| D_VDD | 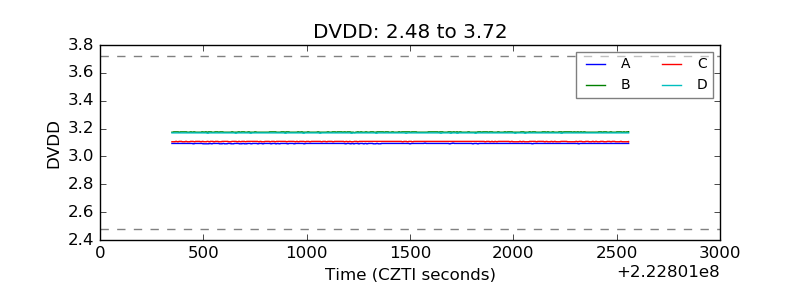 |
| Temperature 1 | 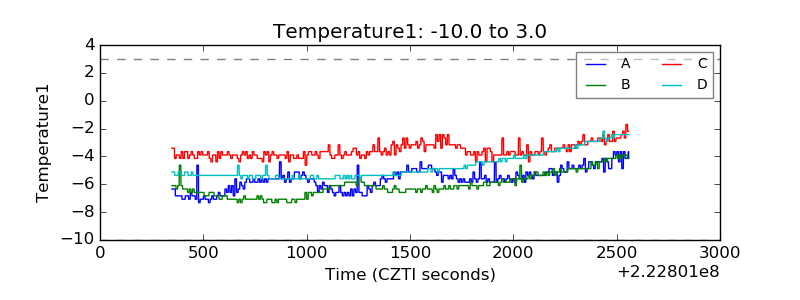 |
| Veto HV Monitor | 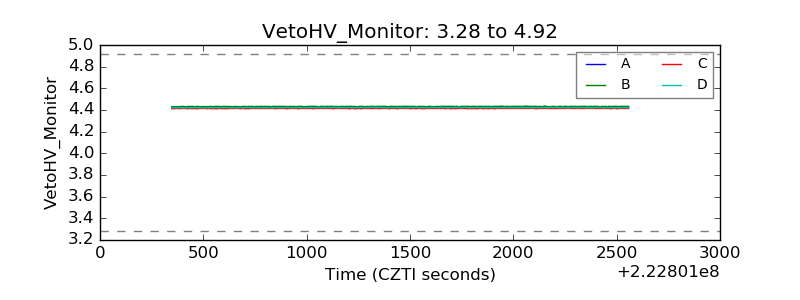 |
| Veto LLD |  |
| Alpha Counter | 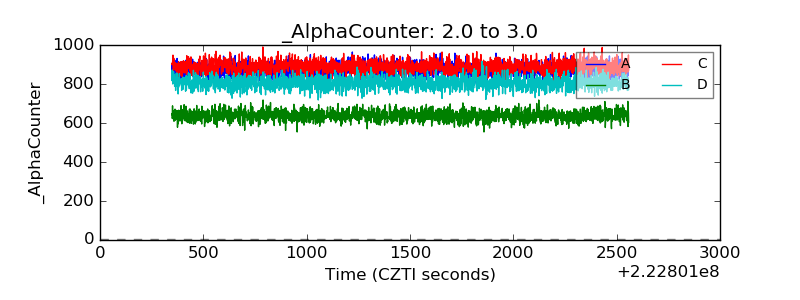 |
| _CPM_Rate | 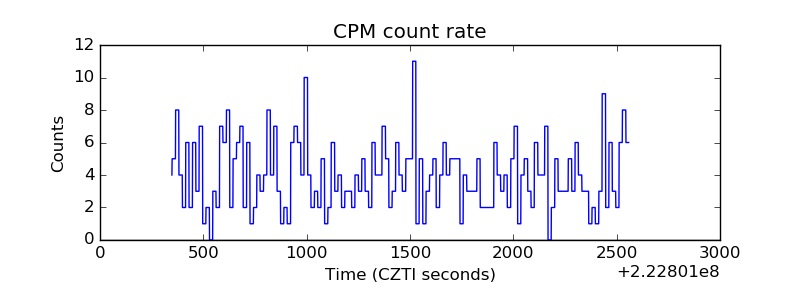 |
| CZT Counter | 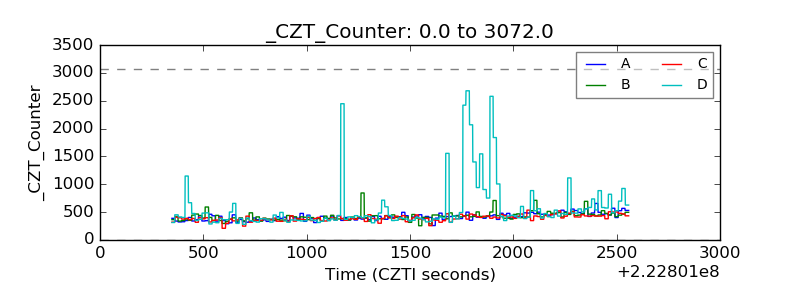 |
| +2.5 Volts monitor |  |
| +5 Volts monitor | 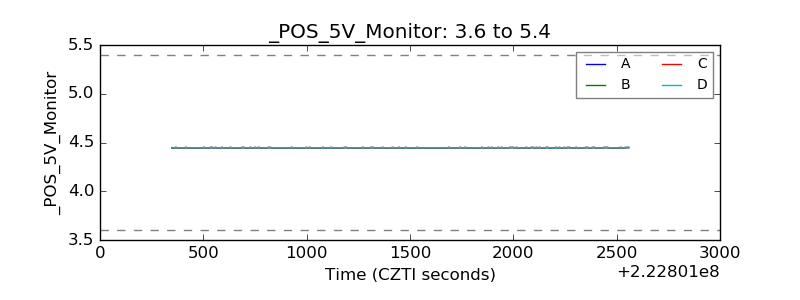 |
| _ROLL_ROT | 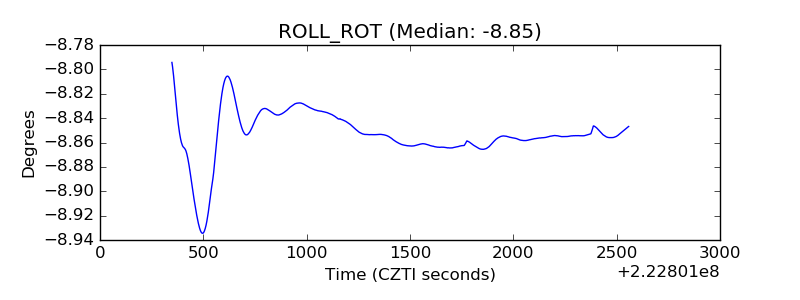 |
| _Roll_DEC | 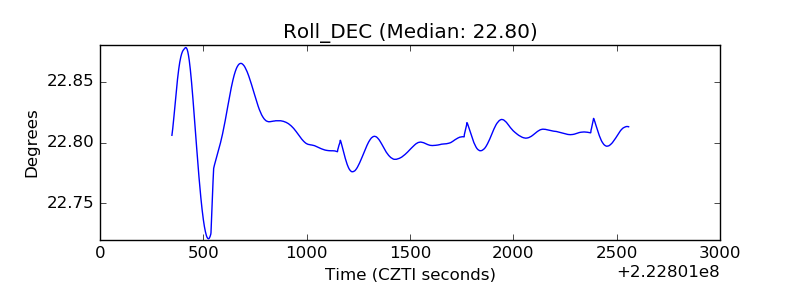 |
| _Roll_RA | 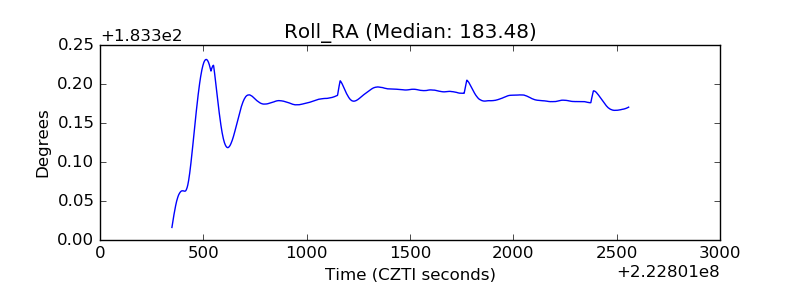 |
| Veto Counter | 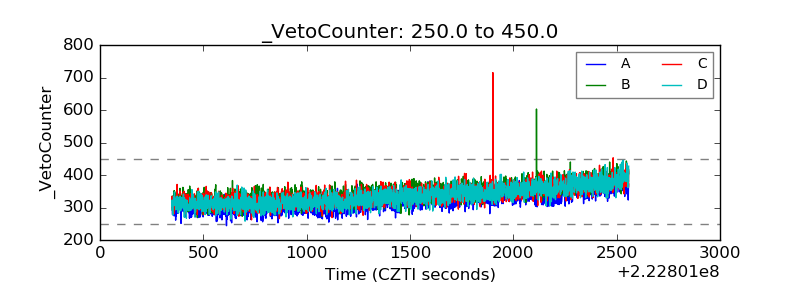 |