| Param | Original file | Final file |
|---|---|---|
| Filename | modeM0/AS1G06_029T02_9000000974_07145cztM0_level2.evt | modeM0/AS1G06_029T02_9000000974_07145cztM0_level2_quad_clean.evt |
| Size (bytes) | 976,671,360 | 171,829,440 |
| Size | 931.4 MB | 163.9 MB |
| Events in quadrant A | 6,357,817 | 1,078,467 |
| Events in quadrant B | 6,502,315 | 1,098,439 |
| Events in quadrant C | 6,197,298 | 1,085,836 |
| Events in quadrant D | 9,612,229 | 1,013,083 |
| Mode M9 | |||
|---|---|---|---|
| Quadrant | BADHDUFLAG | Total packets | Discarded packets |
| A | 0 | 26 | 0 |
| B | 0 | 26 | 0 |
| C | 0 | 26 | 0 |
| D | 0 | 26 | 0 |
| Mode SS | |||
|---|---|---|---|
| Quadrant | BADHDUFLAG | Total packets | Discarded packets |
| A | 0 | 274 | 0 |
| B | 0 | 274 | 0 |
| C | 0 | 274 | 0 |
| D | 0 | 274 | 0 |
| Mode M0 | |||
|---|---|---|---|
| Quadrant | BADHDUFLAG | Total packets | Discarded packets |
| A | 0 | 27938 | 4 |
| B | 0 | 28360 | 3 |
| C | 0 | 27786 | 3 |
| D | 0 | 37770 | 3 |
| Quadrant | Total seconds | Saturated seconds | Saturation percentage |
|---|---|---|---|
| A | 13438 | 82 | 0.610210% |
| B | 13438 | 100 | 0.744158% |
| C | 13438 | 71 | 0.528352% |
| D | 13438 | 684 | 5.090043% |
Noise dominated data is calculated using 1-second bins in cleaned event files. If a bin has >2000 counts, and if more than 50% of those come from <1% of pixels, then it is considered to be noise-dominated and hence unusable.
| Quadrant | # 1 sec bins | Bins with >0 counts | Bins with >2000 counts | High rate bins dominated by noise | Noise dominated (total time) | Noise dominated (detector-on time) | Marked lightcurve |
|---|---|---|---|---|---|---|---|
| A | 16028 | 13439 | 4 | 4 | 0.02% | 0.03% | 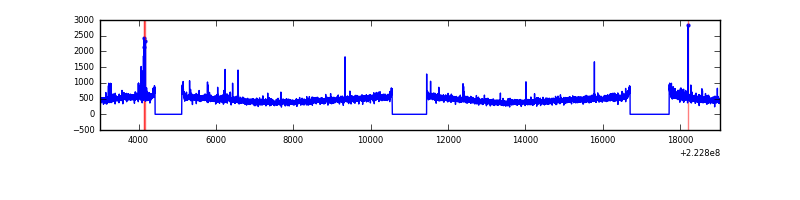 |
| B | 16028 | 13439 | 8 | 8 | 0.05% | 0.06% | 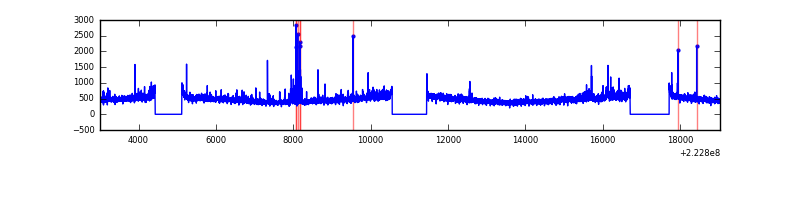 |
| C | 16028 | 13440 | 9 | 9 | 0.06% | 0.07% | 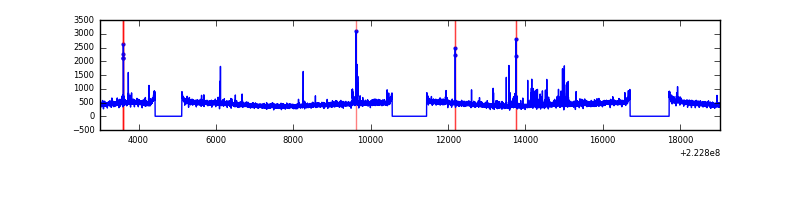 |
| D | 16028 | 13440 | 516 | 516 | 3.22% | 3.84% | 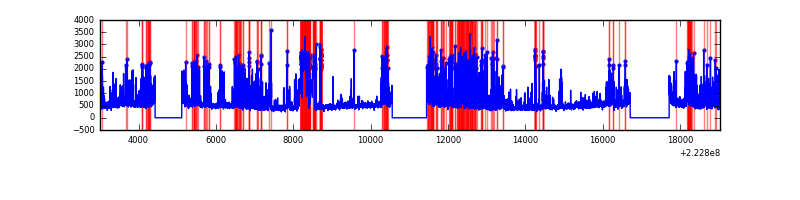 |
Top three noisy pixels from each quadrant. If the there are fewer than three noisy pixels in the level2.evt file, extra rows are filled as -1
| Pixel properties | Quadrant properties | ||||||
|---|---|---|---|---|---|---|---|
| Quadrant | DetID | PixID | Counts | Sigma | Mean | Median | Sigma |
| A | 8 | 15 | 258127 | 802.85 | 1569 | 1531 | 319.6 |
| A | 13 | 248 | 58710 | 178.9 | 1569 | 1531 | 319.6 |
| A | 0 | 226 | 14962 | 42.02 | 1569 | 1531 | 319.6 |
| B | 4 | 81 | 131218 | 431.08 | 1580 | 1544 | 300.8 |
| B | 0 | 214 | 102682 | 336.22 | 1580 | 1544 | 300.8 |
| B | 0 | 219 | 89034 | 290.85 | 1580 | 1544 | 300.8 |
| C | 4 | 254 | 142771 | 399.75 | 1528 | 1536 | 353.3 |
| C | 10 | 22 | 69996 | 193.77 | 1528 | 1536 | 353.3 |
| C | 13 | 61 | 11799 | 29.05 | 1528 | 1536 | 353.3 |
| D | 2 | 216 | 2447115 | 6651.48 | 1498 | 1452 | 367.7 |
| D | 2 | 14 | 885124 | 2403.33 | 1498 | 1452 | 367.7 |
| D | 8 | 195 | 309239 | 837.09 | 1498 | 1452 | 367.7 |
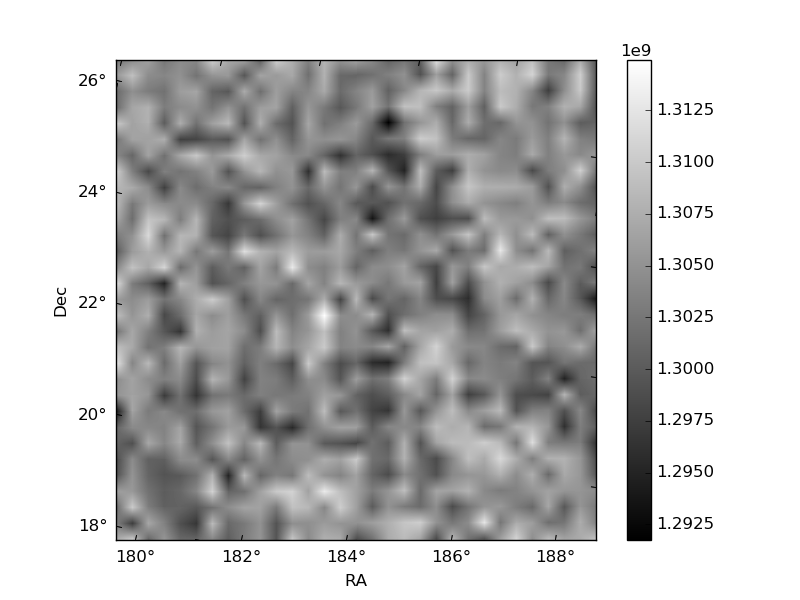
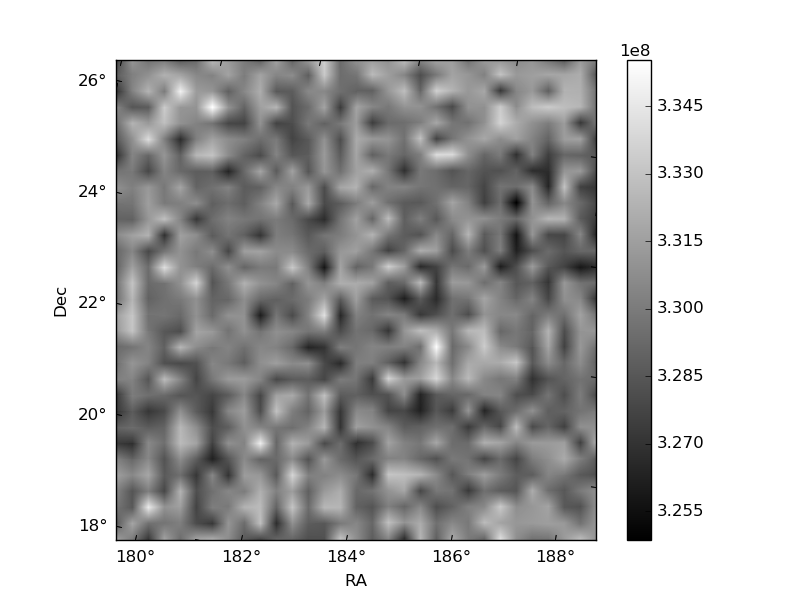
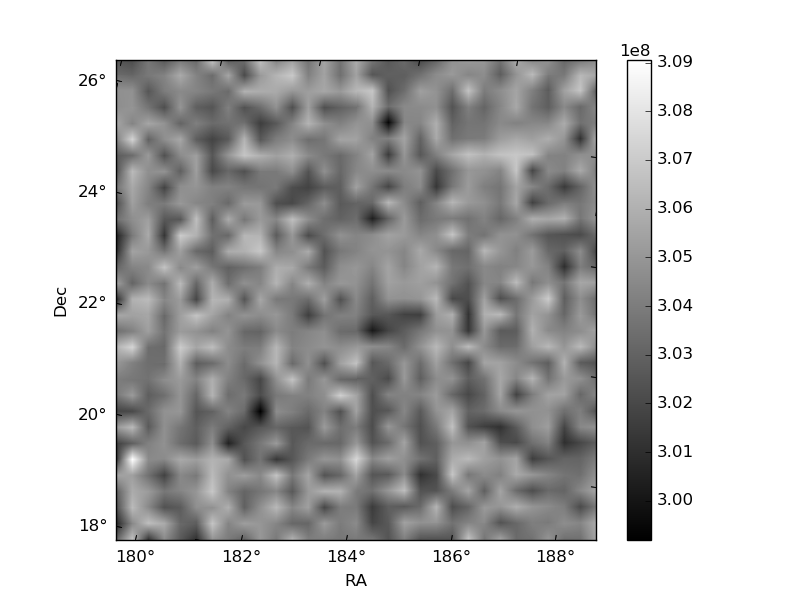
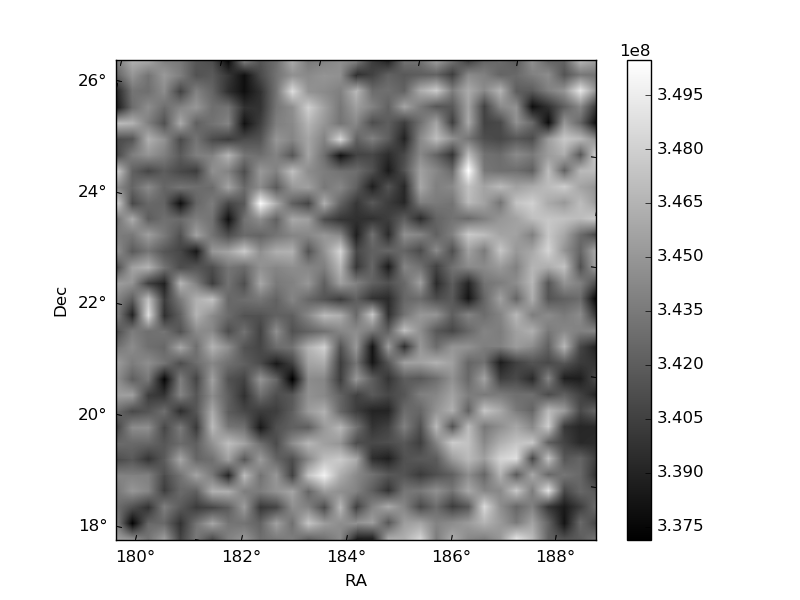
Histogram calculated using DETX and DETY for each event in the final _common_clean file
| Quadrant A | 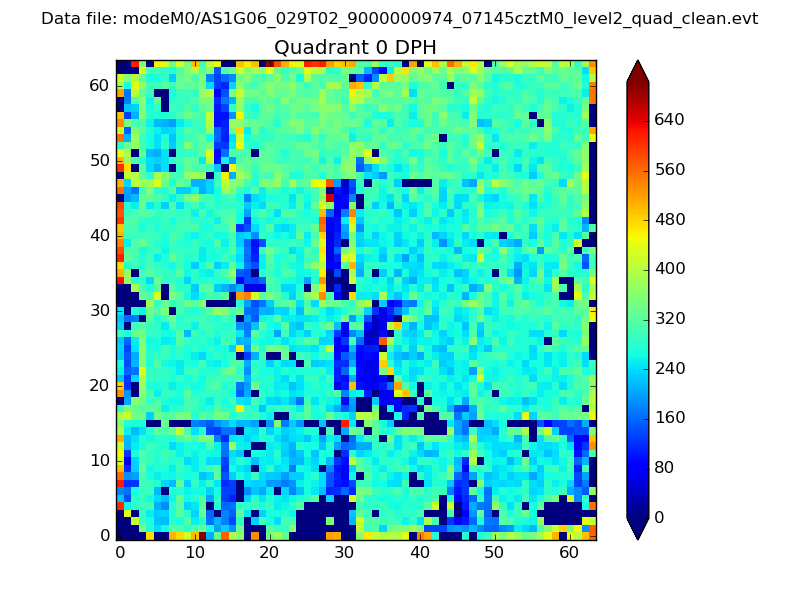 |
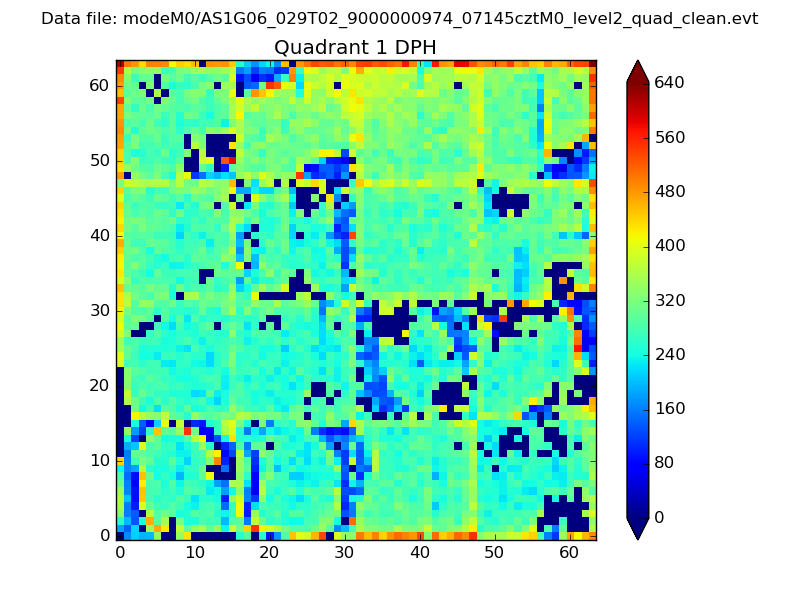 |
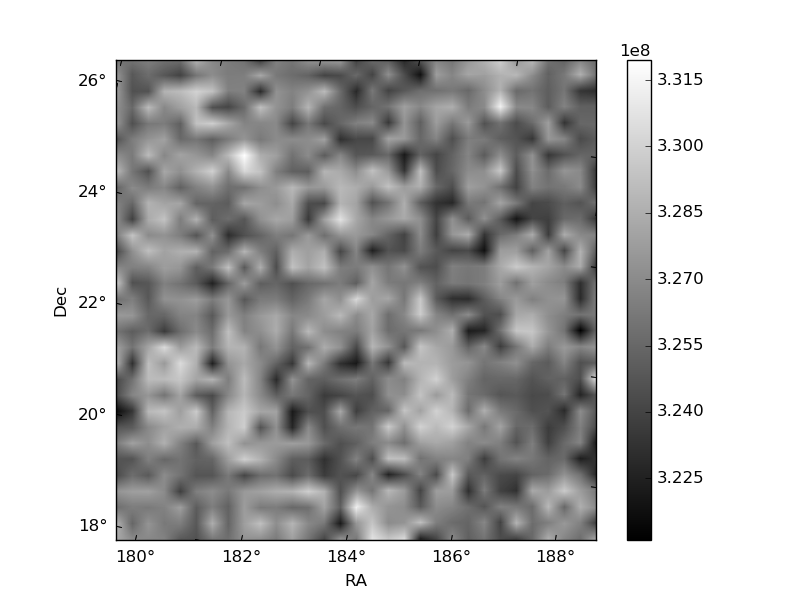
Quadrant B |
|---|---|---|---|
| Quadrant D | 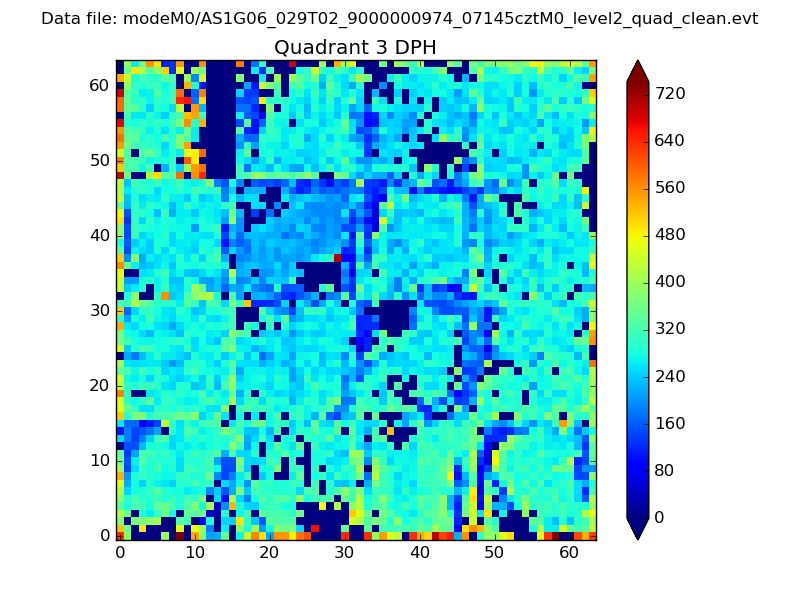 |
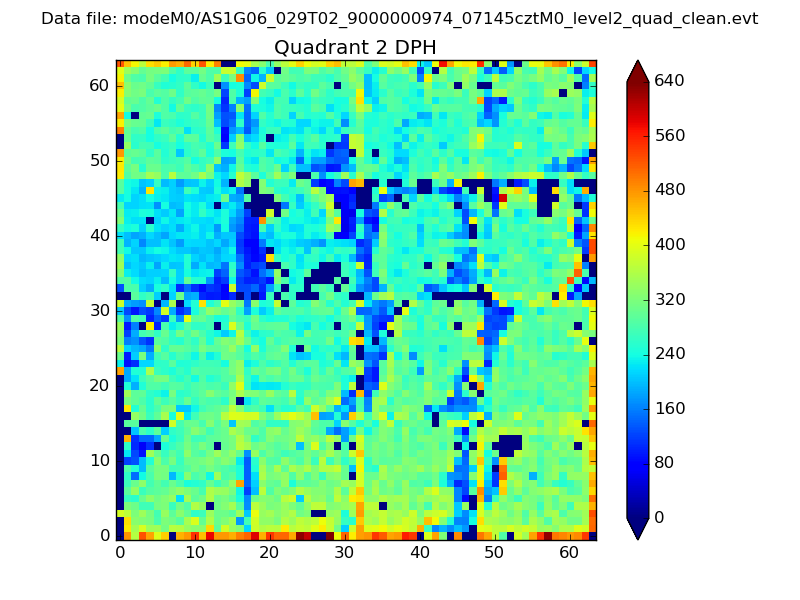 |
Quadrant C |
| Plot type | Count rate plots | Images |
|---|---|---|
| Comparison with Poisson distribution Blue bars denote a histogram of data divided into 1 sec bins. Red curve is a Poisson curve with rate = median count rate of data. |
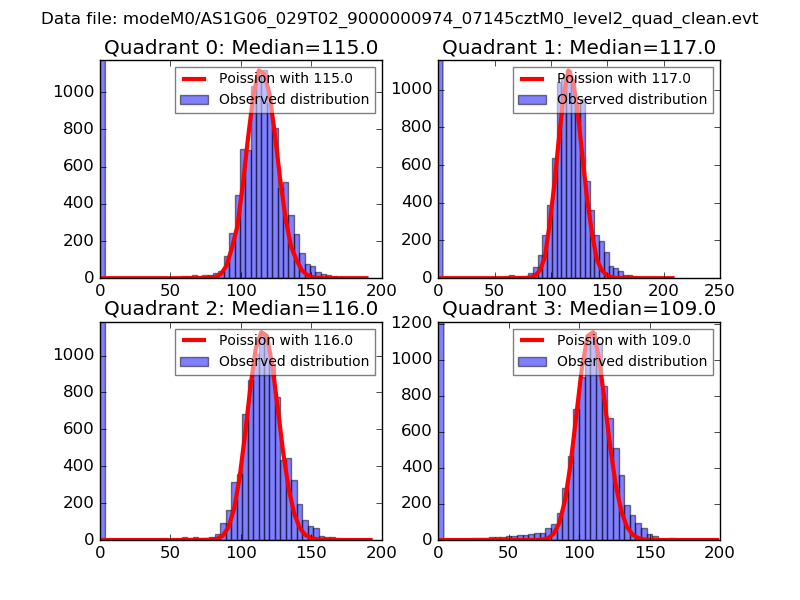 |
 |
| Quadrant-wise count rates Data is divided into 100 sec bins |
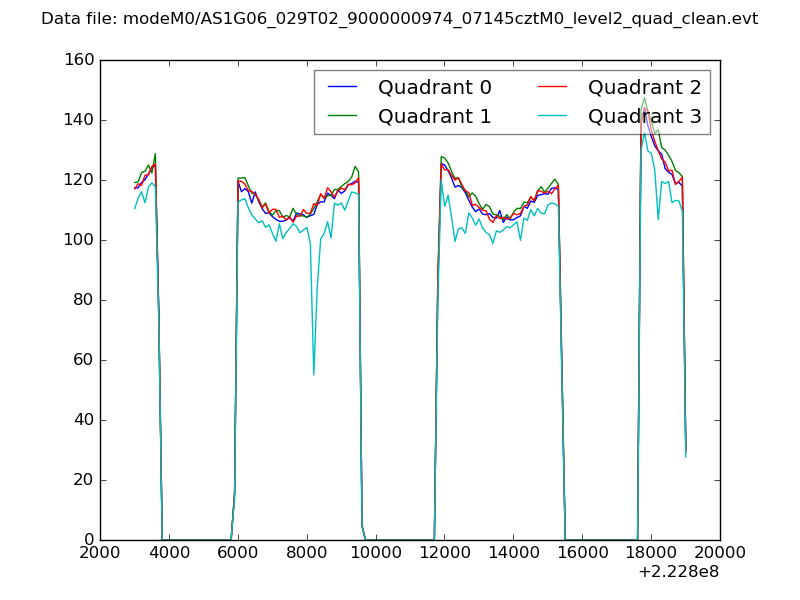 |
|
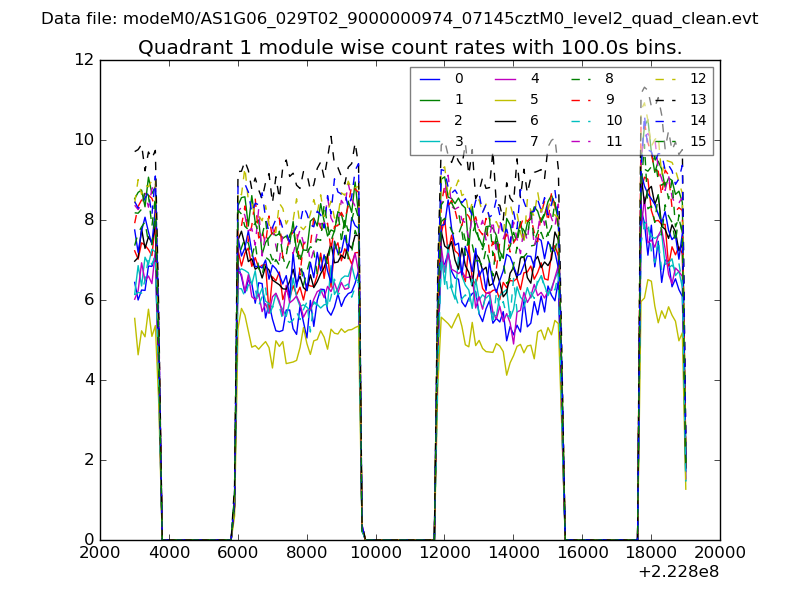
| Module-wise count rates for Quadrant A Data is divided into 100 sec bins |
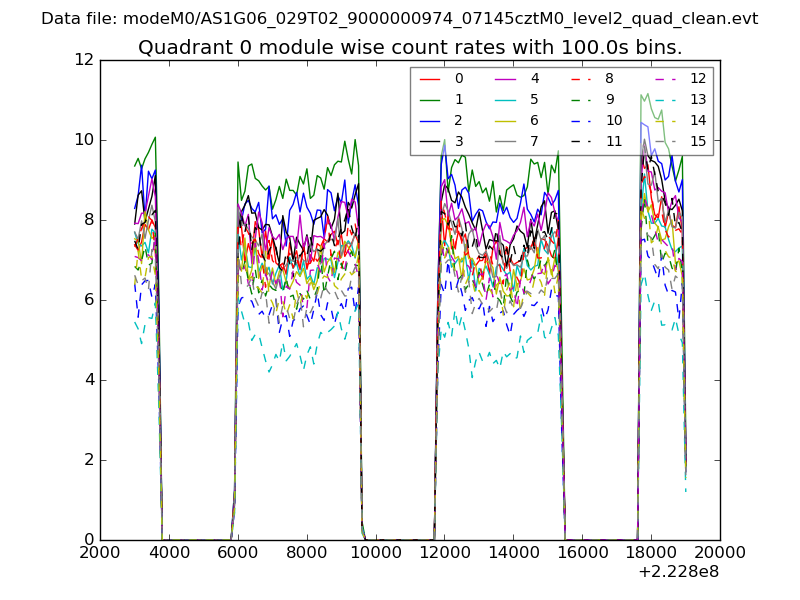 |
 |
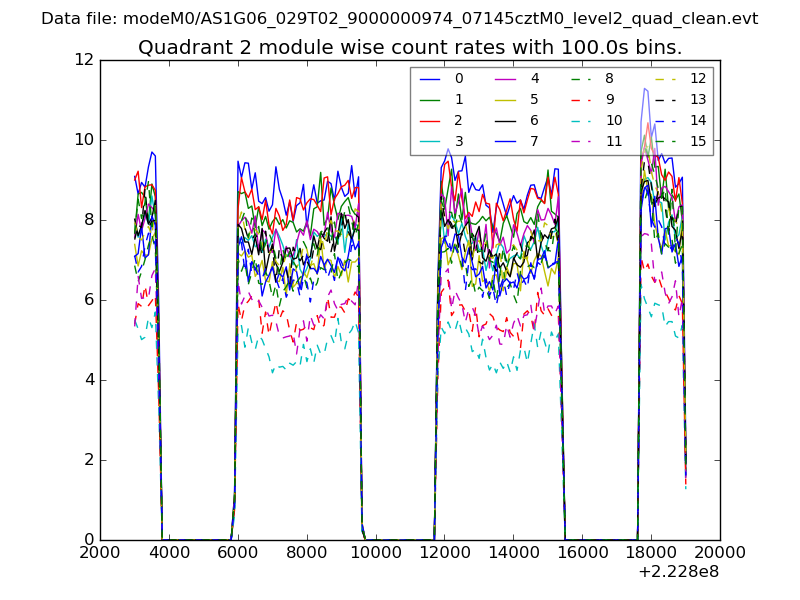
| Module-wise count rates for Quadrant B Data is divided into 100 sec bins |
 |
 |
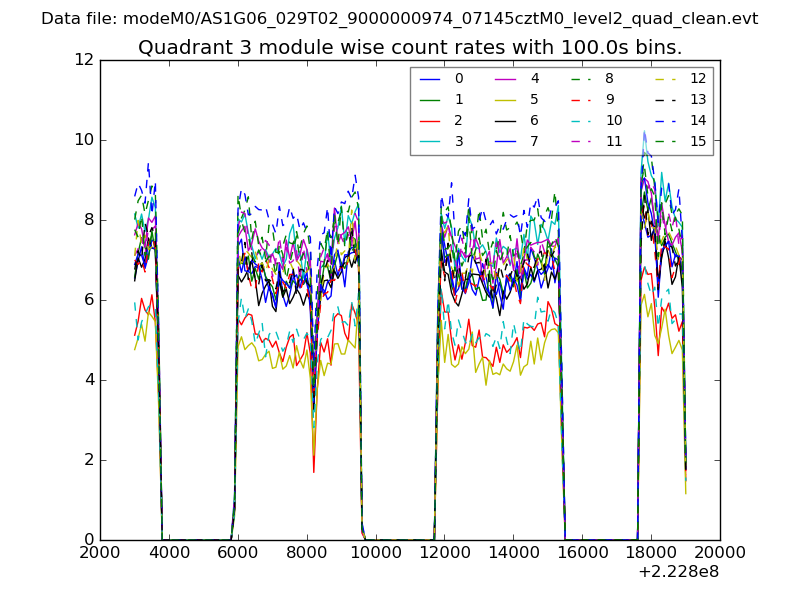
| Module-wise count rates for Quadrant C Data is divided into 100 sec bins |
 |
 |
| Module-wise count rates for Quadrant D Data is divided into 100 sec bins |
 |
 |
| Parameter | Plot |
|---|---|
| CZT HV Monitor | 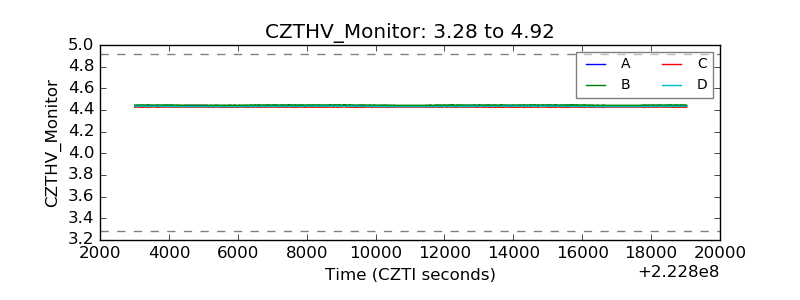 |
| D_VDD | 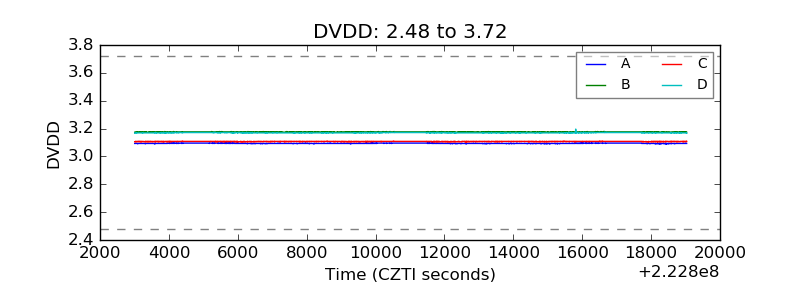 |
| Temperature 1 | 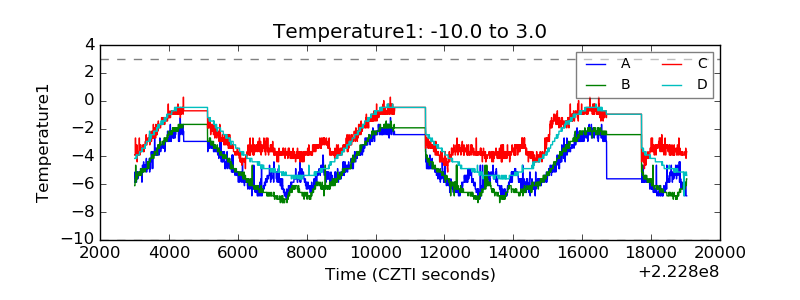 |
| Veto HV Monitor | 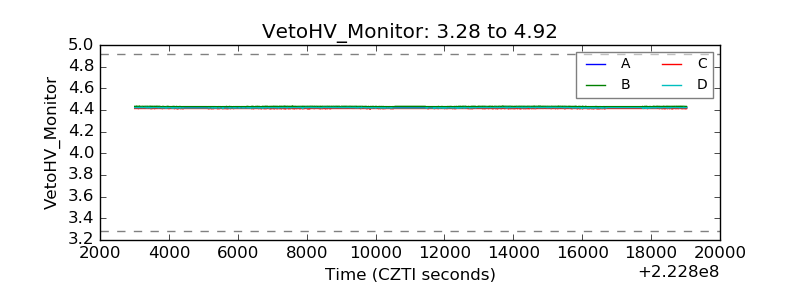 |
| Veto LLD | 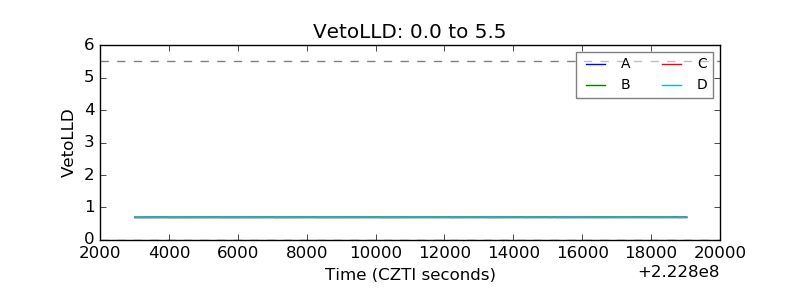 |
| Alpha Counter | 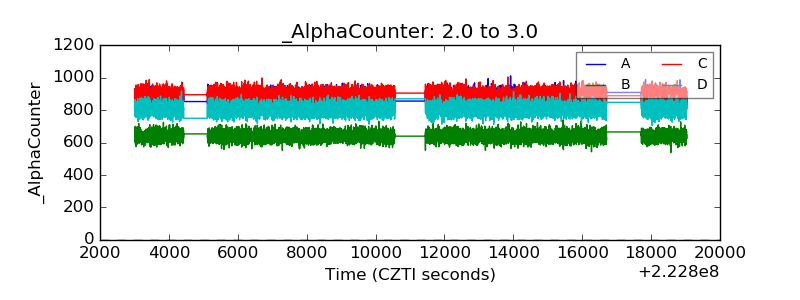 |
| _CPM_Rate | 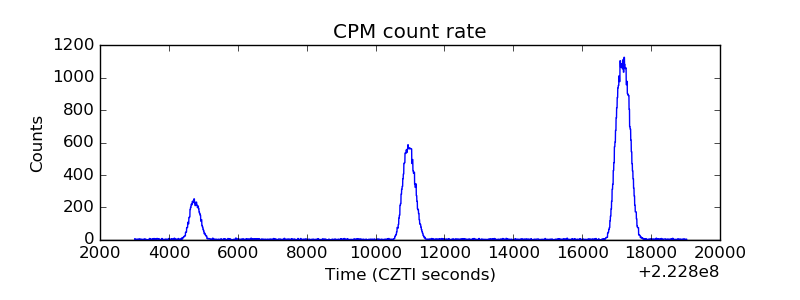 |
| CZT Counter | 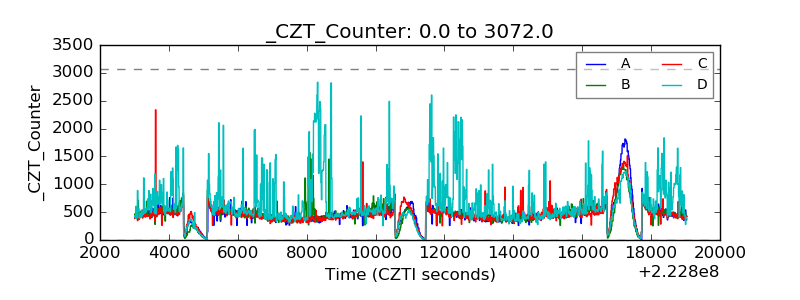 |
| +2.5 Volts monitor |  |
| +5 Volts monitor |  |
| _ROLL_ROT | 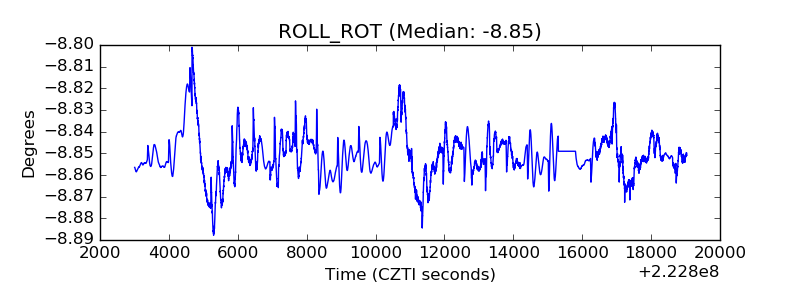 |
| _Roll_DEC | 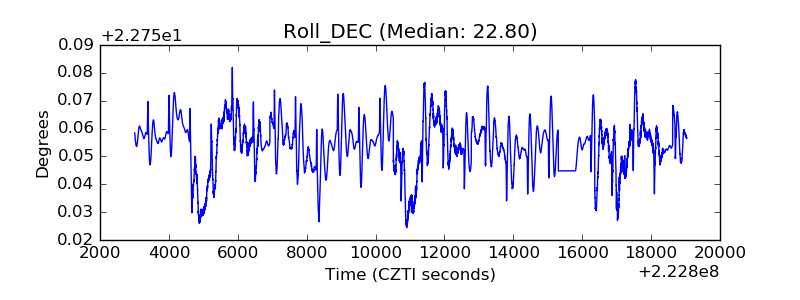 |
| _Roll_RA | 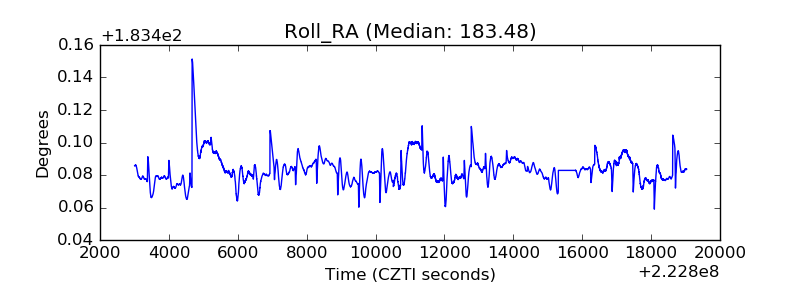 |
| Veto Counter | 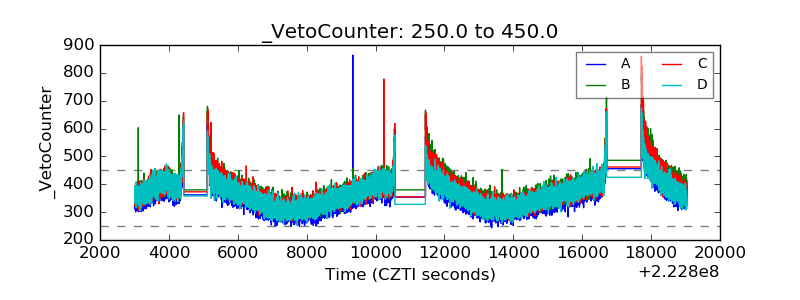 |