| Param | Original file | Final file |
|---|---|---|
| Filename | modeM0/AS1G06_029T02_9000000974_07148cztM0_level2.evt | modeM0/AS1G06_029T02_9000000974_07148cztM0_level2_quad_clean.evt |
| Size (bytes) | 914,063,040 | 166,913,280 |
| Size | 871.7 MB | 159.2 MB |
| Events in quadrant A | 6,075,310 | 1,053,023 |
| Events in quadrant B | 6,070,661 | 1,090,668 |
| Events in quadrant C | 6,458,843 | 1,056,918 |
| Events in quadrant D | 8,235,652 | 994,226 |
| Mode M9 | |||
|---|---|---|---|
| Quadrant | BADHDUFLAG | Total packets | Discarded packets |
| A | 0 | 33 | 0 |
| B | 0 | 33 | 0 |
| C | 0 | 33 | 0 |
| D | 0 | 33 | 0 |
| Mode SS | |||
|---|---|---|---|
| Quadrant | BADHDUFLAG | Total packets | Discarded packets |
| A | 0 | 256 | 0 |
| B | 0 | 256 | 0 |
| C | 0 | 256 | 0 |
| D | 0 | 256 | 0 |
| Mode M0 | |||
|---|---|---|---|
| Quadrant | BADHDUFLAG | Total packets | Discarded packets |
| A | 0 | 26501 | 4 |
| B | 0 | 26586 | 3 |
| C | 0 | 27836 | 3 |
| D | 0 | 33273 | 3 |
| Quadrant | Total seconds | Saturated seconds | Saturation percentage |
|---|---|---|---|
| A | 12443 | 105 | 0.843848% |
| B | 12443 | 113 | 0.908141% |
| C | 12443 | 235 | 1.888612% |
| D | 12443 | 451 | 3.624528% |
Noise dominated data is calculated using 1-second bins in cleaned event files. If a bin has >2000 counts, and if more than 50% of those come from <1% of pixels, then it is considered to be noise-dominated and hence unusable.
| Quadrant | # 1 sec bins | Bins with >0 counts | Bins with >2000 counts | High rate bins dominated by noise | Noise dominated (total time) | Noise dominated (detector-on time) | Marked lightcurve |
|---|---|---|---|---|---|---|---|
| A | 15783 | 12445 | 35 | 35 | 0.22% | 0.28% | 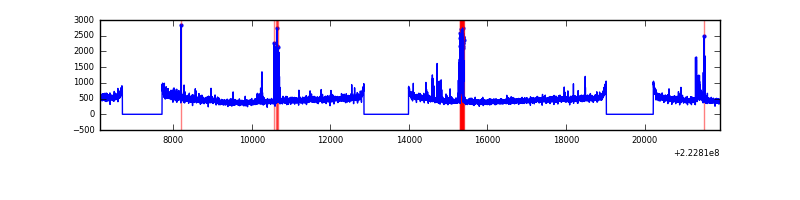 |
| B | 15783 | 12443 | 4 | 4 | 0.03% | 0.03% | 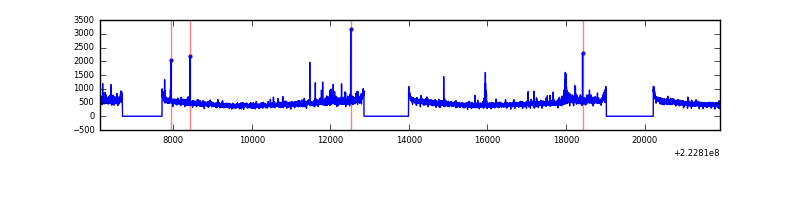 |
| C | 15783 | 12444 | 153 | 153 | 0.97% | 1.23% | 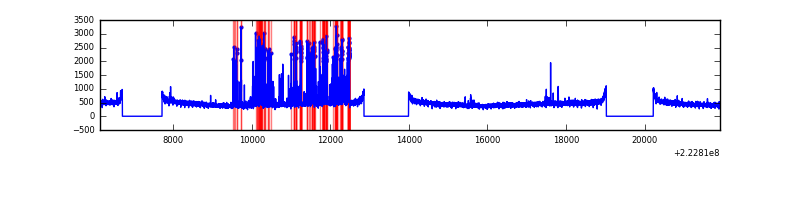 |
| D | 15783 | 12445 | 268 | 268 | 1.70% | 2.15% | 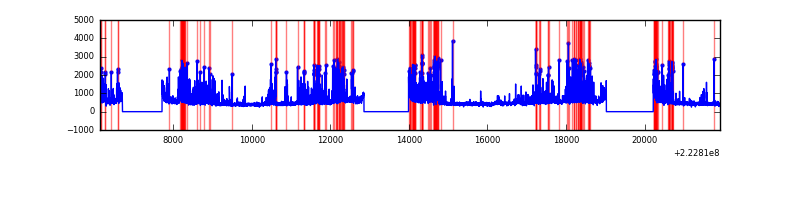 |
Top three noisy pixels from each quadrant. If the there are fewer than three noisy pixels in the level2.evt file, extra rows are filled as -1
| Pixel properties | Quadrant properties | ||||||
|---|---|---|---|---|---|---|---|
| Quadrant | DetID | PixID | Counts | Sigma | Mean | Median | Sigma |
| A | 13 | 248 | 245931 | 818.09 | 1477 | 1448 | 298.8 |
| A | 8 | 15 | 86222 | 283.67 | 1477 | 1448 | 298.8 |
| A | 15 | 174 | 53359 | 173.7 | 1477 | 1448 | 298.8 |
| B | 0 | 214 | 135344 | 473.23 | 1496 | 1458 | 282.9 |
| B | 0 | 219 | 98614 | 343.41 | 1496 | 1458 | 282.9 |
| B | 12 | 111 | 28976 | 97.26 | 1496 | 1458 | 282.9 |
| C | 4 | 254 | 859151 | 2614.6 | 1427 | 1439 | 328.0 |
| C | 10 | 22 | 14726 | 40.5 | 1427 | 1439 | 328.0 |
| C | 4 | 238 | 12872 | 34.85 | 1427 | 1439 | 328.0 |
| D | 2 | 216 | 1763677 | 5082.37 | 1409 | 1366 | 346.8 |
| D | 8 | 195 | 486334 | 1398.61 | 1409 | 1366 | 346.8 |
| D | 12 | 233 | 372506 | 1070.34 | 1409 | 1366 | 346.8 |
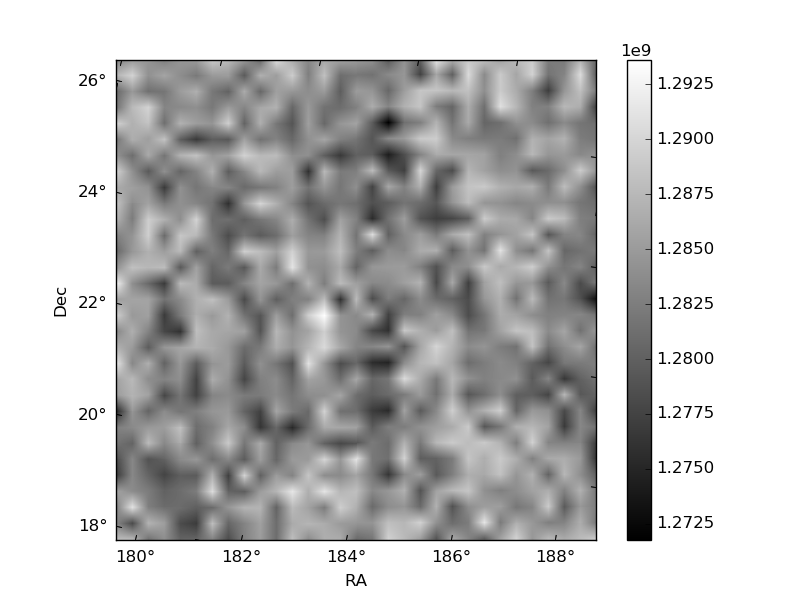
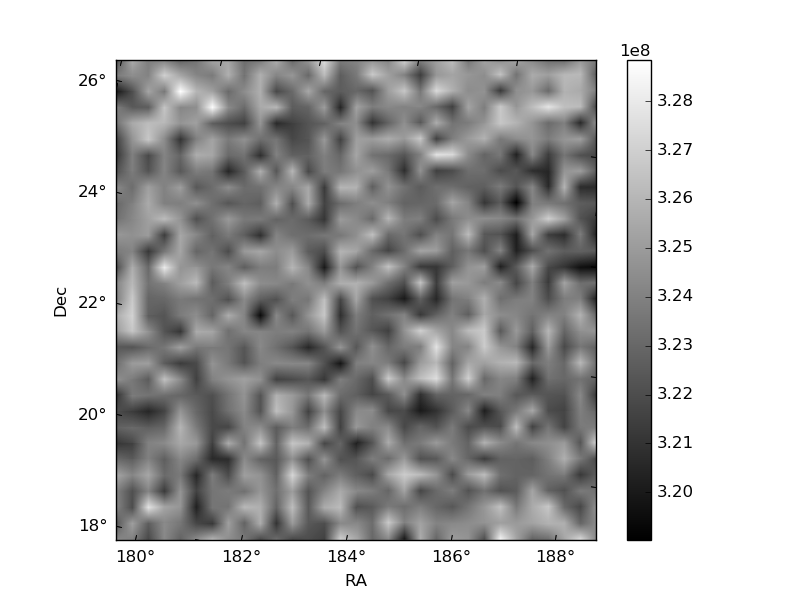
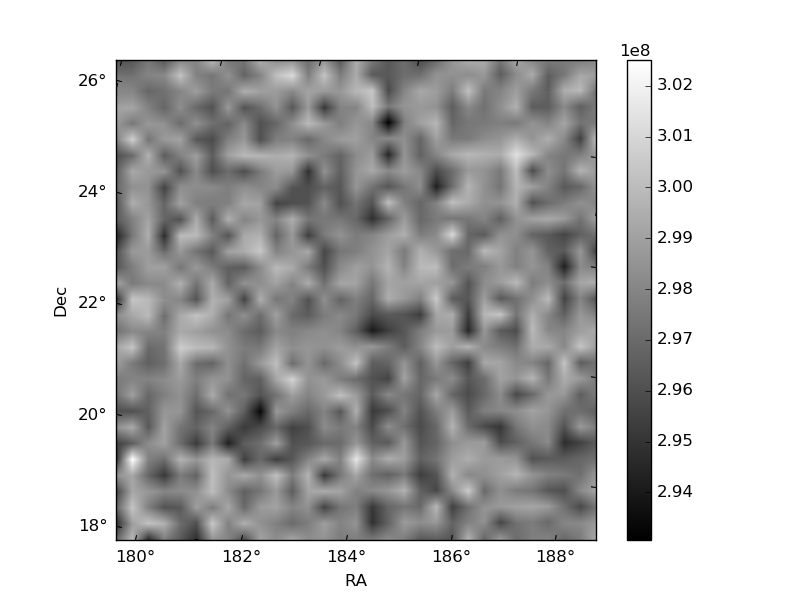
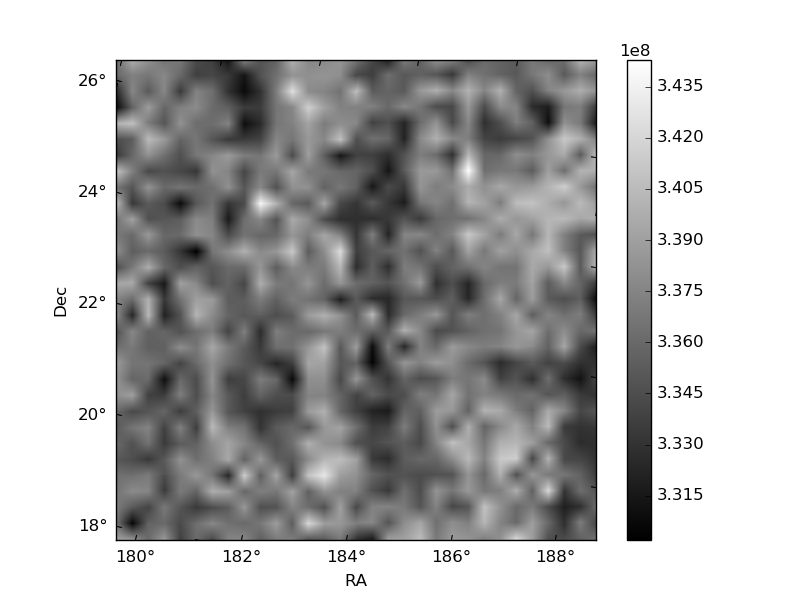
Histogram calculated using DETX and DETY for each event in the final _common_clean file
| Quadrant A | 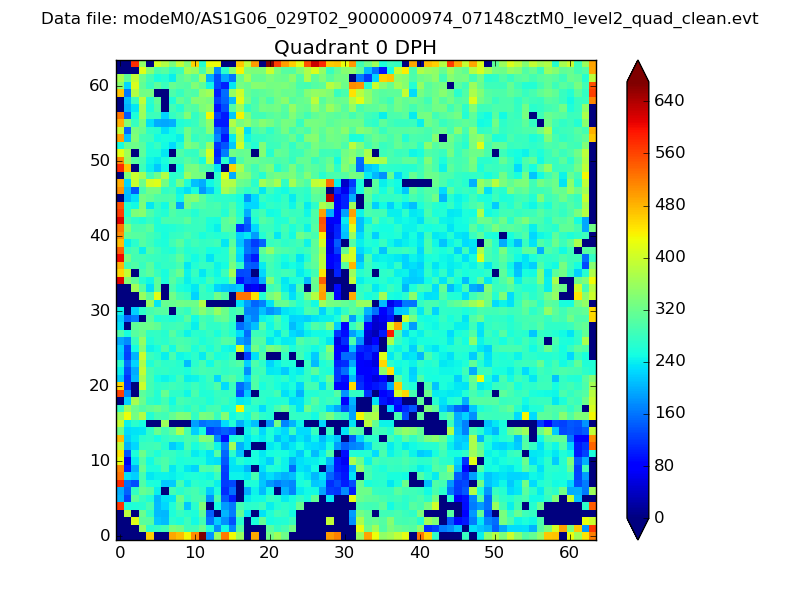 |
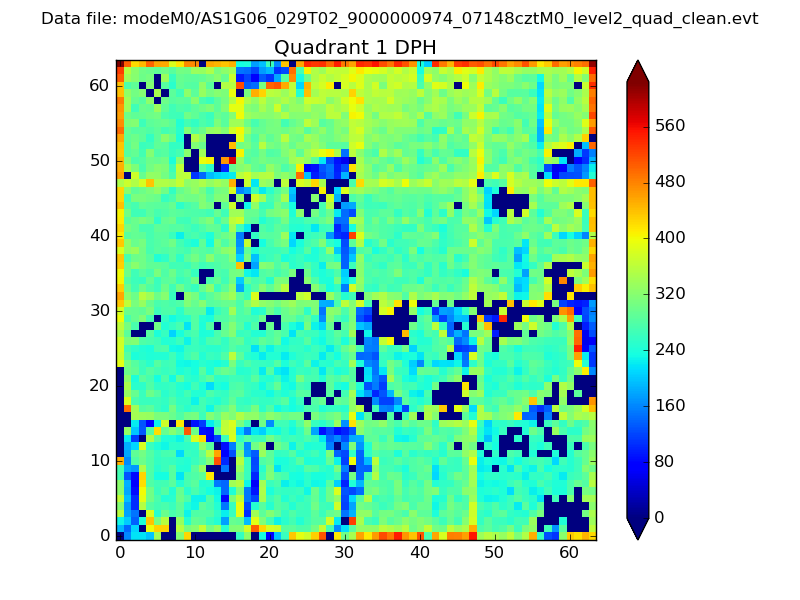 |
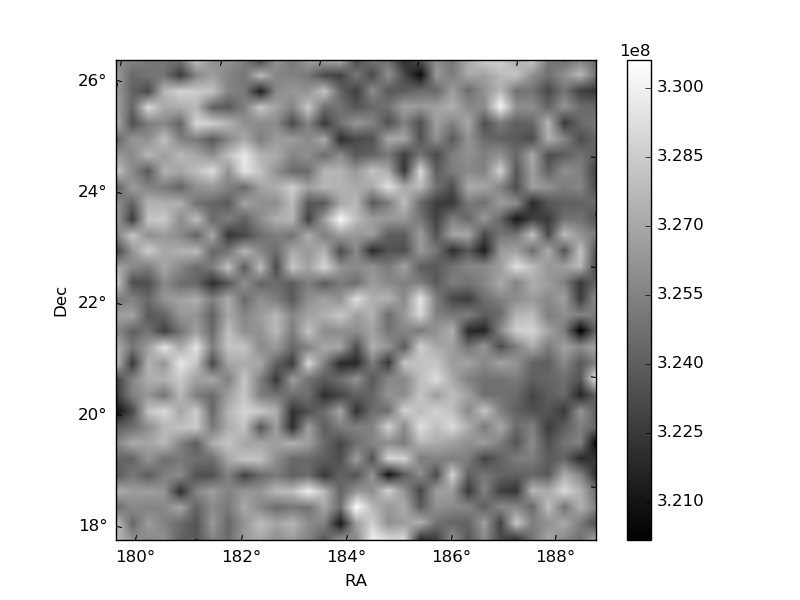
Quadrant B |
|---|---|---|---|
| Quadrant D | 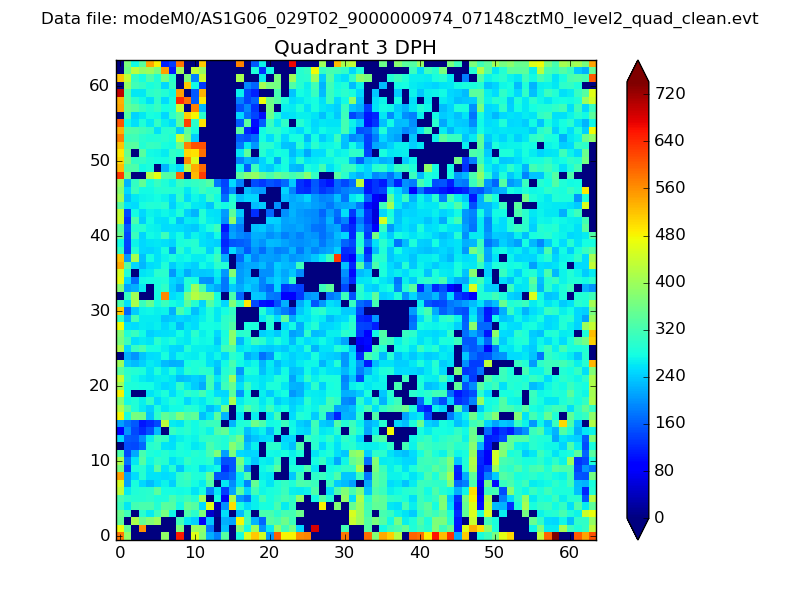 |
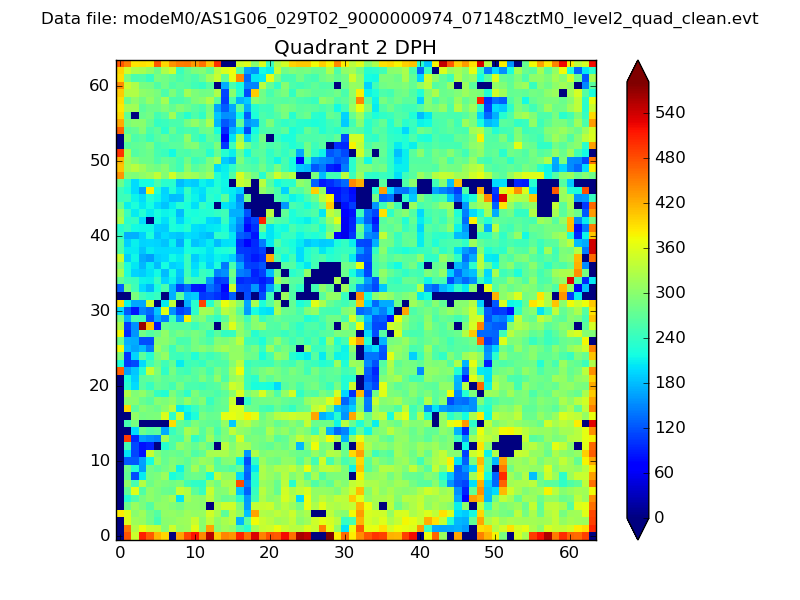 |
Quadrant C |
| Plot type | Count rate plots | Images |
|---|---|---|
| Comparison with Poisson distribution Blue bars denote a histogram of data divided into 1 sec bins. Red curve is a Poisson curve with rate = median count rate of data. |
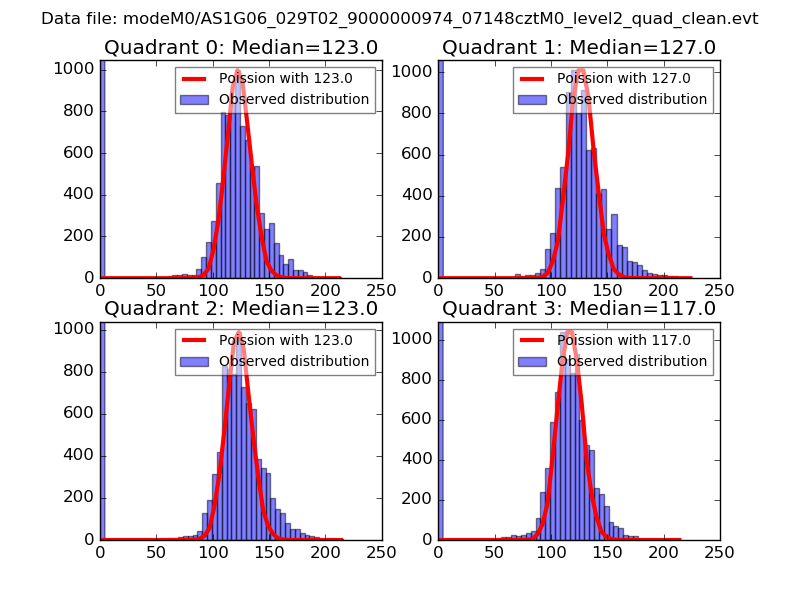 |
 |
| Quadrant-wise count rates Data is divided into 100 sec bins |
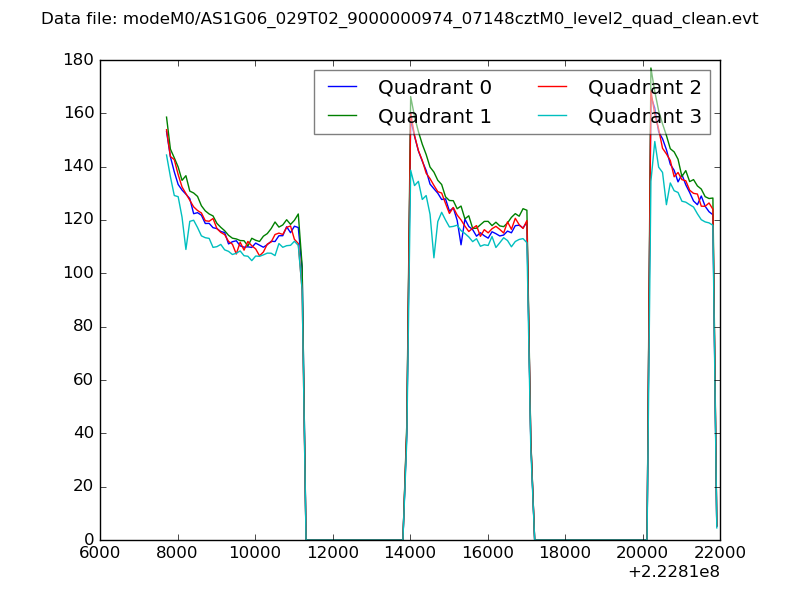 |
|
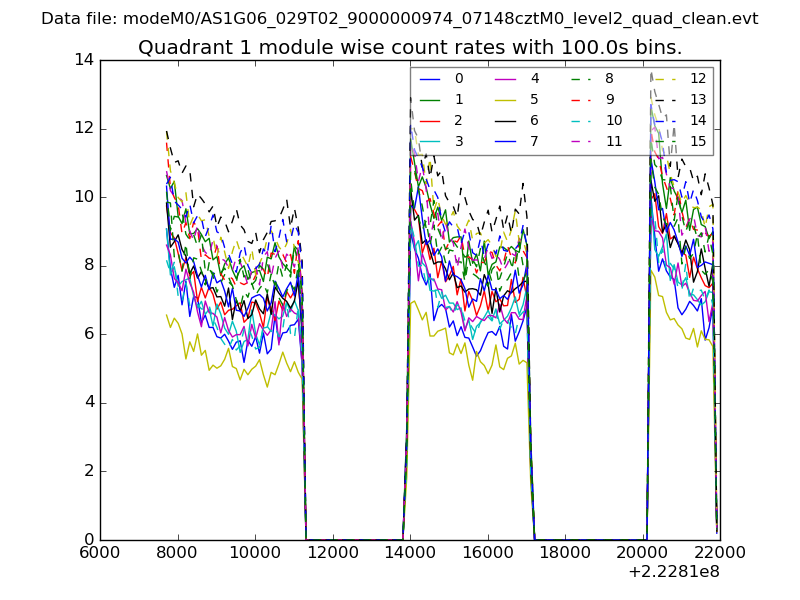
| Module-wise count rates for Quadrant A Data is divided into 100 sec bins |
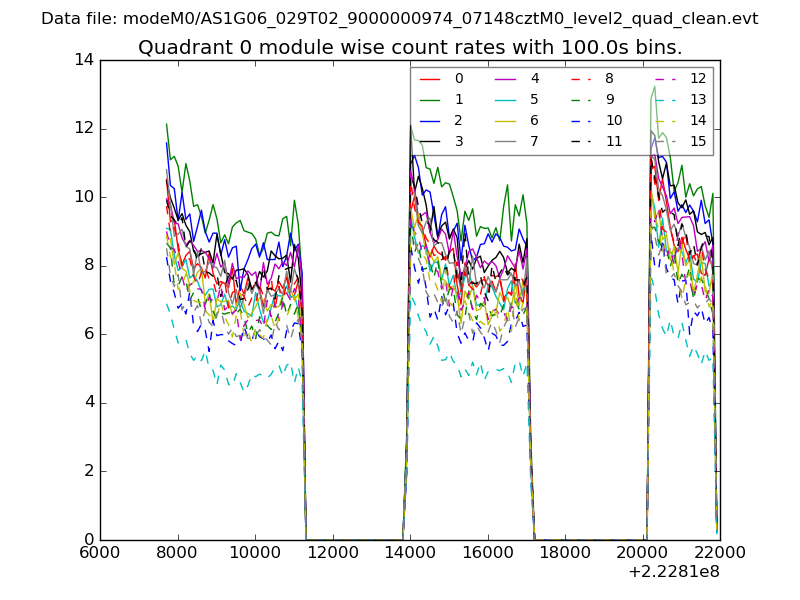 |
 |
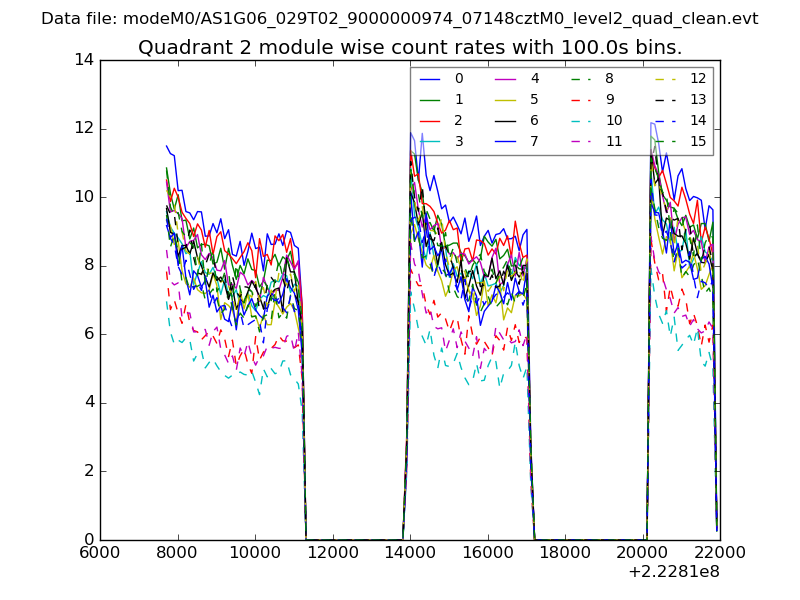
| Module-wise count rates for Quadrant B Data is divided into 100 sec bins |
 |
 |
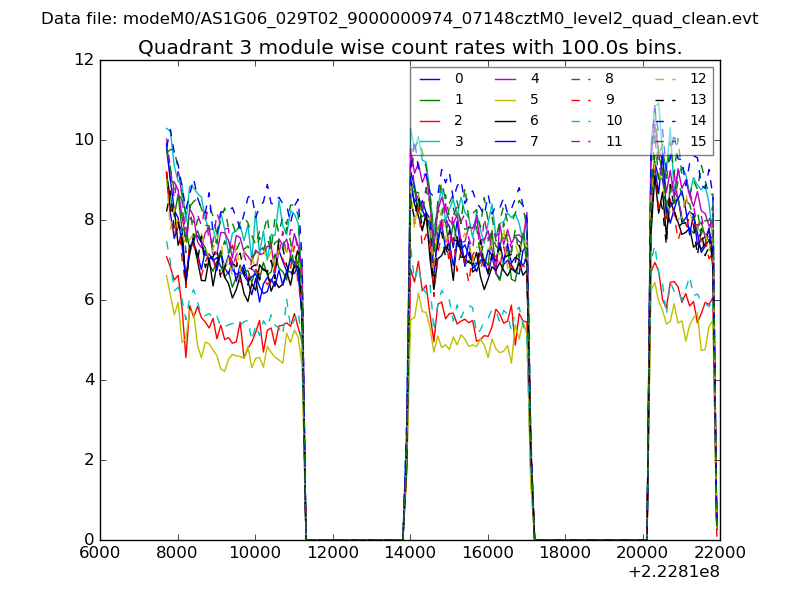
| Module-wise count rates for Quadrant C Data is divided into 100 sec bins |
 |
 |
| Module-wise count rates for Quadrant D Data is divided into 100 sec bins |
 |
 |
| Parameter | Plot |
|---|---|
| CZT HV Monitor | 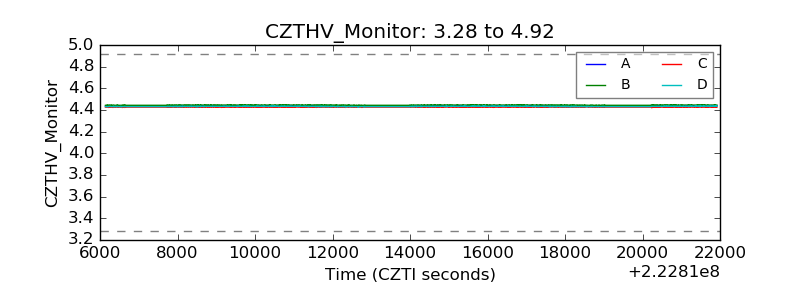 |
| D_VDD | 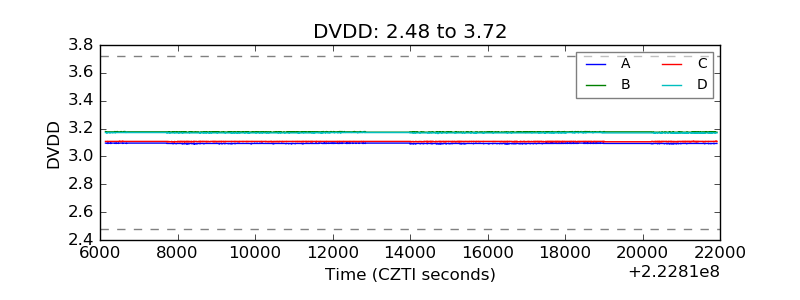 |
| Temperature 1 | 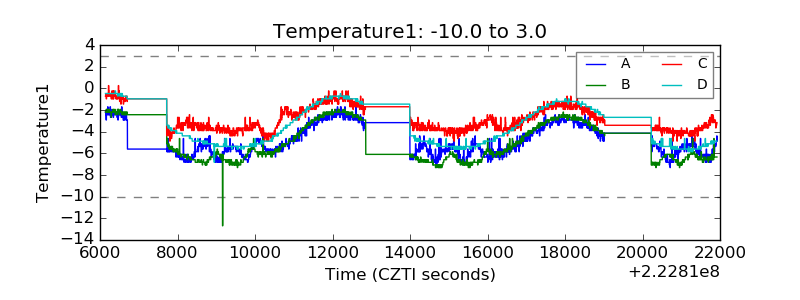 |
| Veto HV Monitor | 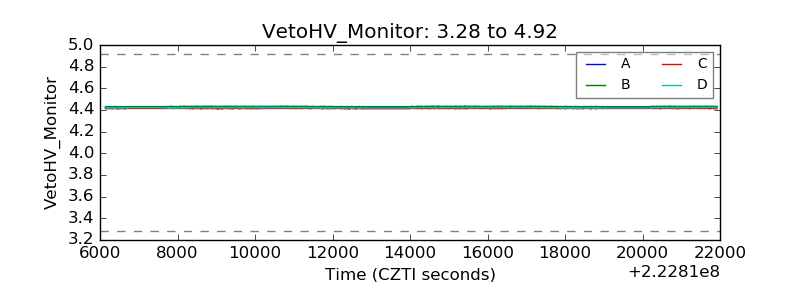 |
| Veto LLD | 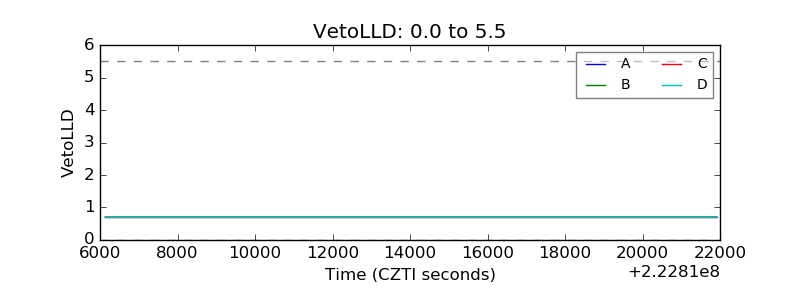 |
| Alpha Counter | 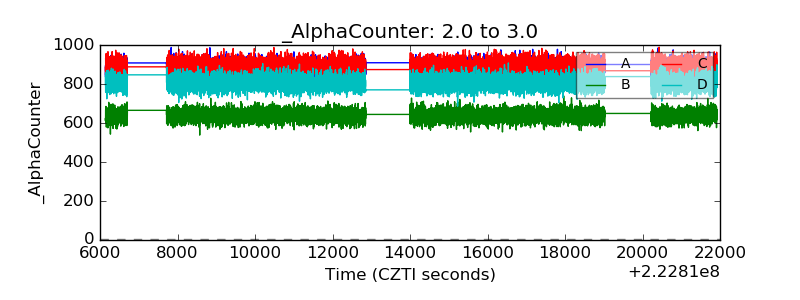 |
| _CPM_Rate | 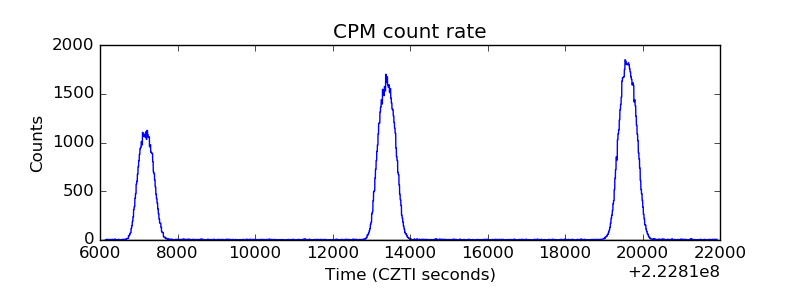 |
| CZT Counter | 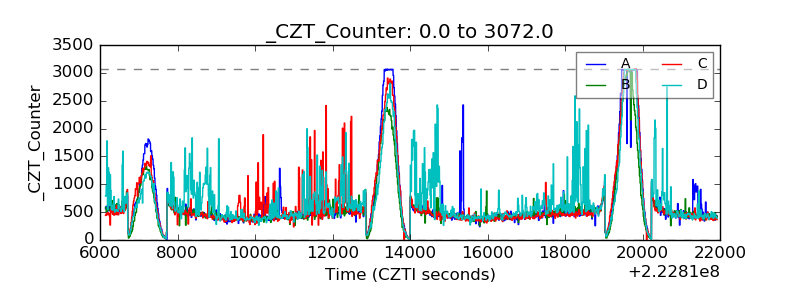 |
| +2.5 Volts monitor |  |
| +5 Volts monitor | 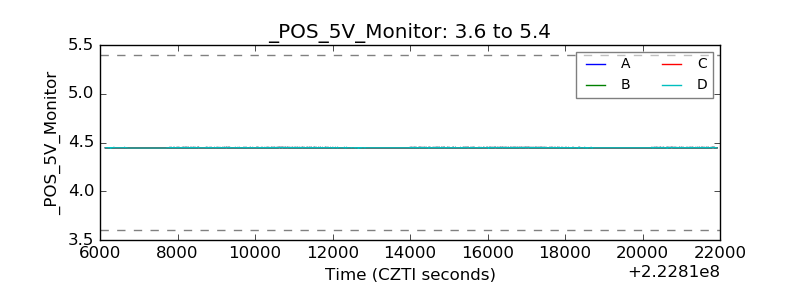 |
| _ROLL_ROT | 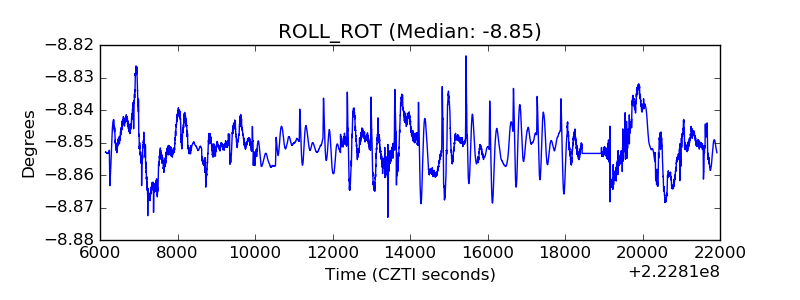 |
| _Roll_DEC | 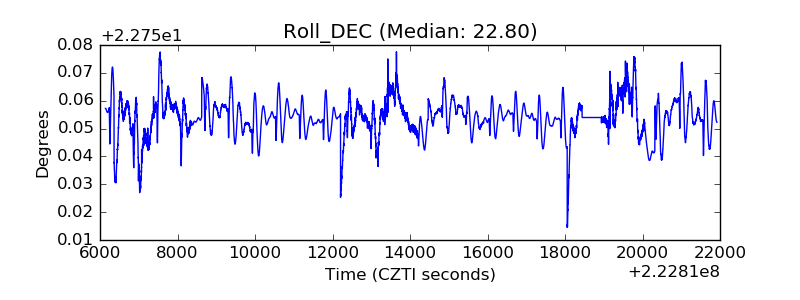 |
| _Roll_RA | 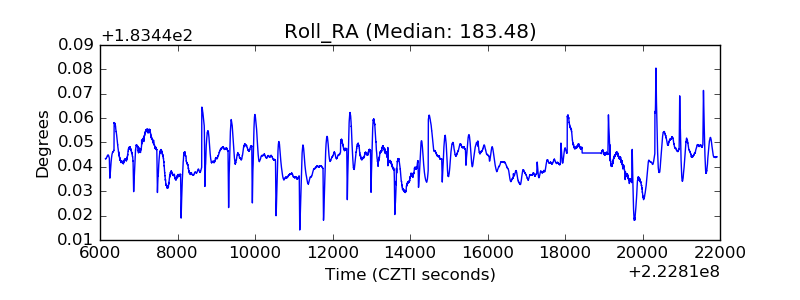 |
| Veto Counter | 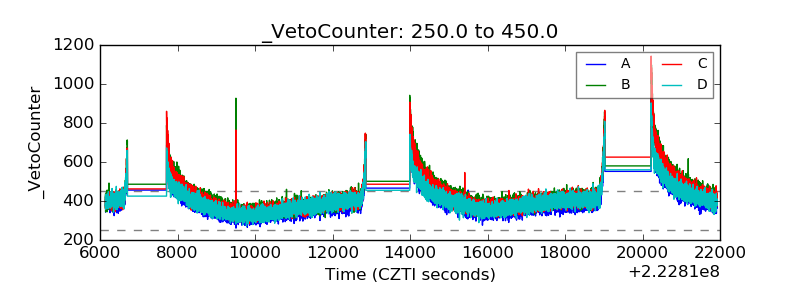 |