| Param | Original file | Final file |
|---|---|---|
| Filename | modeM0/AS1G06_029T02_9000000974_07150cztM0_level2.evt | modeM0/AS1G06_029T02_9000000974_07150cztM0_level2_quad_clean.evt |
| Size (bytes) | 441,288,000 | 84,254,400 |
| Size | 420.8 MB | 80.4 MB |
| Events in quadrant A | 2,993,221 | 529,610 |
| Events in quadrant B | 3,044,015 | 547,446 |
| Events in quadrant C | 2,994,486 | 534,564 |
| Events in quadrant D | 3,908,552 | 504,100 |
| Mode M9 | |||
|---|---|---|---|
| Quadrant | BADHDUFLAG | Total packets | Discarded packets |
| A | 0 | 13 | 0 |
| B | 0 | 13 | 0 |
| C | 0 | 13 | 0 |
| D | 0 | 13 | 0 |
| Mode SS | |||
|---|---|---|---|
| Quadrant | BADHDUFLAG | Total packets | Discarded packets |
| A | 0 | 128 | 0 |
| B | 0 | 128 | 0 |
| C | 0 | 128 | 0 |
| D | 0 | 128 | 0 |
| Mode M0 | |||
|---|---|---|---|
| Quadrant | BADHDUFLAG | Total packets | Discarded packets |
| A | 0 | 12938 | 2 |
| B | 0 | 12988 | 1 |
| C | 0 | 13139 | 1 |
| D | 0 | 15588 | 1 |
| Quadrant | Total seconds | Saturated seconds | Saturation percentage |
|---|---|---|---|
| A | 6237 | 97 | 1.555235% |
| B | 6237 | 62 | 0.994068% |
| C | 6237 | 51 | 0.817701% |
| D | 6237 | 108 | 1.731602% |
Noise dominated data is calculated using 1-second bins in cleaned event files. If a bin has >2000 counts, and if more than 50% of those come from <1% of pixels, then it is considered to be noise-dominated and hence unusable.
| Quadrant | # 1 sec bins | Bins with >0 counts | Bins with >2000 counts | High rate bins dominated by noise | Noise dominated (total time) | Noise dominated (detector-on time) | Marked lightcurve |
|---|---|---|---|---|---|---|---|
| A | 7512 | 6237 | 0 | 0 | 0.00% | 0.00% | 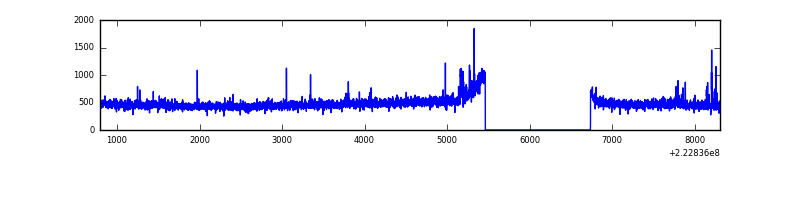 |
| B | 7512 | 6237 | 0 | 0 | 0.00% | 0.00% | 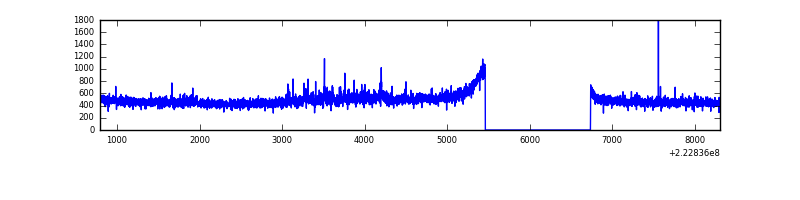 |
| C | 7512 | 6237 | 7 | 7 | 0.09% | 0.11% | 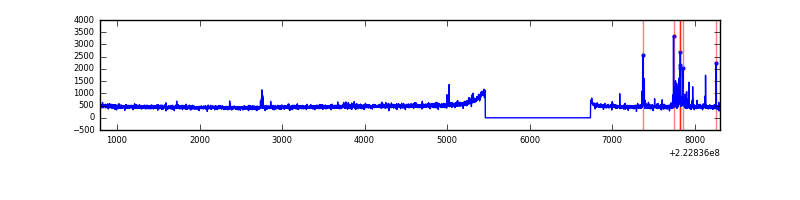 |
| D | 7512 | 6237 | 48 | 48 | 0.64% | 0.77% | 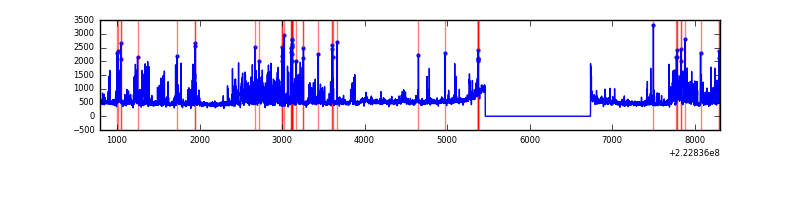 |
Top three noisy pixels from each quadrant. If the there are fewer than three noisy pixels in the level2.evt file, extra rows are filled as -1
| Pixel properties | Quadrant properties | ||||||
|---|---|---|---|---|---|---|---|
| Quadrant | DetID | PixID | Counts | Sigma | Mean | Median | Sigma |
| A | 14 | 111 | 46774 | 299.23 | 759 | 744 | 153.8 |
| A | 8 | 15 | 17683 | 110.12 | 759 | 744 | 153.8 |
| A | 0 | 226 | 7240 | 42.23 | 759 | 744 | 153.8 |
| B | 0 | 214 | 45869 | 311.83 | 765 | 750 | 144.7 |
| B | 0 | 219 | 21107 | 140.69 | 765 | 750 | 144.7 |
| B | 12 | 111 | 14677 | 96.25 | 765 | 750 | 144.7 |
| C | 4 | 254 | 104854 | 612.45 | 736 | 740 | 170.0 |
| C | 9 | 68 | 8878 | 47.87 | 736 | 740 | 170.0 |
| C | 10 | 22 | 7157 | 37.75 | 736 | 740 | 170.0 |
| D | 2 | 216 | 875457 | 4809.63 | 732 | 708 | 181.9 |
| D | 8 | 195 | 214580 | 1175.93 | 732 | 708 | 181.9 |
| D | 2 | 14 | 46973 | 254.38 | 732 | 708 | 181.9 |
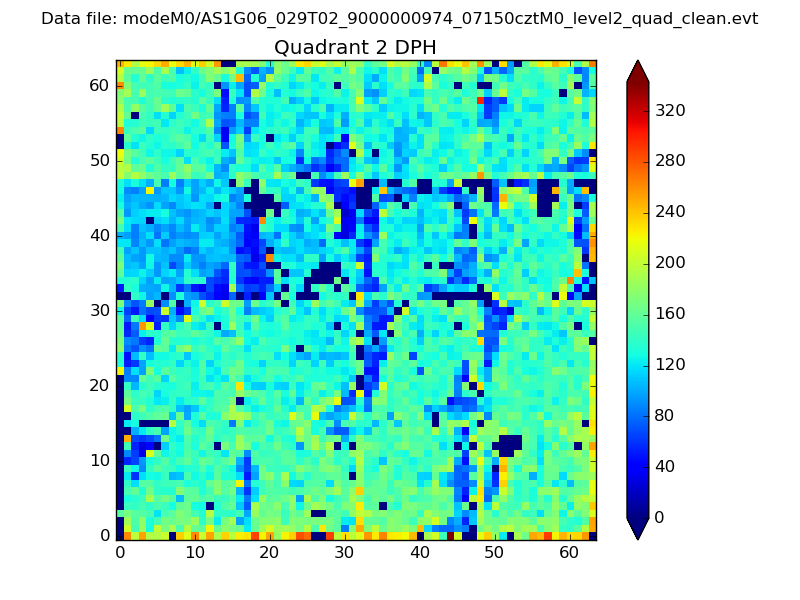
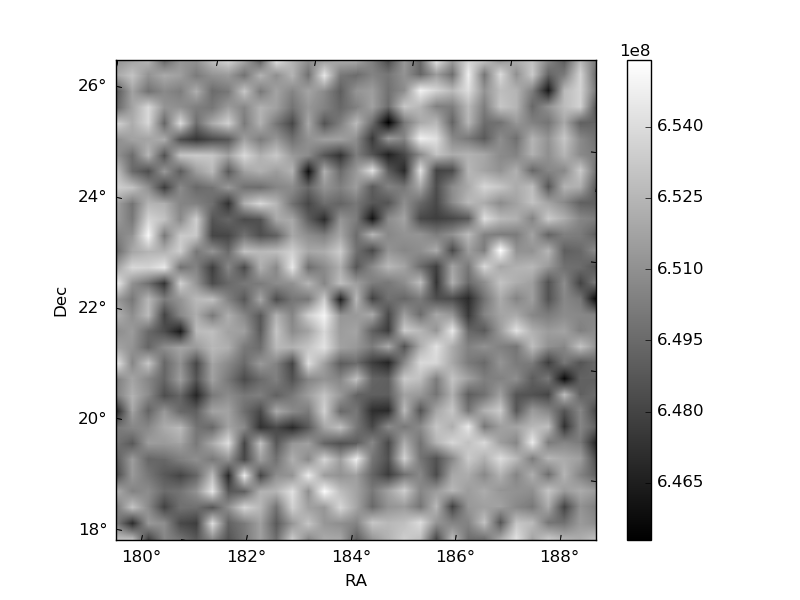
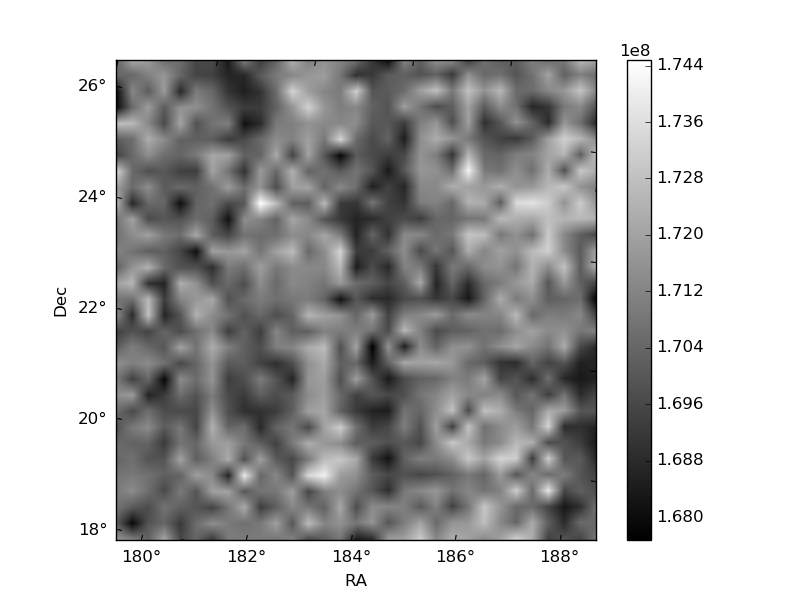
Histogram calculated using DETX and DETY for each event in the final _common_clean file
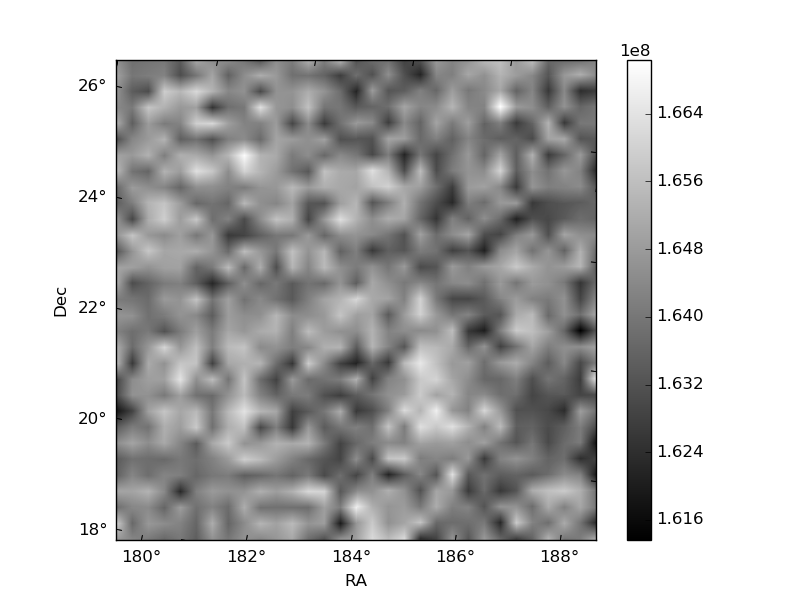
| Quadrant A | 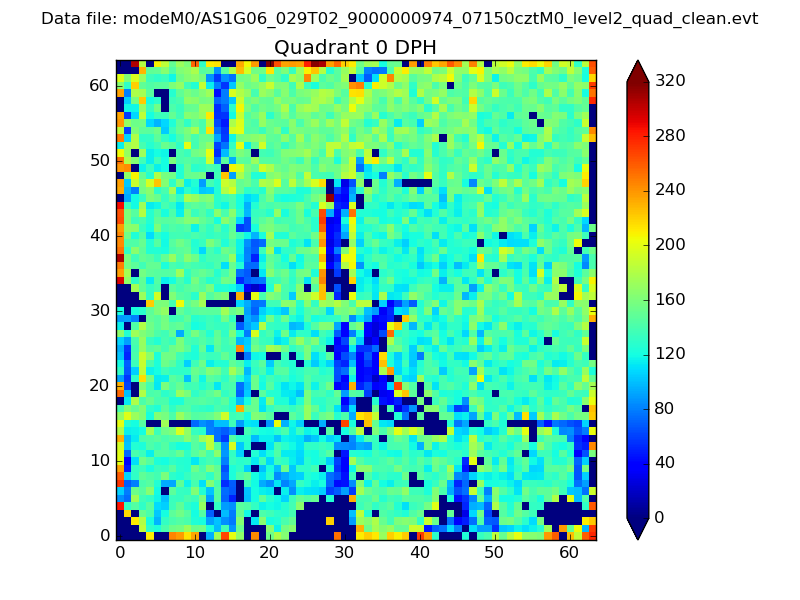 |
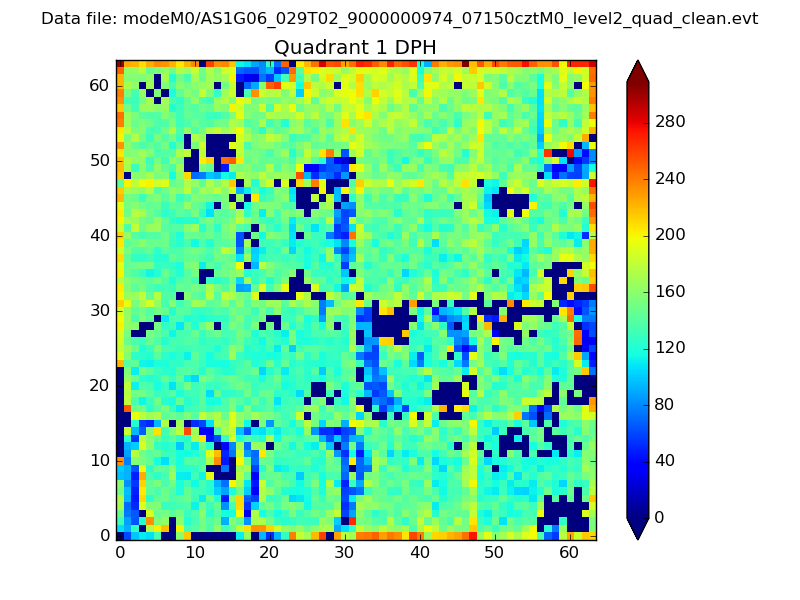 |
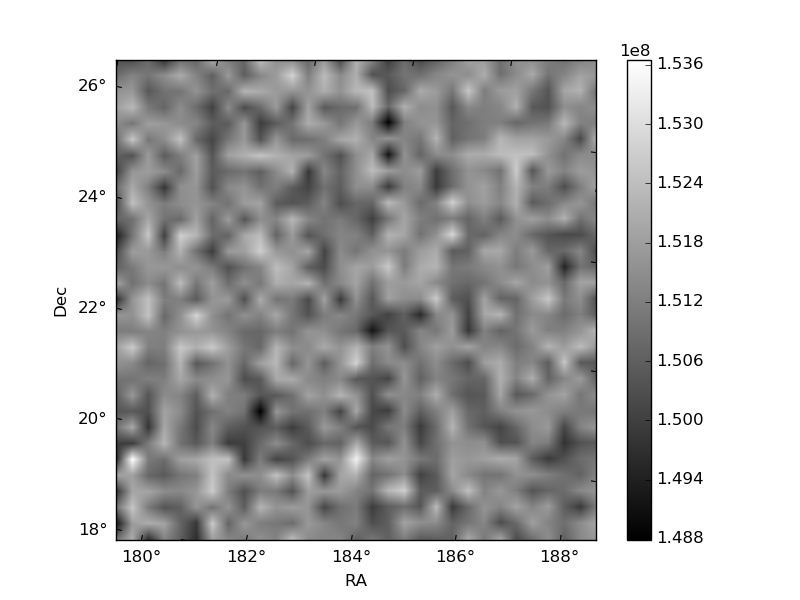
Quadrant B |
|---|---|---|---|
| Quadrant D | 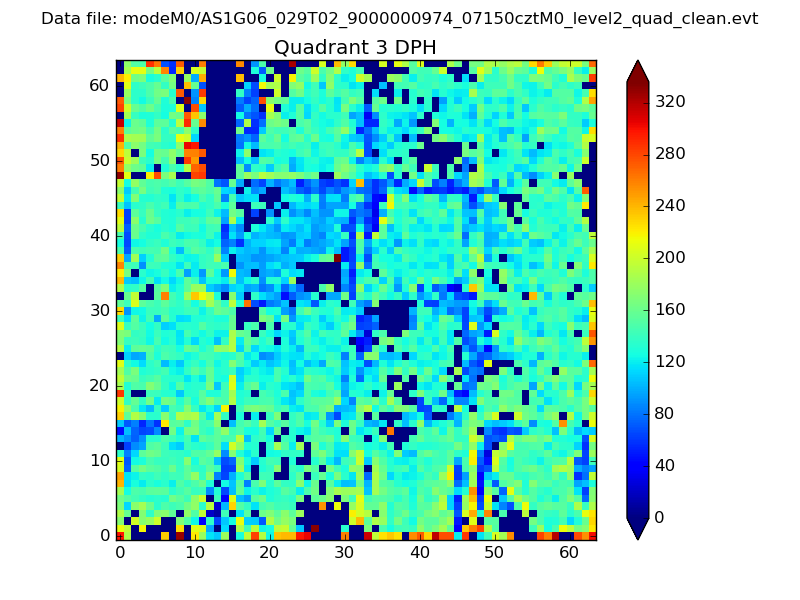 |
 |
Quadrant C |
| Plot type | Count rate plots | Images |
|---|---|---|
| Comparison with Poisson distribution Blue bars denote a histogram of data divided into 1 sec bins. Red curve is a Poisson curve with rate = median count rate of data. |
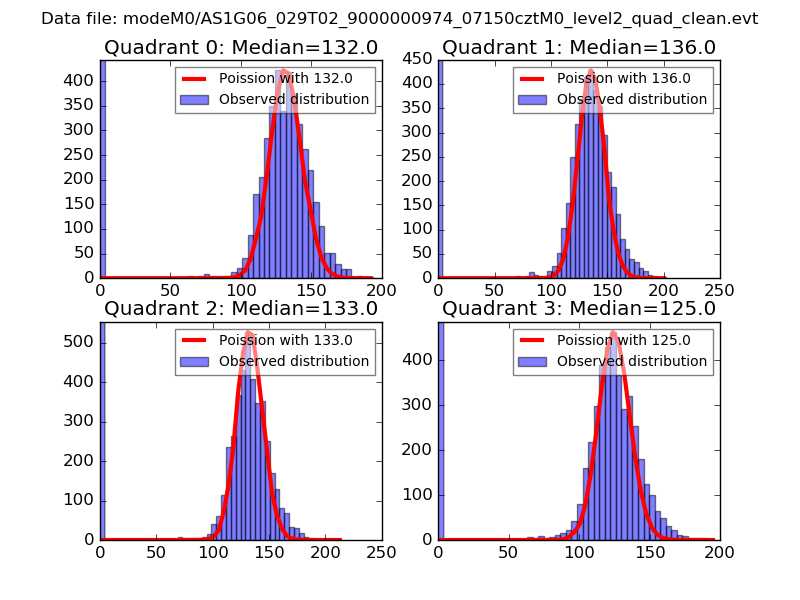 |
 |
| Quadrant-wise count rates Data is divided into 100 sec bins |
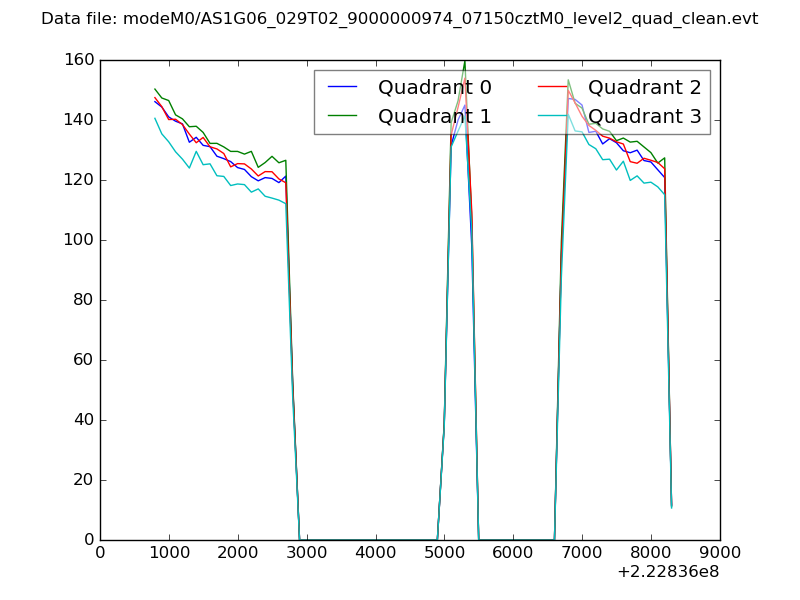 |
|
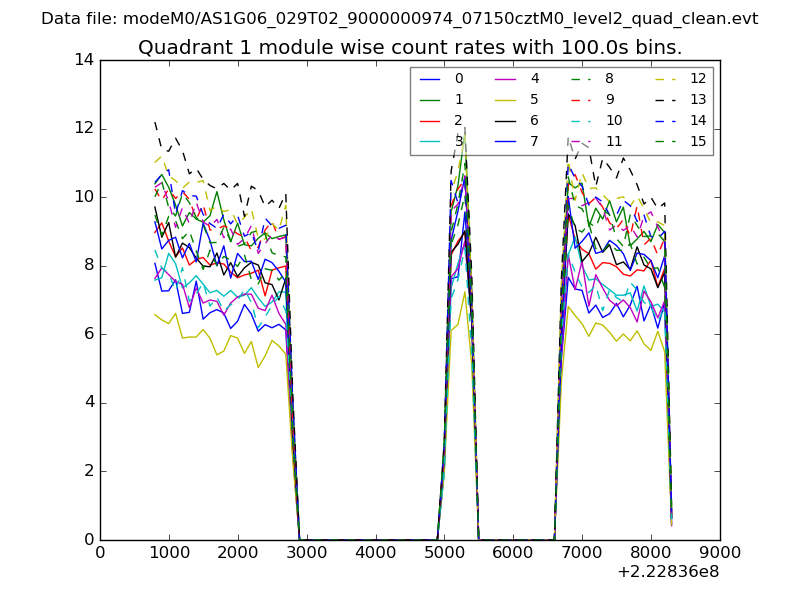
| Module-wise count rates for Quadrant A Data is divided into 100 sec bins |
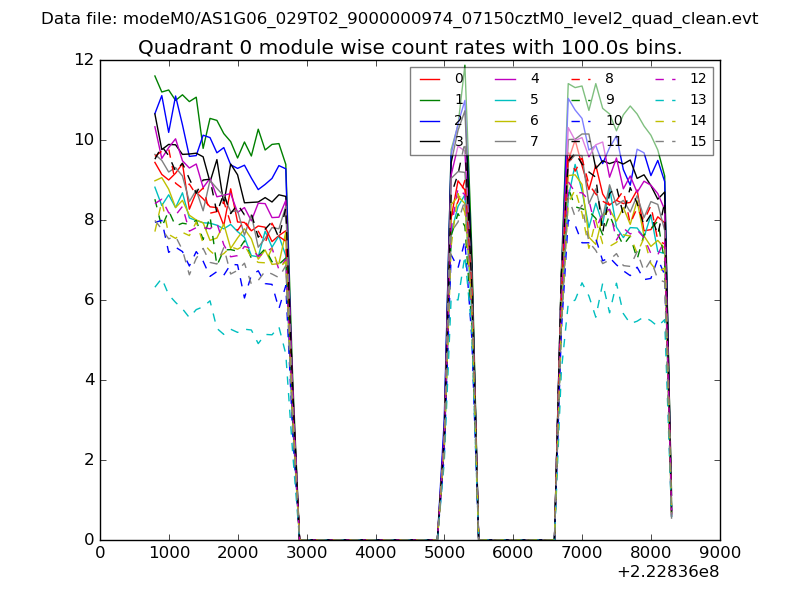 |
 |
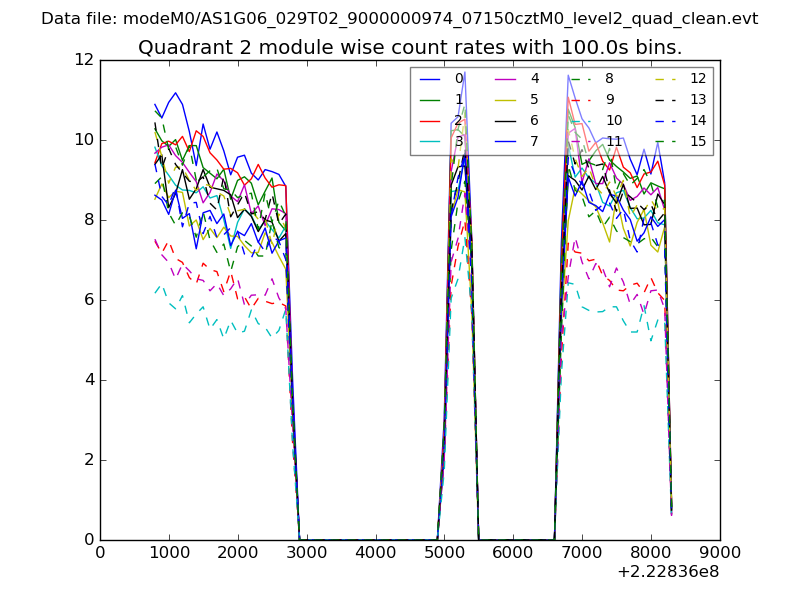
| Module-wise count rates for Quadrant B Data is divided into 100 sec bins |
 |
 |
| Module-wise count rates for Quadrant C Data is divided into 100 sec bins |
 |
 |
| Module-wise count rates for Quadrant D Data is divided into 100 sec bins |
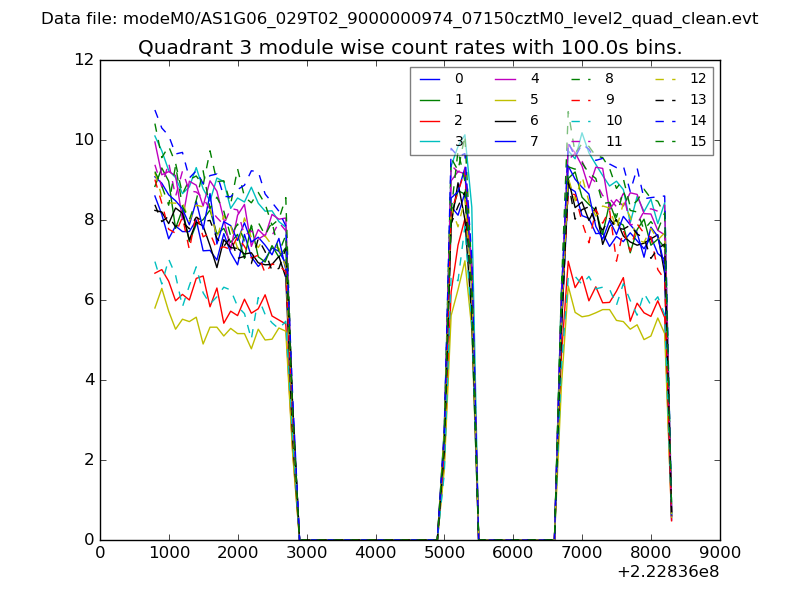 |
 |
| Parameter | Plot |
|---|---|
| CZT HV Monitor | 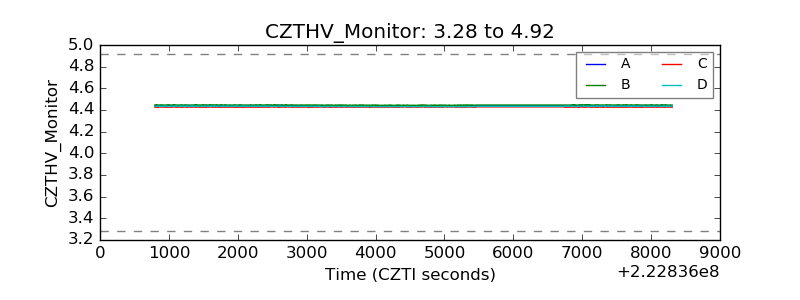 |
| D_VDD | 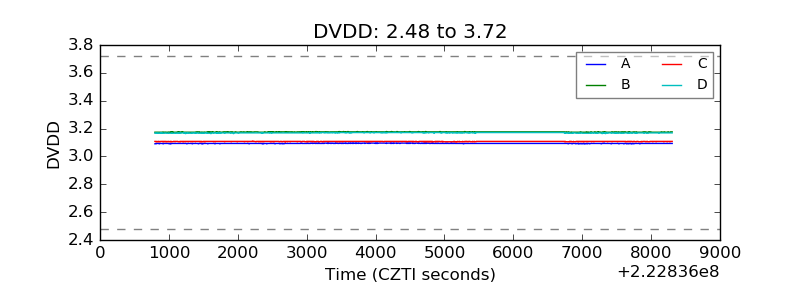 |
| Temperature 1 | 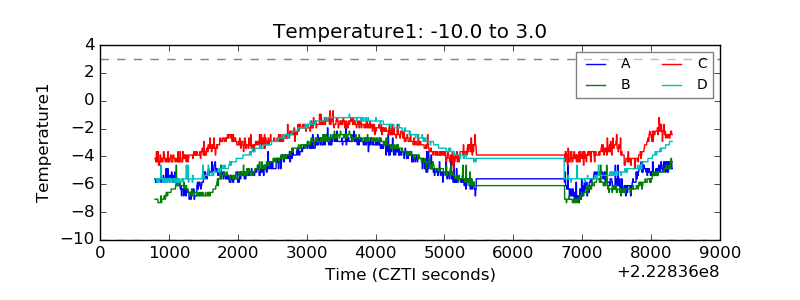 |
| Veto HV Monitor | 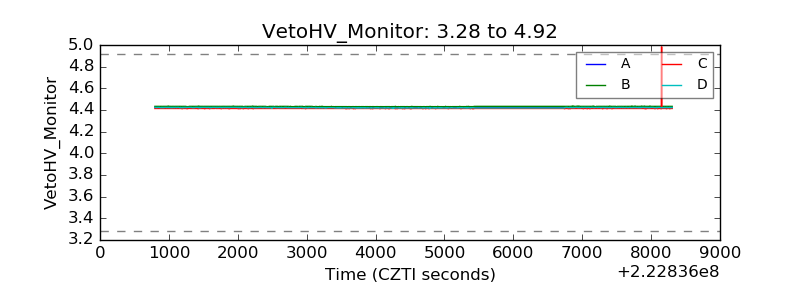 |
| Veto LLD | 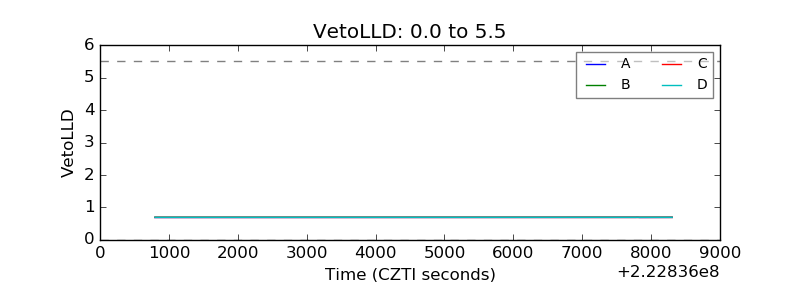 |
| Alpha Counter | 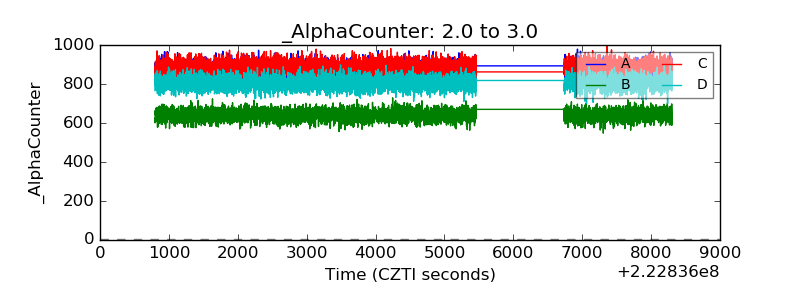 |
| _CPM_Rate | 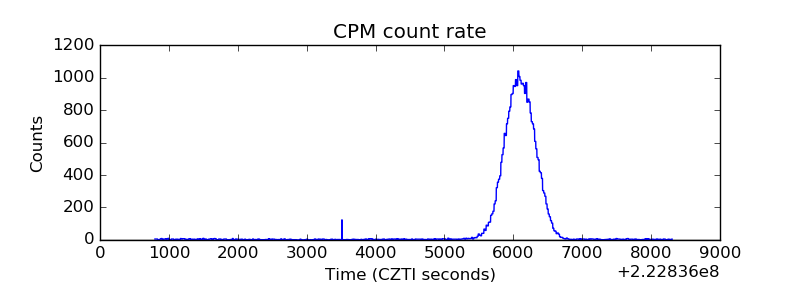 |
| CZT Counter | 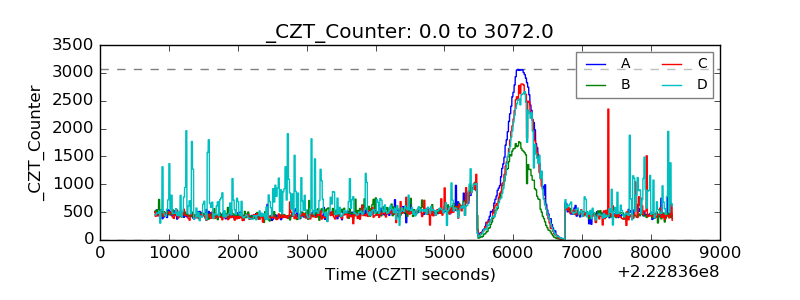 |
| +2.5 Volts monitor |  |
| +5 Volts monitor |  |
| _ROLL_ROT | 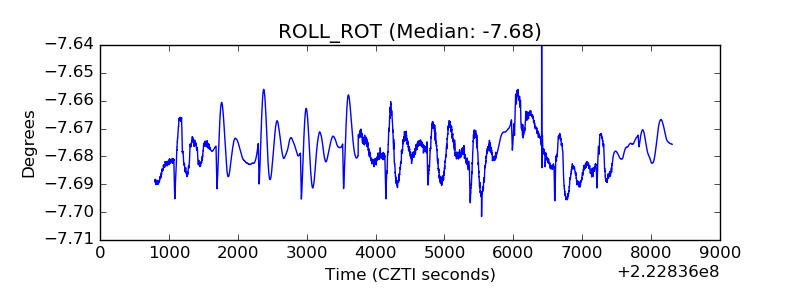 |
| _Roll_DEC | 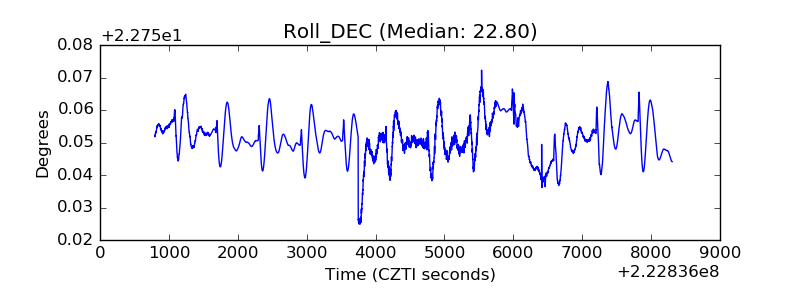 |
| _Roll_RA | 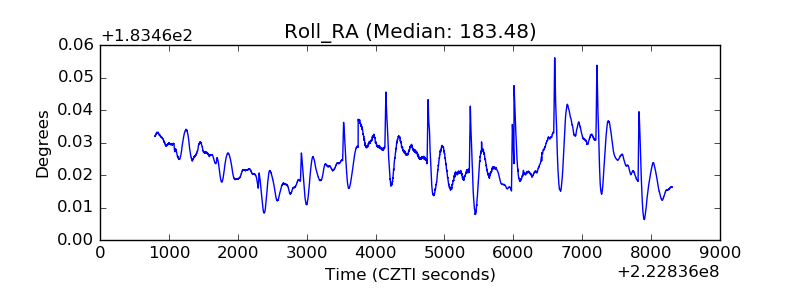 |
| Veto Counter | 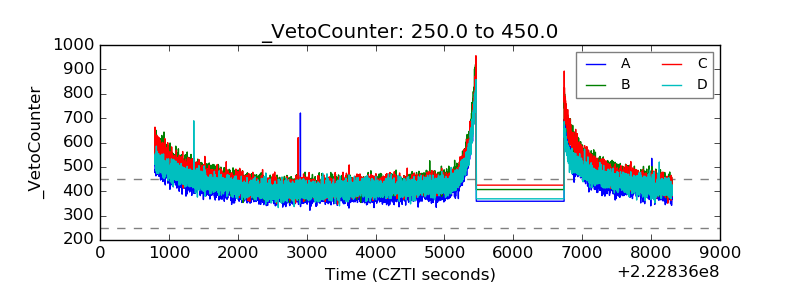 |