| Param | Original file | Final file |
|---|---|---|
| Filename | modeM0/AS1G06_029T02_9000000974_07151cztM0_level2.evt | modeM0/AS1G06_029T02_9000000974_07151cztM0_level2_quad_clean.evt |
| Size (bytes) | 405,527,040 | 75,070,080 |
| Size | 386.7 MB | 71.6 MB |
| Events in quadrant A | 2,834,683 | 466,844 |
| Events in quadrant B | 2,882,490 | 479,216 |
| Events in quadrant C | 2,802,240 | 470,353 |
| Events in quadrant D | 3,363,554 | 447,198 |
| Mode M9 | |||
|---|---|---|---|
| Quadrant | BADHDUFLAG | Total packets | Discarded packets |
| A | 0 | 12 | 0 |
| B | 0 | 12 | 0 |
| C | 0 | 12 | 0 |
| D | 0 | 12 | 0 |
| Mode SS | |||
|---|---|---|---|
| Quadrant | BADHDUFLAG | Total packets | Discarded packets |
| A | 0 | 118 | 0 |
| B | 0 | 118 | 0 |
| C | 0 | 118 | 0 |
| D | 0 | 118 | 0 |
| Mode M0 | |||
|---|---|---|---|
| Quadrant | BADHDUFLAG | Total packets | Discarded packets |
| A | 0 | 12215 | 2 |
| B | 0 | 12304 | 1 |
| C | 0 | 12325 | 1 |
| D | 0 | 13694 | 1 |
| Quadrant | Total seconds | Saturated seconds | Saturation percentage |
|---|---|---|---|
| A | 5863 | 82 | 1.398601% |
| B | 5863 | 63 | 1.074535% |
| C | 5863 | 37 | 0.631076% |
| D | 5863 | 90 | 1.535050% |
Noise dominated data is calculated using 1-second bins in cleaned event files. If a bin has >2000 counts, and if more than 50% of those come from <1% of pixels, then it is considered to be noise-dominated and hence unusable.
| Quadrant | # 1 sec bins | Bins with >0 counts | Bins with >2000 counts | High rate bins dominated by noise | Noise dominated (total time) | Noise dominated (detector-on time) | Marked lightcurve |
|---|---|---|---|---|---|---|---|
| A | 7033 | 5863 | 0 | 0 | 0.00% | 0.00% | 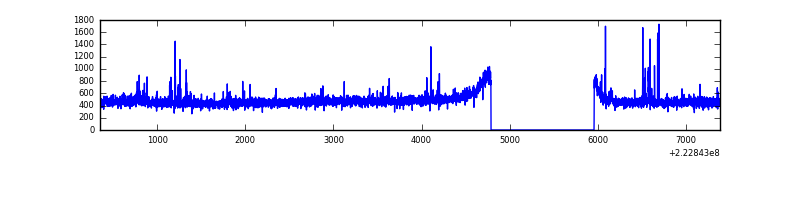 |
| B | 7033 | 5863 | 0 | 0 | 0.00% | 0.00% | 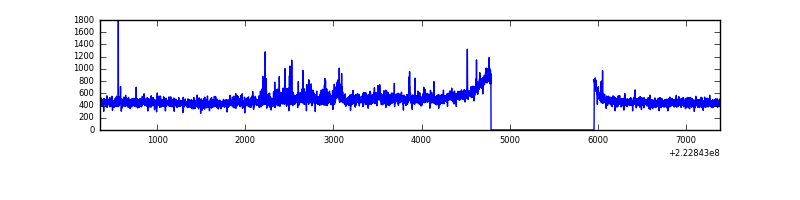 |
| C | 7033 | 5864 | 7 | 7 | 0.10% | 0.12% | 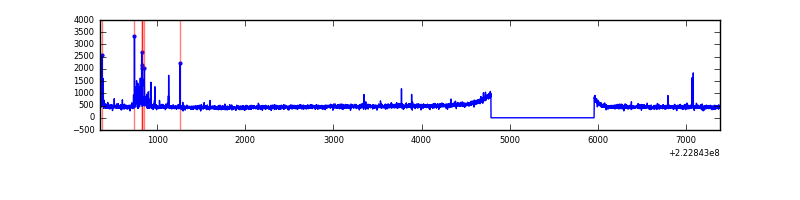 |
| D | 7033 | 5864 | 33 | 33 | 0.47% | 0.56% | 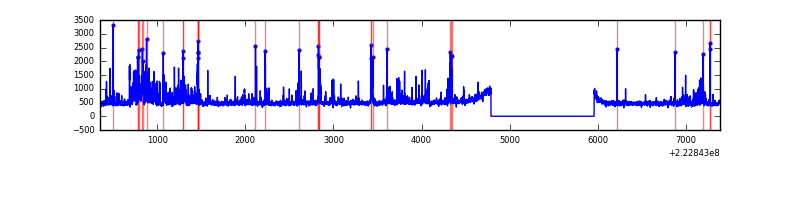 |
Top three noisy pixels from each quadrant. If the there are fewer than three noisy pixels in the level2.evt file, extra rows are filled as -1
| Pixel properties | Quadrant properties | ||||||
|---|---|---|---|---|---|---|---|
| Quadrant | DetID | PixID | Counts | Sigma | Mean | Median | Sigma |
| A | 13 | 248 | 40527 | 272.73 | 714 | 698 | 146.0 |
| A | 14 | 111 | 33085 | 221.77 | 714 | 698 | 146.0 |
| A | 8 | 15 | 10991 | 70.48 | 714 | 698 | 146.0 |
| B | 0 | 214 | 49980 | 361.07 | 713 | 697 | 136.5 |
| B | 0 | 219 | 39139 | 281.65 | 713 | 697 | 136.5 |
| B | 4 | 81 | 15208 | 106.32 | 713 | 697 | 136.5 |
| C | 4 | 254 | 105811 | 658.8 | 688 | 692 | 159.6 |
| C | 12 | 4 | 5682 | 31.27 | 688 | 692 | 159.6 |
| C | 13 | 61 | 5448 | 29.81 | 688 | 692 | 159.6 |
| D | 2 | 216 | 485523 | 2840.83 | 691 | 669 | 170.7 |
| D | 8 | 195 | 194527 | 1135.84 | 691 | 669 | 170.7 |
| D | 2 | 136 | 49987 | 288.96 | 691 | 669 | 170.7 |
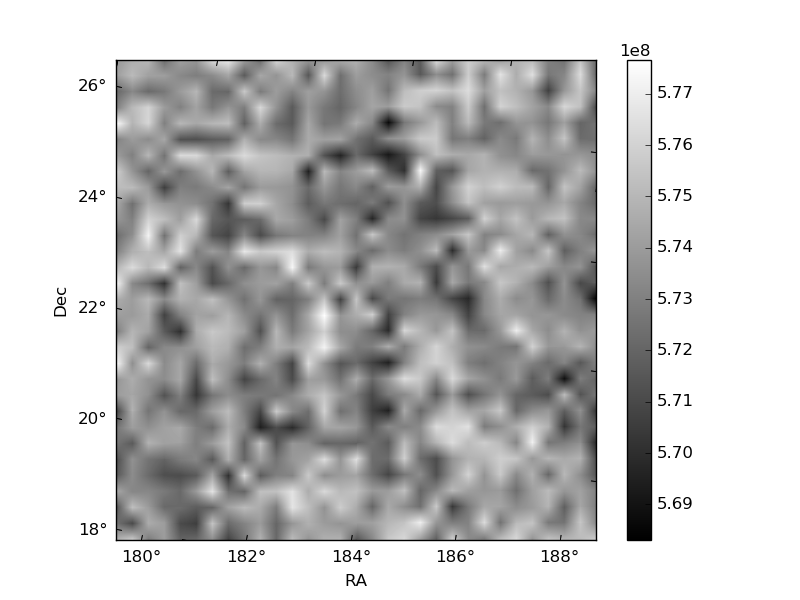
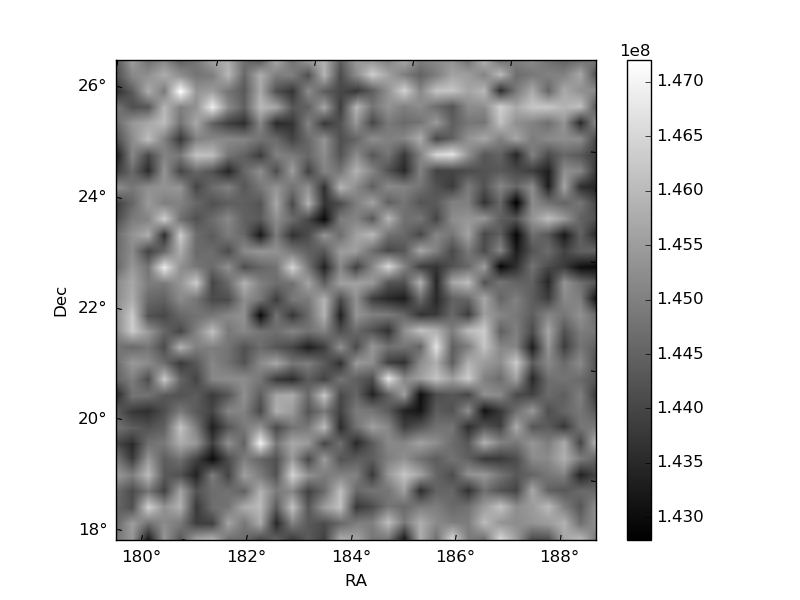
Histogram calculated using DETX and DETY for each event in the final _common_clean file
| Quadrant A | 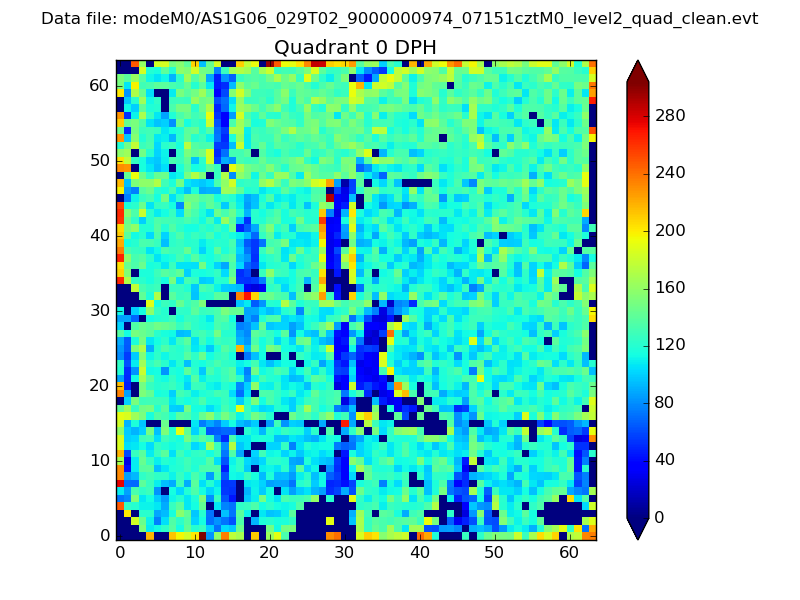 |
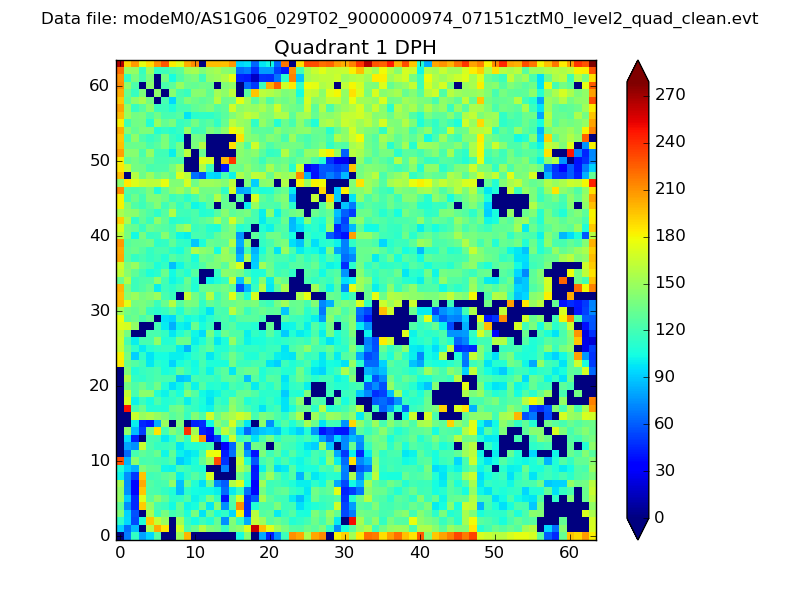 |
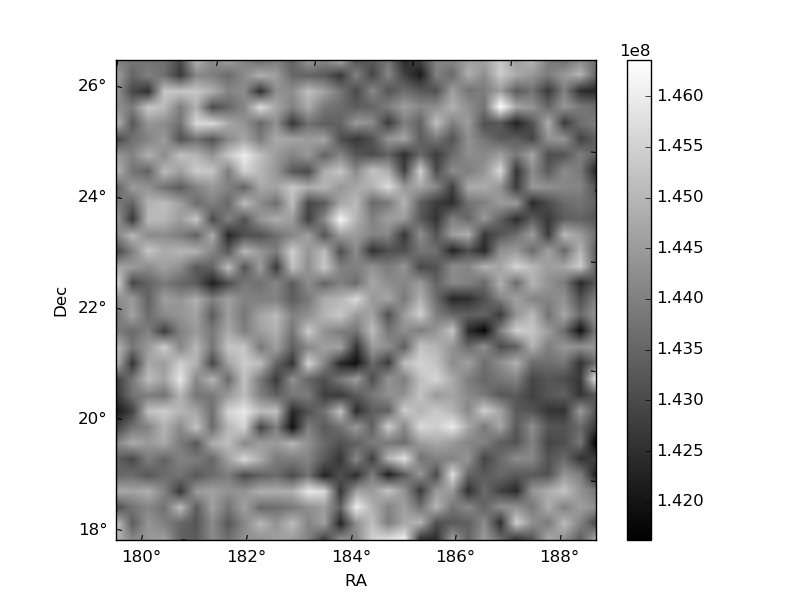
Quadrant B |
|---|---|---|---|
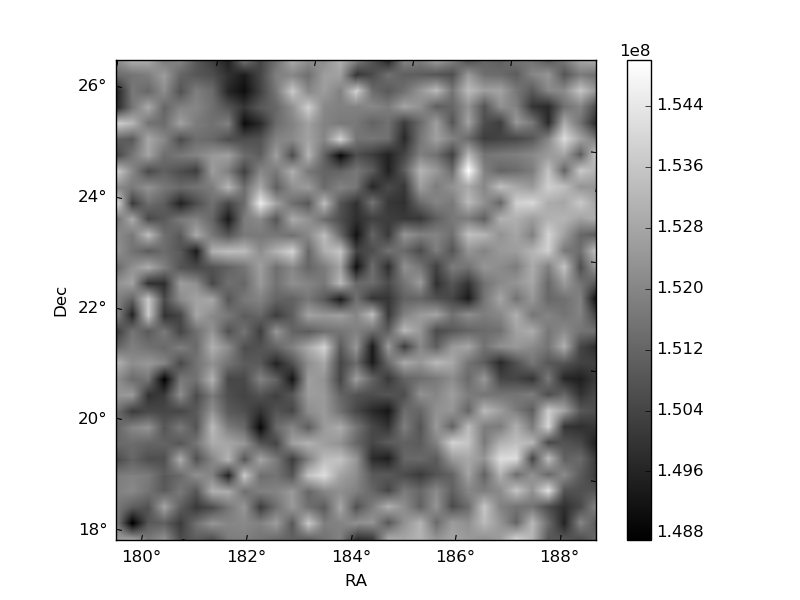
| Quadrant D | 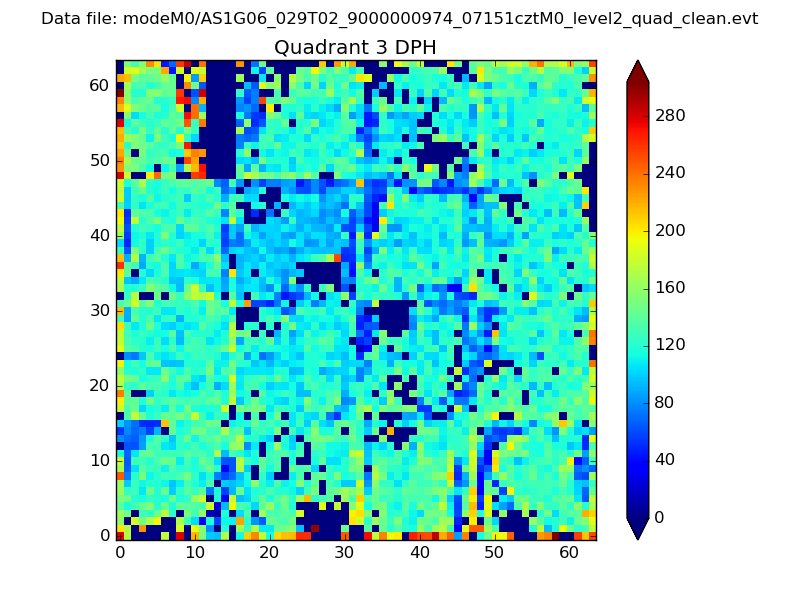 |
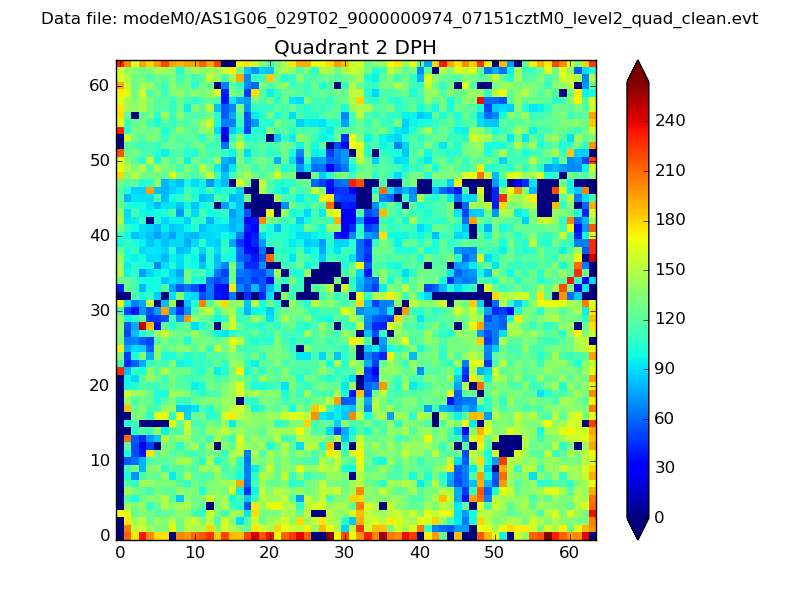 |
Quadrant C |
| Plot type | Count rate plots | Images |
|---|---|---|
| Comparison with Poisson distribution Blue bars denote a histogram of data divided into 1 sec bins. Red curve is a Poisson curve with rate = median count rate of data. |
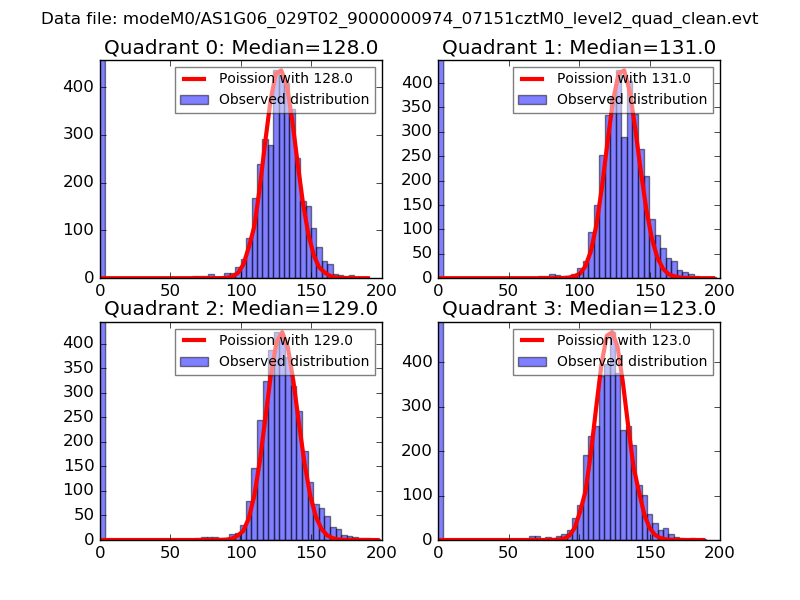 |
 |
| Quadrant-wise count rates Data is divided into 100 sec bins |
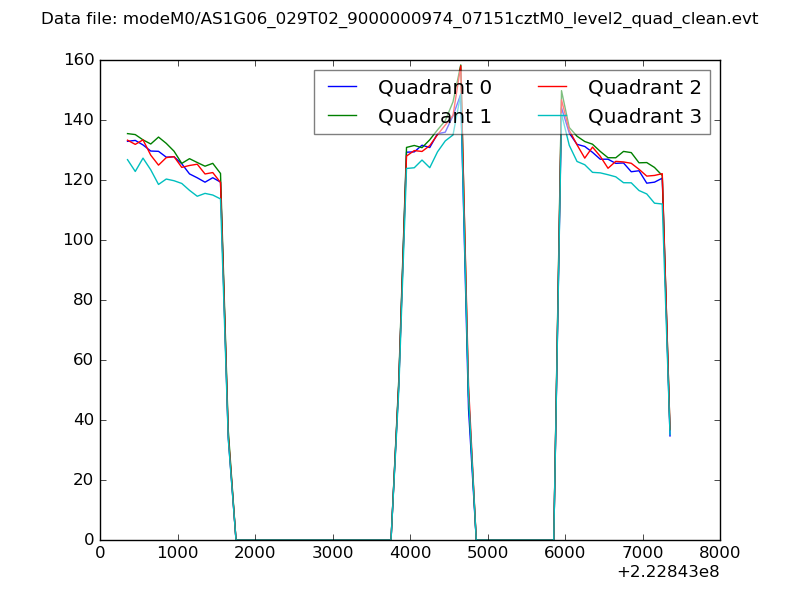 |
|
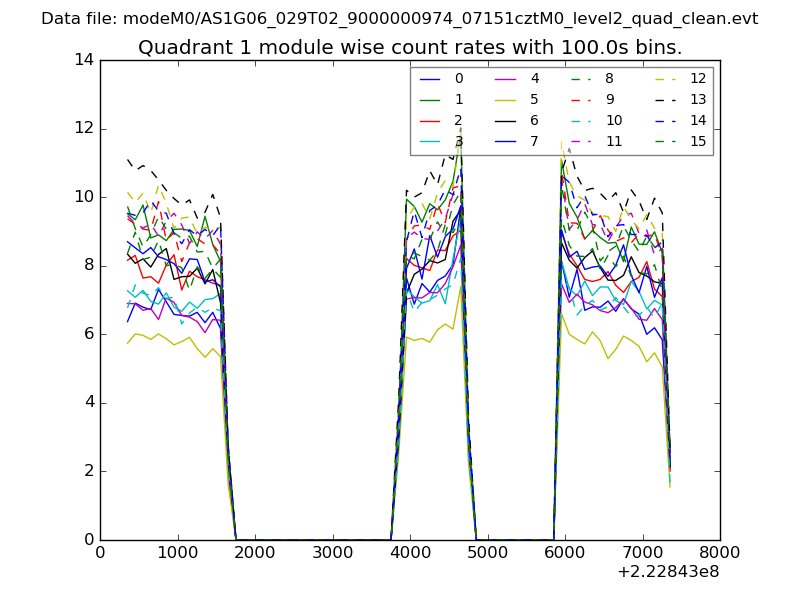
| Module-wise count rates for Quadrant A Data is divided into 100 sec bins |
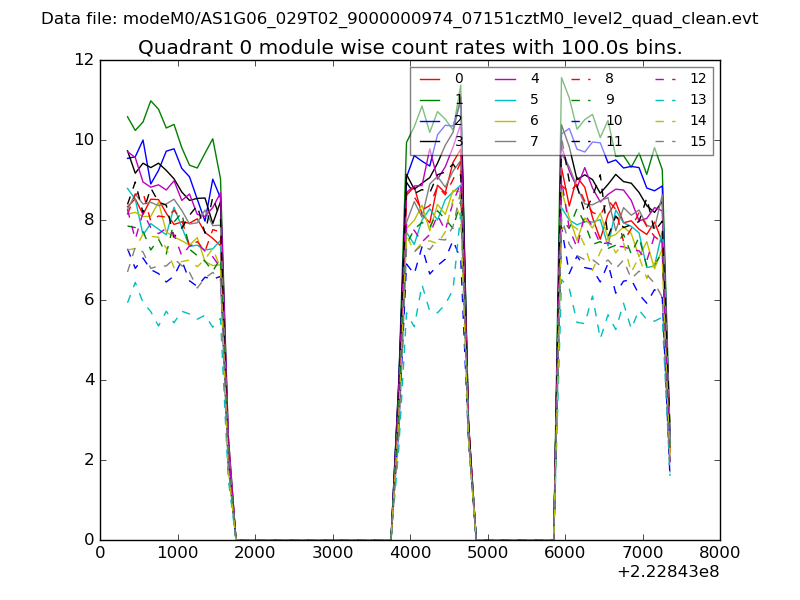 |
 |
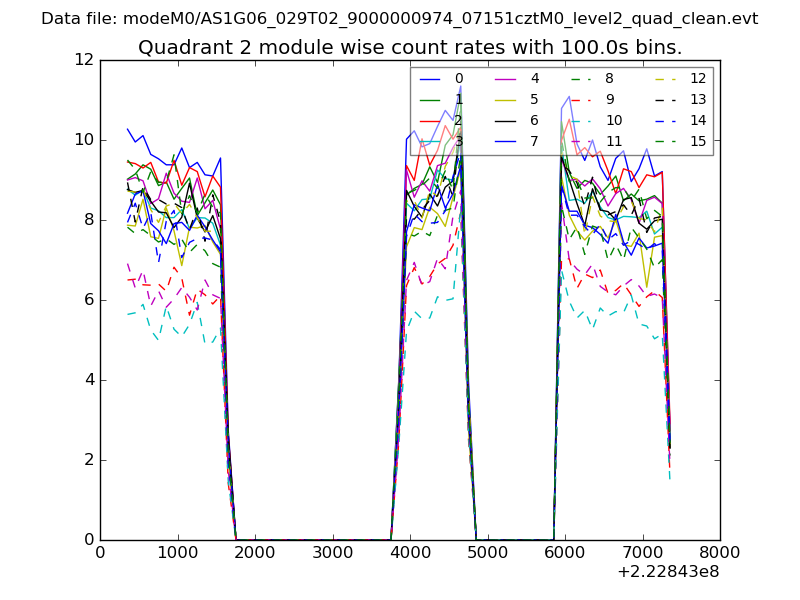
| Module-wise count rates for Quadrant B Data is divided into 100 sec bins |
 |
 |
| Module-wise count rates for Quadrant C Data is divided into 100 sec bins |
 |
 |
| Module-wise count rates for Quadrant D Data is divided into 100 sec bins |
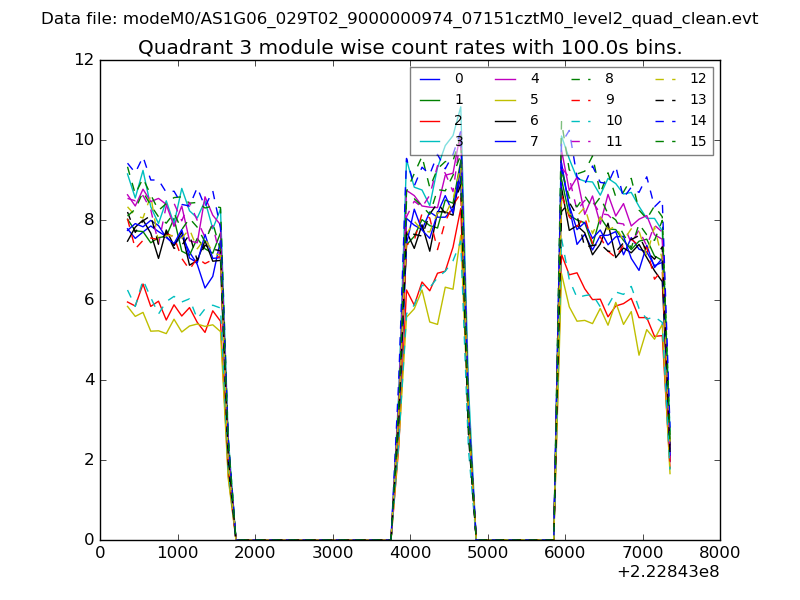 |
 |
| Parameter | Plot |
|---|---|
| CZT HV Monitor | 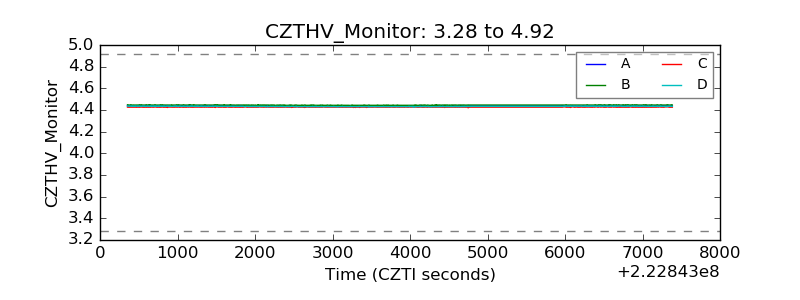 |
| D_VDD | 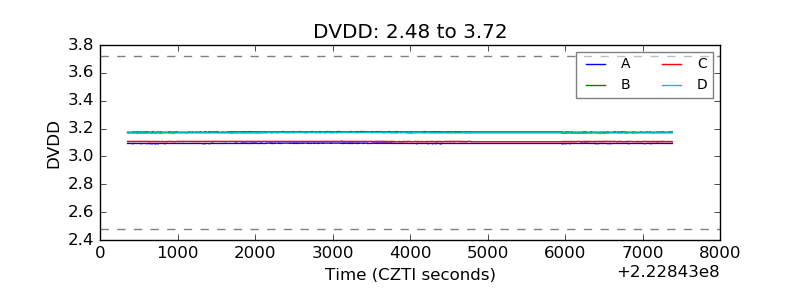 |
| Temperature 1 | 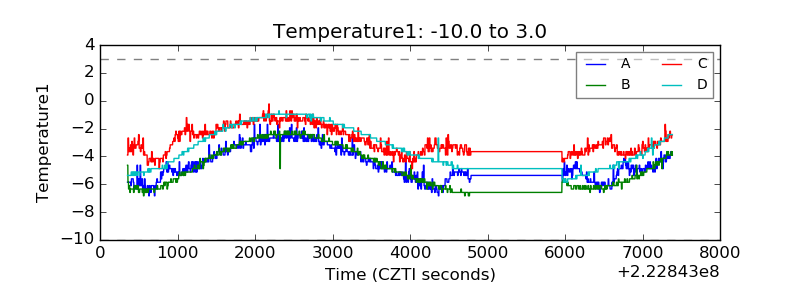 |
| Veto HV Monitor | 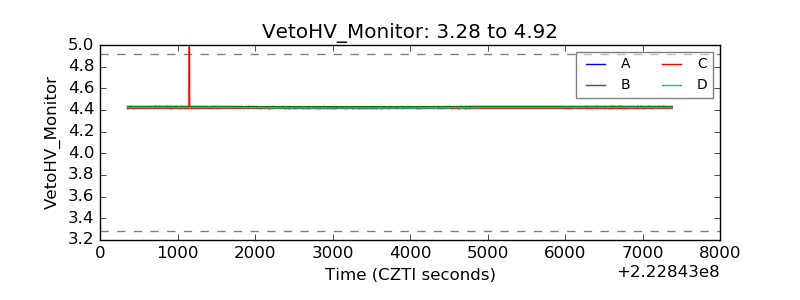 |
| Veto LLD |  |
| Alpha Counter | 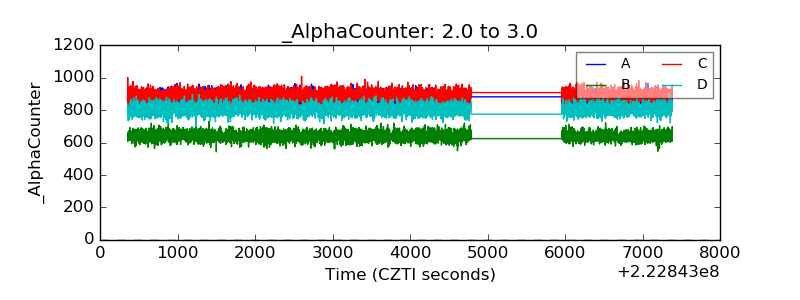 |
| _CPM_Rate | 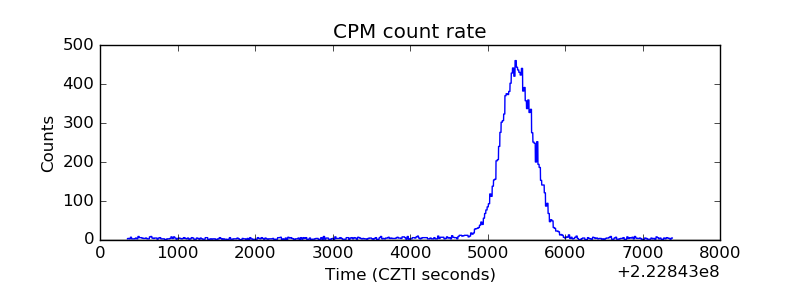 |
| CZT Counter | 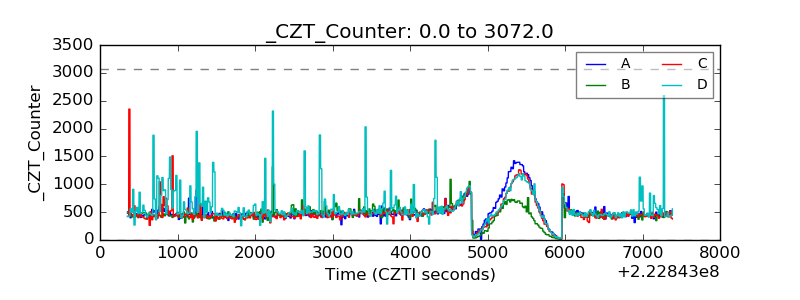 |
| +2.5 Volts monitor |  |
| +5 Volts monitor | 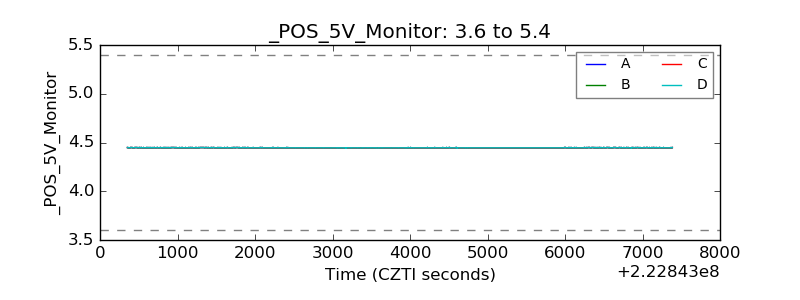 |
| _ROLL_ROT | 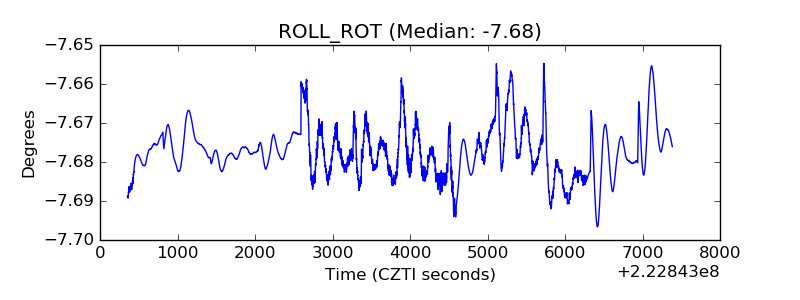 |
| _Roll_DEC | 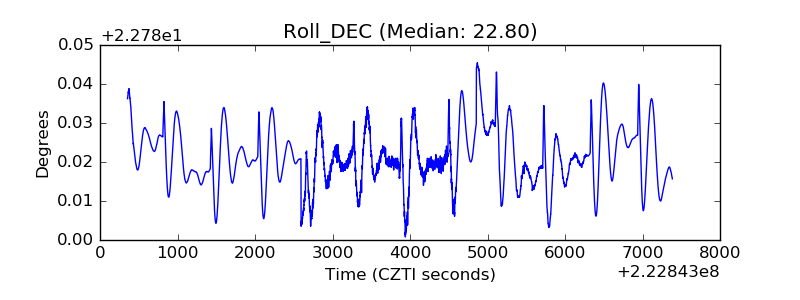 |
| _Roll_RA | 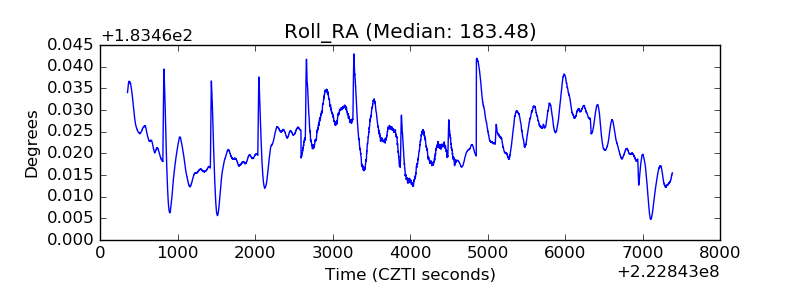 |
| Veto Counter | 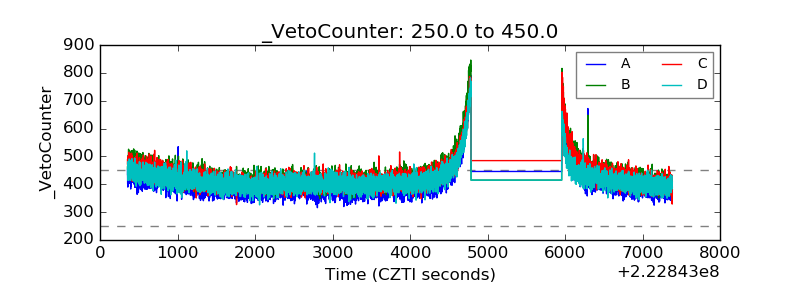 |