| Param | Original file | Final file |
|---|---|---|
| Filename | modeM0/AS1G06_029T02_9000000974_07152cztM0_level2.evt | modeM0/AS1G06_029T02_9000000974_07152cztM0_level2_quad_clean.evt |
| Size (bytes) | 475,534,080 | 85,893,120 |
| Size | 453.5 MB | 81.9 MB |
| Events in quadrant A | 3,332,152 | 535,563 |
| Events in quadrant B | 3,363,822 | 548,644 |
| Events in quadrant C | 3,116,053 | 540,715 |
| Events in quadrant D | 4,134,013 | 508,631 |
| Mode M9 | |||
|---|---|---|---|
| Quadrant | BADHDUFLAG | Total packets | Discarded packets |
| A | 0 | 14 | 0 |
| B | 0 | 14 | 0 |
| C | 0 | 14 | 0 |
| D | 0 | 15 | 0 |
| Mode SS | |||
|---|---|---|---|
| Quadrant | BADHDUFLAG | Total packets | Discarded packets |
| A | 0 | 134 | 0 |
| B | 0 | 134 | 0 |
| C | 0 | 134 | 0 |
| D | 0 | 134 | 0 |
| Mode M0 | |||
|---|---|---|---|
| Quadrant | BADHDUFLAG | Total packets | Discarded packets |
| A | 0 | 14377 | 3 |
| B | 0 | 14281 | 2 |
| C | 0 | 13890 | 2 |
| D | 0 | 16521 | 2 |
| Quadrant | Total seconds | Saturated seconds | Saturation percentage |
|---|---|---|---|
| A | 6711 | 273 | 4.067948% |
| B | 6711 | 129 | 1.922217% |
| C | 6711 | 76 | 1.132469% |
| D | 6711 | 262 | 3.904038% |
Noise dominated data is calculated using 1-second bins in cleaned event files. If a bin has >2000 counts, and if more than 50% of those come from <1% of pixels, then it is considered to be noise-dominated and hence unusable.
| Quadrant | # 1 sec bins | Bins with >0 counts | Bins with >2000 counts | High rate bins dominated by noise | Noise dominated (total time) | Noise dominated (detector-on time) | Marked lightcurve |
|---|---|---|---|---|---|---|---|
| A | 7615 | 6710 | 45 | 45 | 0.59% | 0.67% | 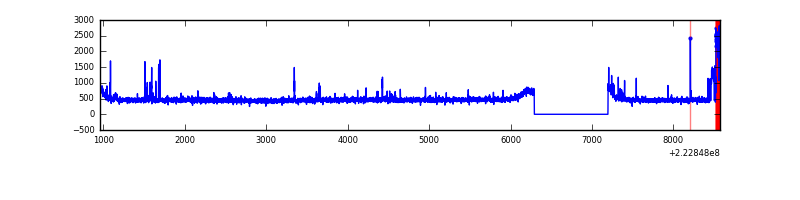 |
| B | 7616 | 6711 | 5 | 5 | 0.07% | 0.07% | 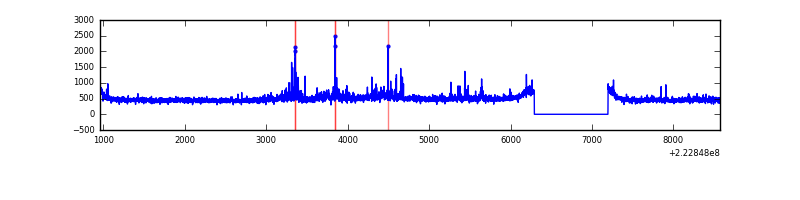 |
| C | 7616 | 6711 | 4 | 4 | 0.05% | 0.06% | 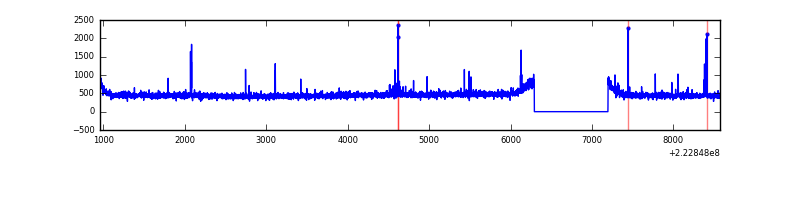 |
| D | 7616 | 6711 | 141 | 141 | 1.85% | 2.10% | 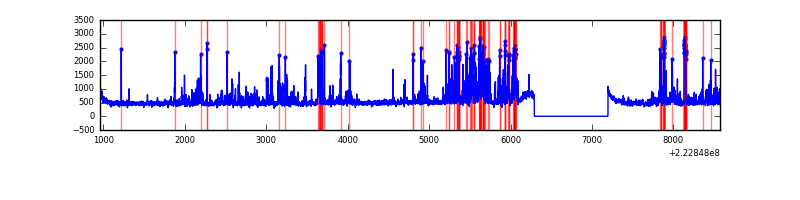 |
Top three noisy pixels from each quadrant. If the there are fewer than three noisy pixels in the level2.evt file, extra rows are filled as -1
| Pixel properties | Quadrant properties | ||||||
|---|---|---|---|---|---|---|---|
| Quadrant | DetID | PixID | Counts | Sigma | Mean | Median | Sigma |
| A | 14 | 111 | 209439 | 1280.07 | 797 | 776 | 163.0 |
| A | 13 | 248 | 34548 | 207.18 | 797 | 776 | 163.0 |
| A | 3 | 1 | 19791 | 116.65 | 797 | 776 | 163.0 |
| B | 3 | 220 | 88902 | 569.42 | 804 | 784 | 154.7 |
| B | 4 | 81 | 80650 | 516.1 | 804 | 784 | 154.7 |
| B | 0 | 214 | 47954 | 304.82 | 804 | 784 | 154.7 |
| C | 4 | 254 | 52299 | 287.03 | 777 | 780 | 179.5 |
| C | 10 | 22 | 24446 | 131.85 | 777 | 780 | 179.5 |
| C | 13 | 61 | 6047 | 29.34 | 777 | 780 | 179.5 |
| D | 2 | 216 | 563492 | 2927.48 | 774 | 747 | 192.2 |
| D | 8 | 195 | 277803 | 1441.28 | 774 | 747 | 192.2 |
| D | 2 | 14 | 157382 | 814.84 | 774 | 747 | 192.2 |
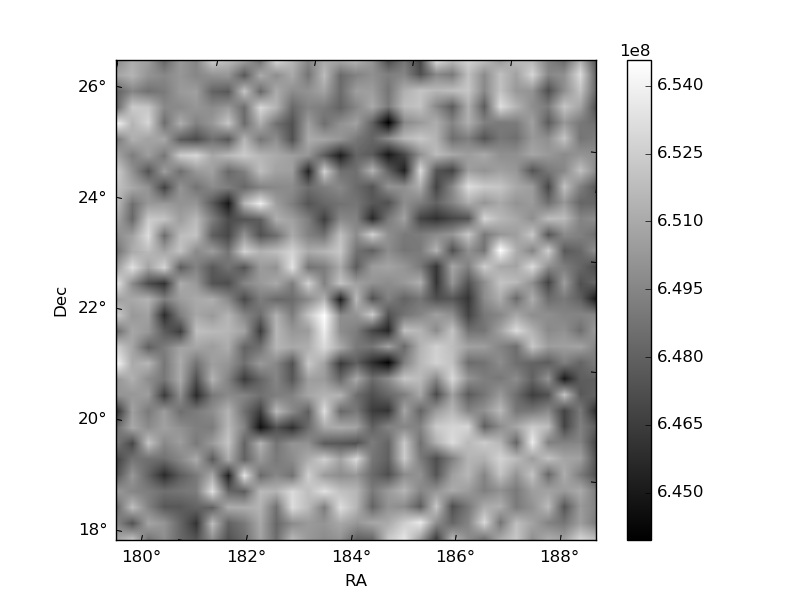
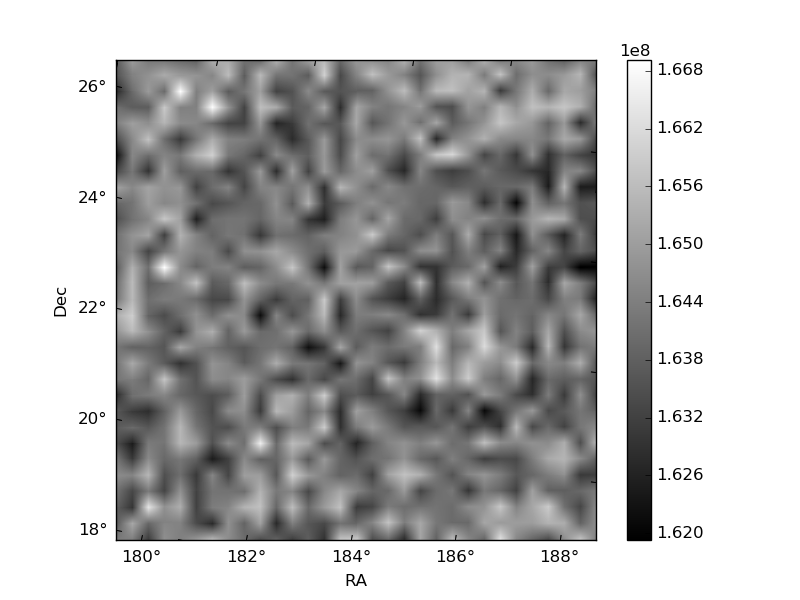
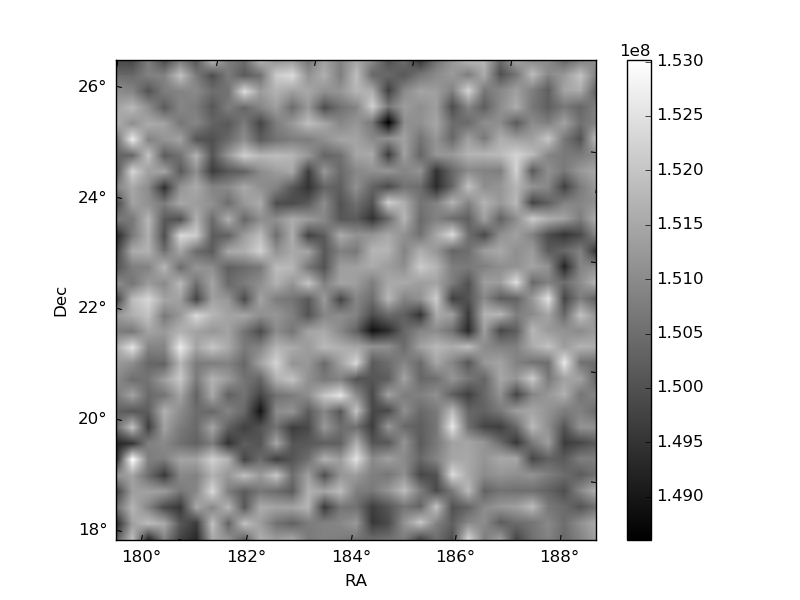
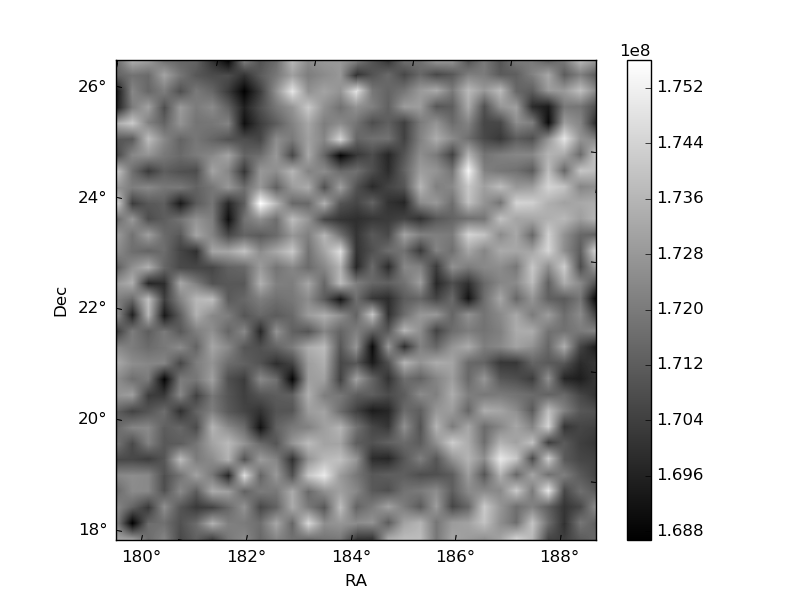
Histogram calculated using DETX and DETY for each event in the final _common_clean file
| Quadrant A | 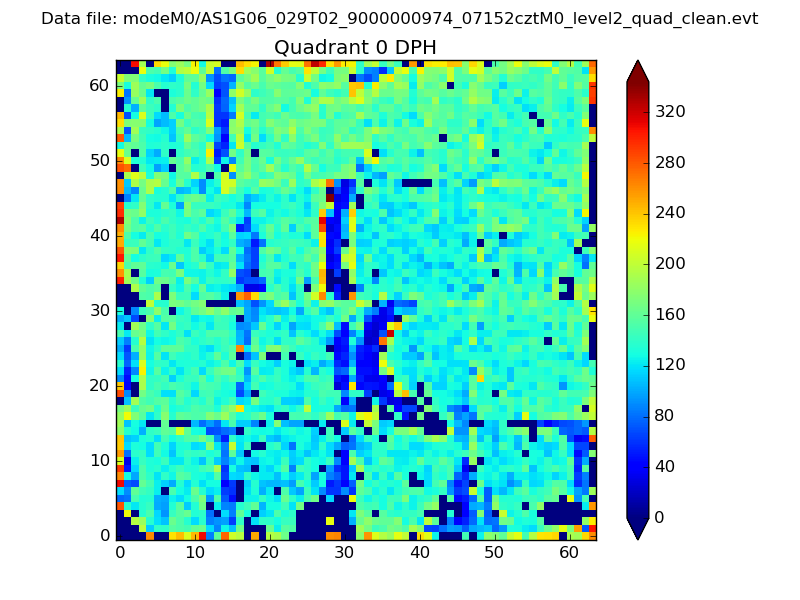 |
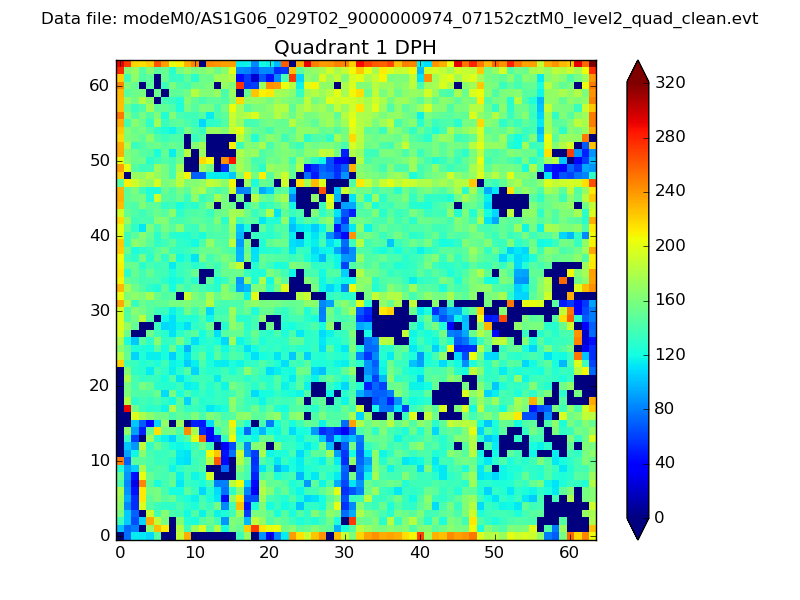 |
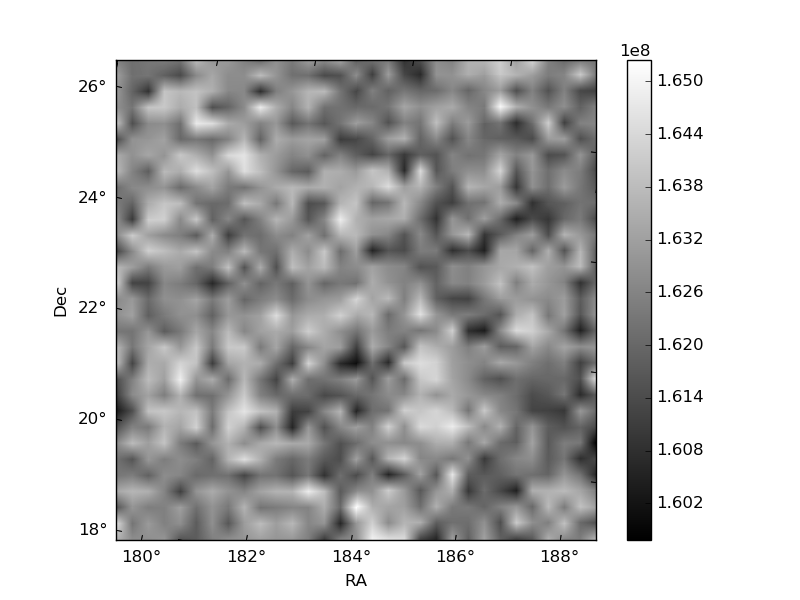
Quadrant B |
|---|---|---|---|
| Quadrant D | 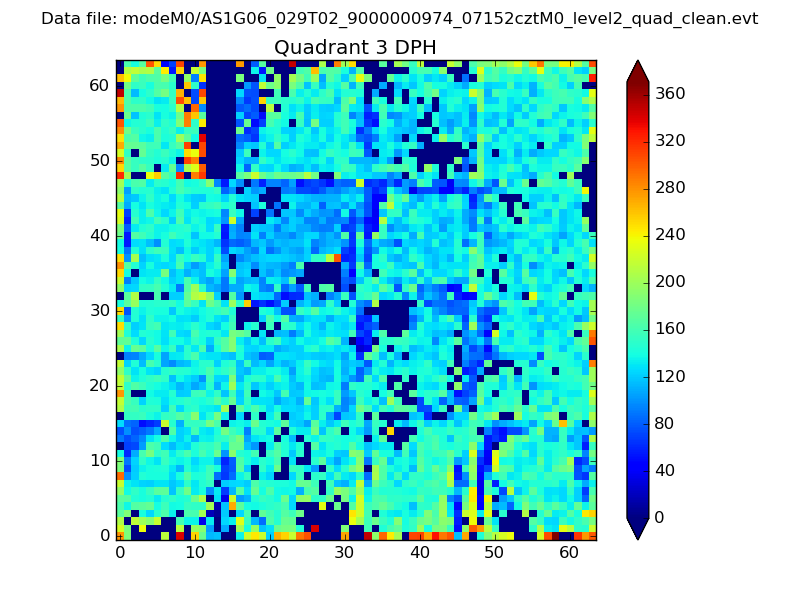 |
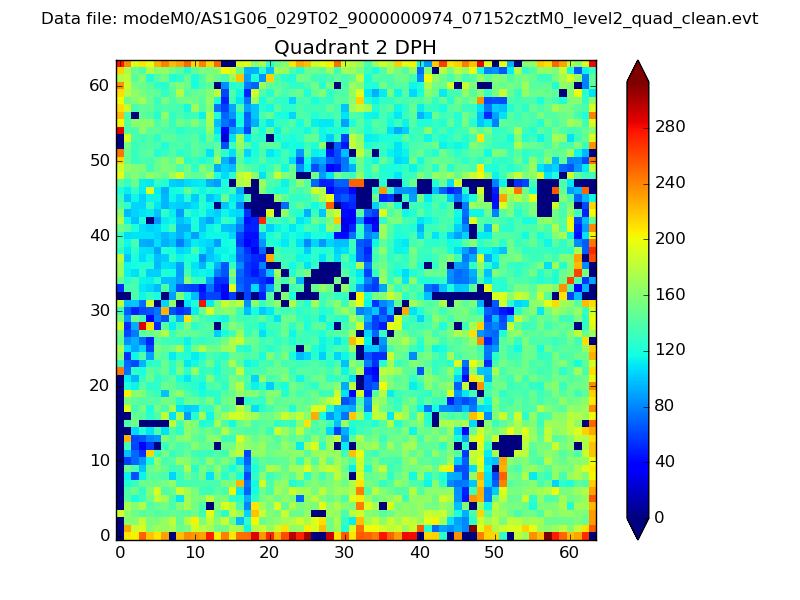 |
Quadrant C |
| Plot type | Count rate plots | Images |
|---|---|---|
| Comparison with Poisson distribution Blue bars denote a histogram of data divided into 1 sec bins. Red curve is a Poisson curve with rate = median count rate of data. |
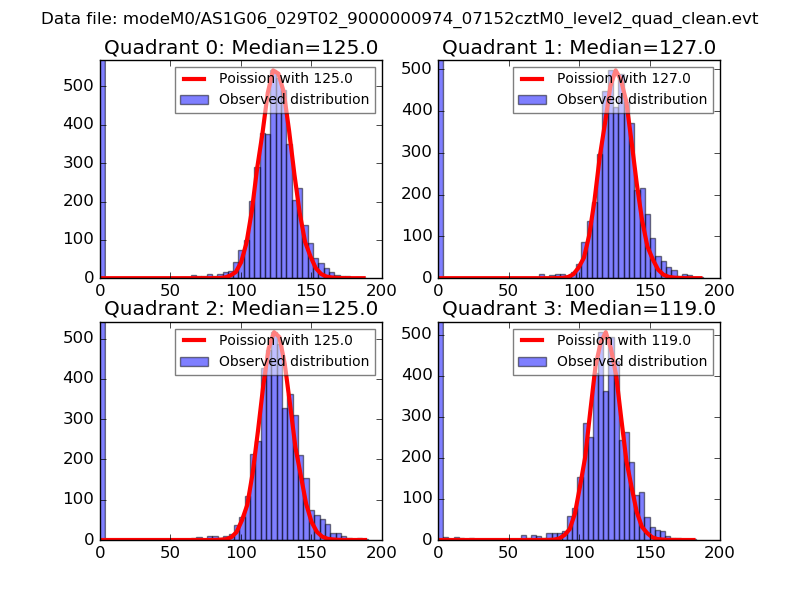 |
 |
| Quadrant-wise count rates Data is divided into 100 sec bins |
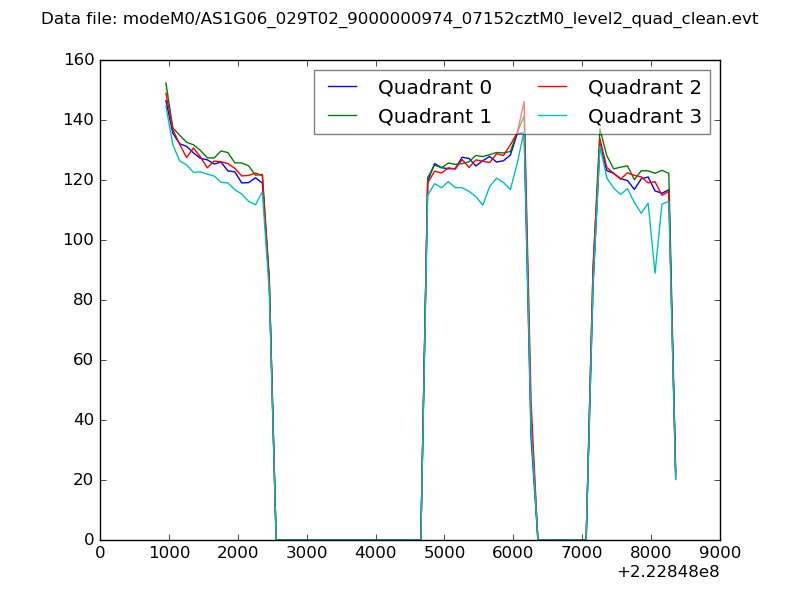 |
|
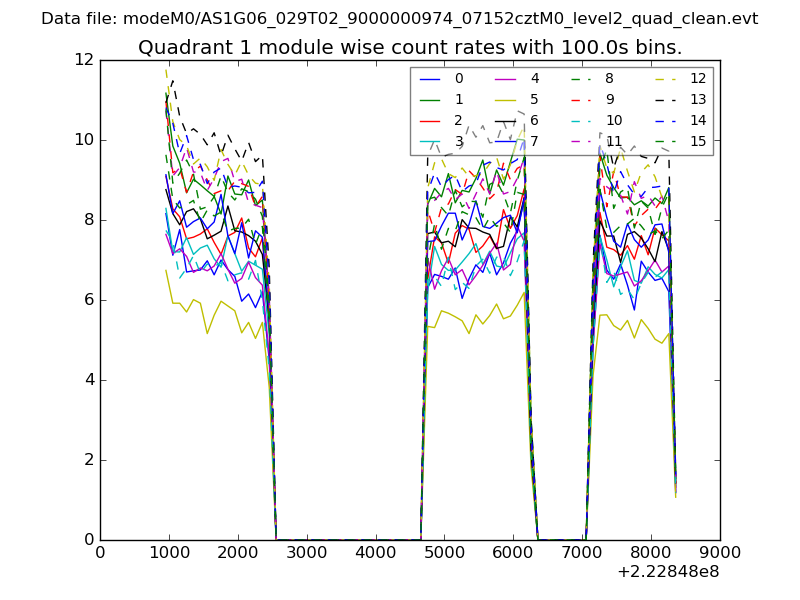
| Module-wise count rates for Quadrant A Data is divided into 100 sec bins |
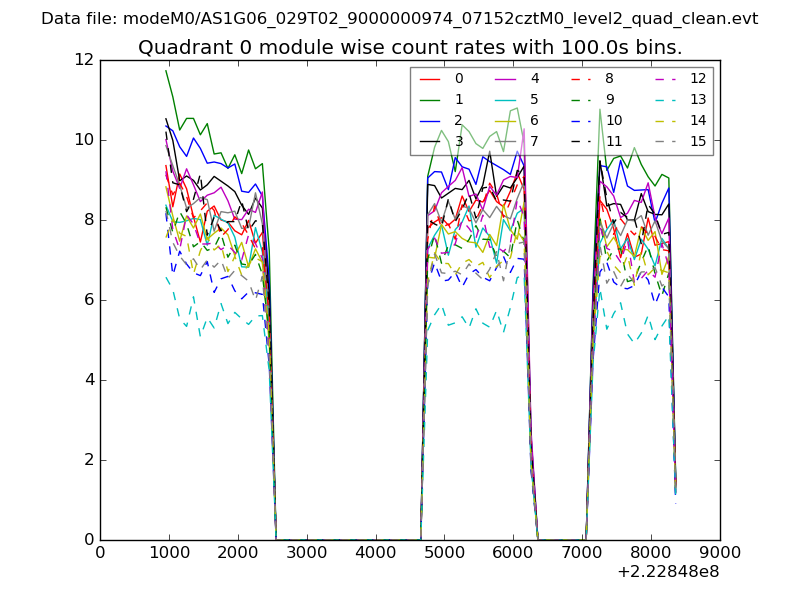 |
 |
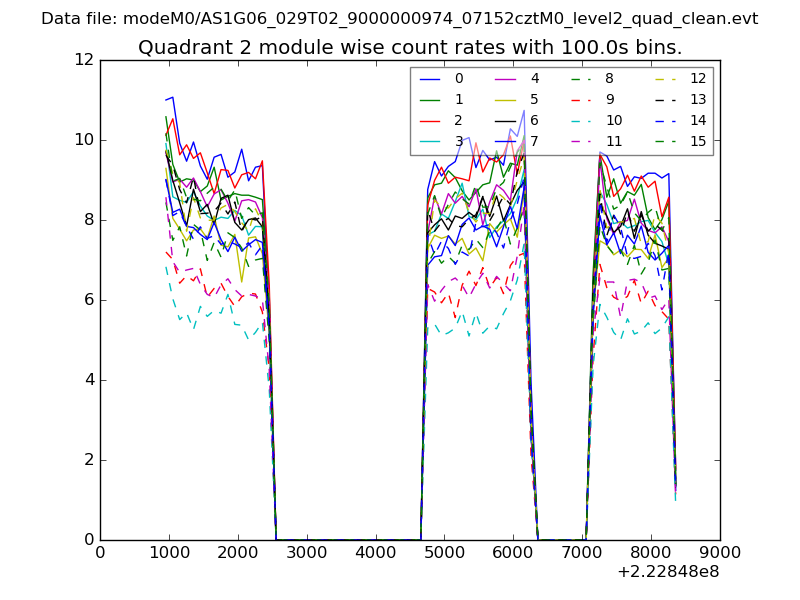
| Module-wise count rates for Quadrant B Data is divided into 100 sec bins |
 |
 |
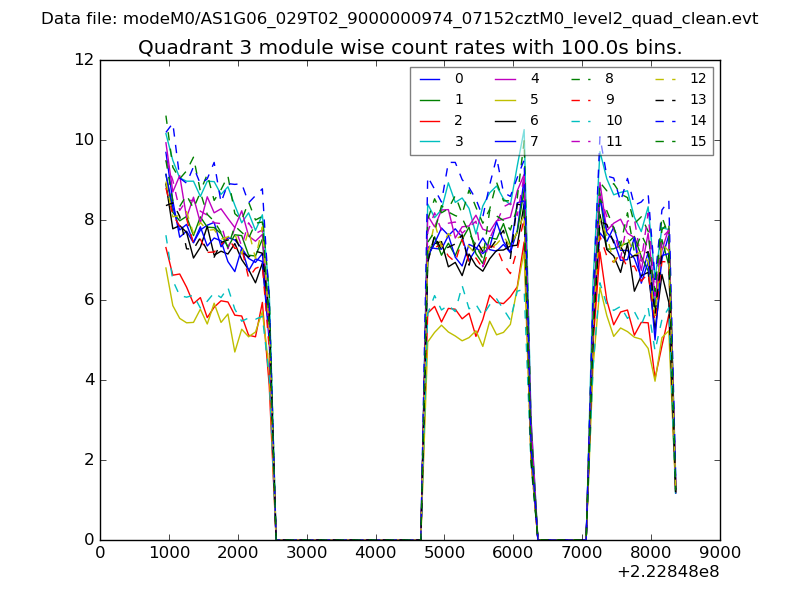
| Module-wise count rates for Quadrant C Data is divided into 100 sec bins |
 |
 |
| Module-wise count rates for Quadrant D Data is divided into 100 sec bins |
 |
 |
| Parameter | Plot |
|---|---|
| CZT HV Monitor | 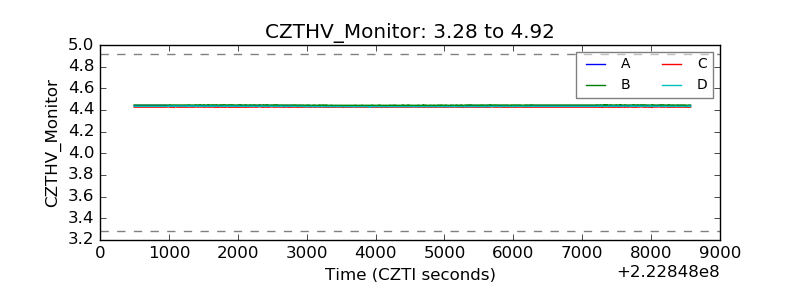 |
| D_VDD | 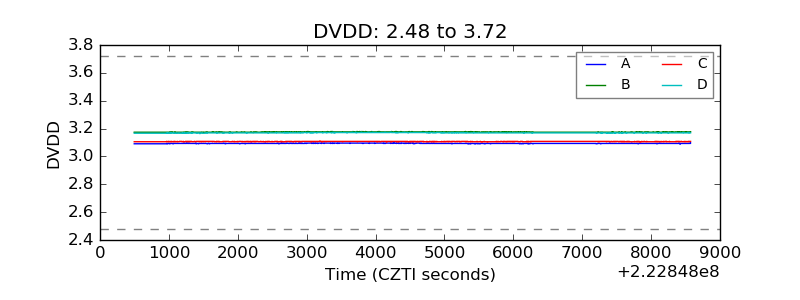 |
| Temperature 1 | 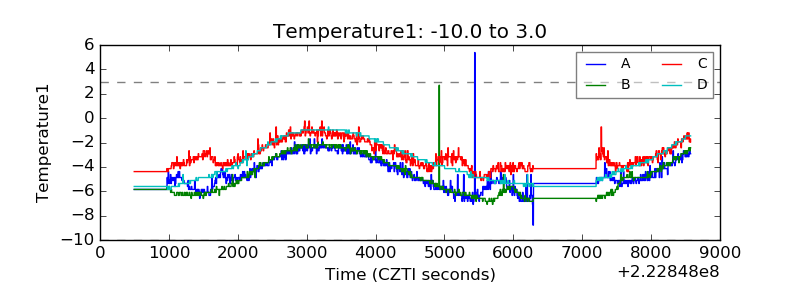 |
| Veto HV Monitor | 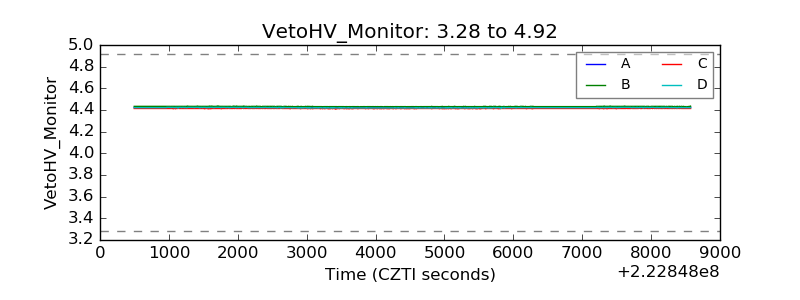 |
| Veto LLD | 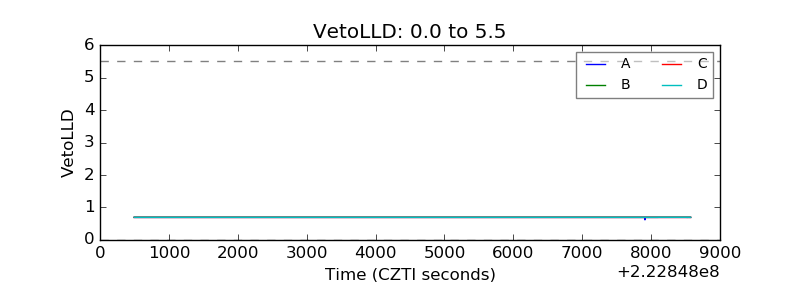 |
| Alpha Counter | 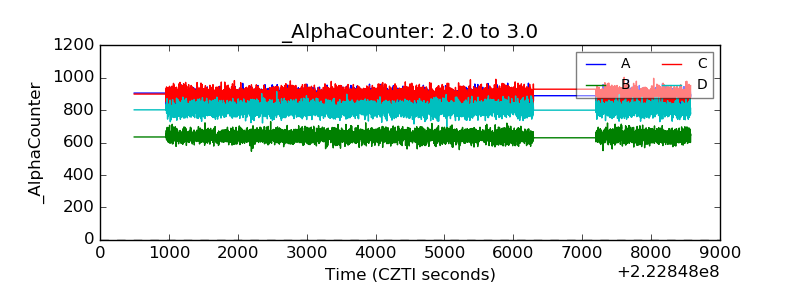 |
| _CPM_Rate | 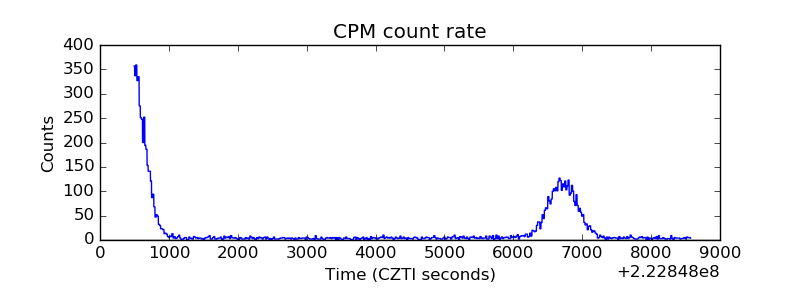 |
| CZT Counter |  |
| +2.5 Volts monitor |  |
| +5 Volts monitor |  |
| _ROLL_ROT | 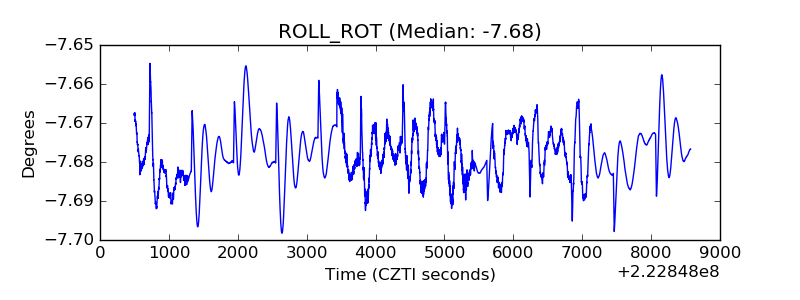 |
| _Roll_DEC | 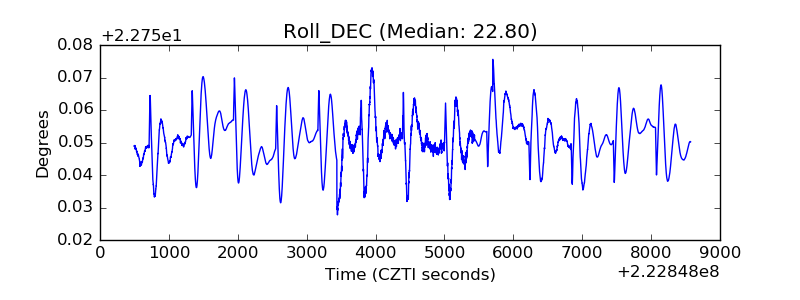 |
| _Roll_RA | 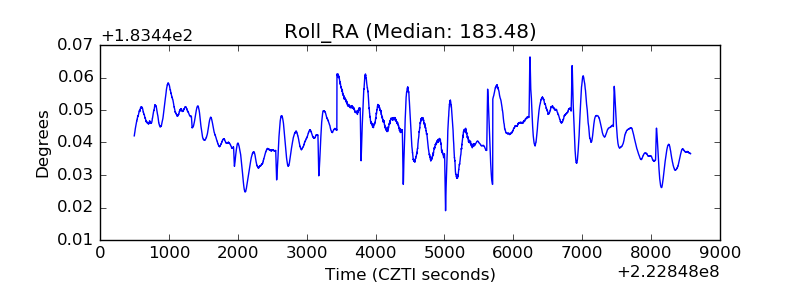 |
| Veto Counter | 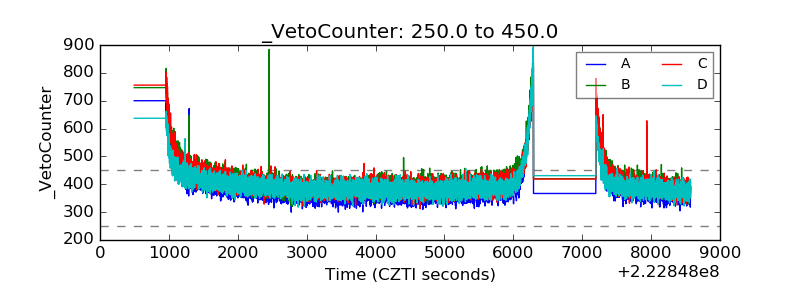 |