| Param | Original file | Final file |
|---|---|---|
| Filename | modeM0/AS1G06_029T02_9000000974_07153cztM0_level2.evt | modeM0/AS1G06_029T02_9000000974_07153cztM0_level2_quad_clean.evt |
| Size (bytes) | 489,496,320 | 80,110,080 |
| Size | 466.8 MB | 76.4 MB |
| Events in quadrant A | 3,500,989 | 487,068 |
| Events in quadrant B | 3,392,668 | 497,399 |
| Events in quadrant C | 3,200,181 | 488,893 |
| Events in quadrant D | 4,258,120 | 468,205 |
| Mode M9 | |||
|---|---|---|---|
| Quadrant | BADHDUFLAG | Total packets | Discarded packets |
| A | 0 | 5 | 0 |
| B | 0 | 5 | 0 |
| C | 0 | 5 | 0 |
| D | 0 | 5 | 0 |
| Mode SS | |||
|---|---|---|---|
| Quadrant | BADHDUFLAG | Total packets | Discarded packets |
| A | 0 | 142 | 0 |
| B | 0 | 142 | 0 |
| C | 0 | 142 | 0 |
| D | 0 | 142 | 0 |
| Mode M0 | |||
|---|---|---|---|
| Quadrant | BADHDUFLAG | Total packets | Discarded packets |
| A | 0 | 15179 | 2 |
| B | 0 | 14556 | 1 |
| C | 0 | 14401 | 1 |
| D | 0 | 17175 | 1 |
| Quadrant | Total seconds | Saturated seconds | Saturation percentage |
|---|---|---|---|
| A | 6948 | 354 | 5.094991% |
| B | 6948 | 133 | 1.914220% |
| C | 6948 | 117 | 1.683938% |
| D | 6948 | 293 | 4.217041% |
Noise dominated data is calculated using 1-second bins in cleaned event files. If a bin has >2000 counts, and if more than 50% of those come from <1% of pixels, then it is considered to be noise-dominated and hence unusable.
| Quadrant | # 1 sec bins | Bins with >0 counts | Bins with >2000 counts | High rate bins dominated by noise | Noise dominated (total time) | Noise dominated (detector-on time) | Marked lightcurve |
|---|---|---|---|---|---|---|---|
| A | 7468 | 6948 | 78 | 78 | 1.04% | 1.12% | 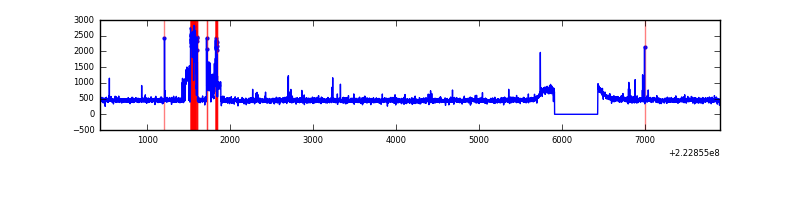 |
| B | 7468 | 6948 | 5 | 5 | 0.07% | 0.07% | 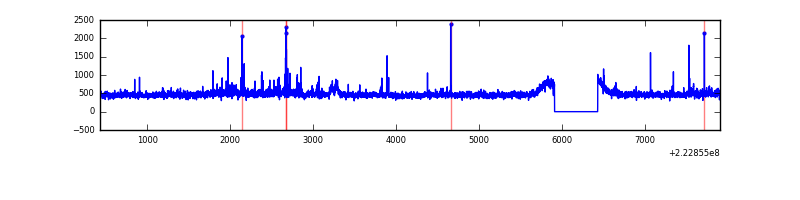 |
| C | 7468 | 6948 | 9 | 9 | 0.12% | 0.13% | 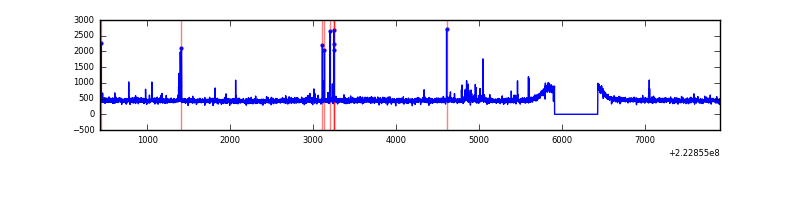 |
| D | 7468 | 6948 | 143 | 143 | 1.91% | 2.06% | 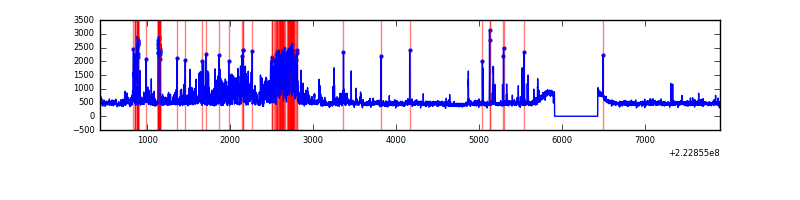 |
Top three noisy pixels from each quadrant. If the there are fewer than three noisy pixels in the level2.evt file, extra rows are filled as -1
| Pixel properties | Quadrant properties | ||||||
|---|---|---|---|---|---|---|---|
| Quadrant | DetID | PixID | Counts | Sigma | Mean | Median | Sigma |
| A | 14 | 111 | 359990 | 2178.48 | 805 | 785 | 164.9 |
| A | 3 | 1 | 17432 | 100.96 | 805 | 785 | 164.9 |
| A | 13 | 248 | 14489 | 83.11 | 805 | 785 | 164.9 |
| B | 0 | 214 | 90627 | 565.06 | 821 | 800 | 159.0 |
| B | 4 | 81 | 45765 | 282.85 | 821 | 800 | 159.0 |
| B | 0 | 219 | 44283 | 273.53 | 821 | 800 | 159.0 |
| C | 4 | 254 | 93798 | 504.7 | 793 | 796 | 184.3 |
| C | 13 | 61 | 6212 | 29.39 | 793 | 796 | 184.3 |
| C | 8 | 128 | 5518 | 25.63 | 793 | 796 | 184.3 |
| D | 2 | 216 | 898486 | 4552.04 | 791 | 765 | 197.2 |
| D | 8 | 195 | 262673 | 1328.05 | 791 | 765 | 197.2 |
| D | 2 | 14 | 84069 | 422.41 | 791 | 765 | 197.2 |
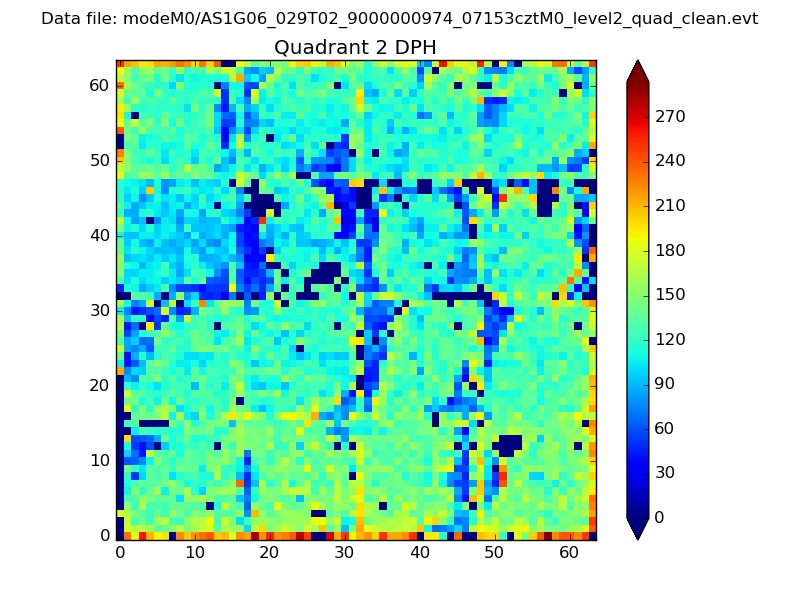
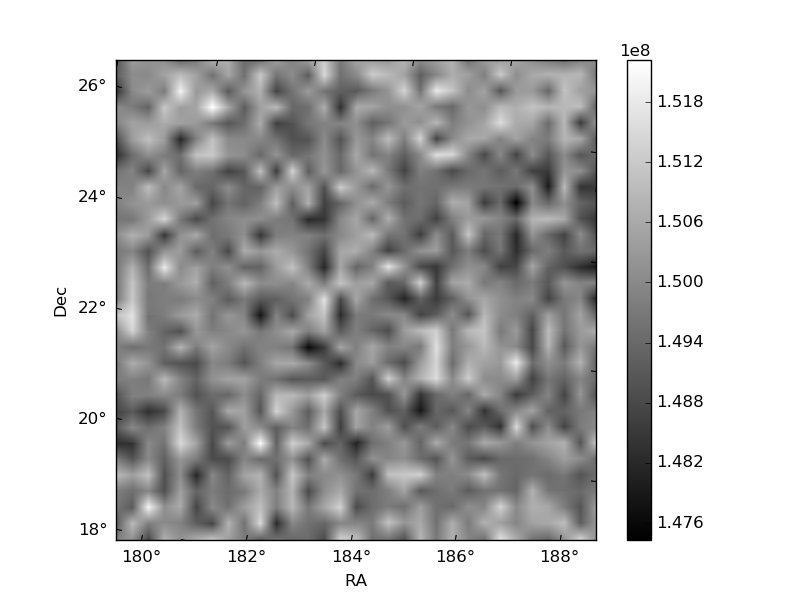
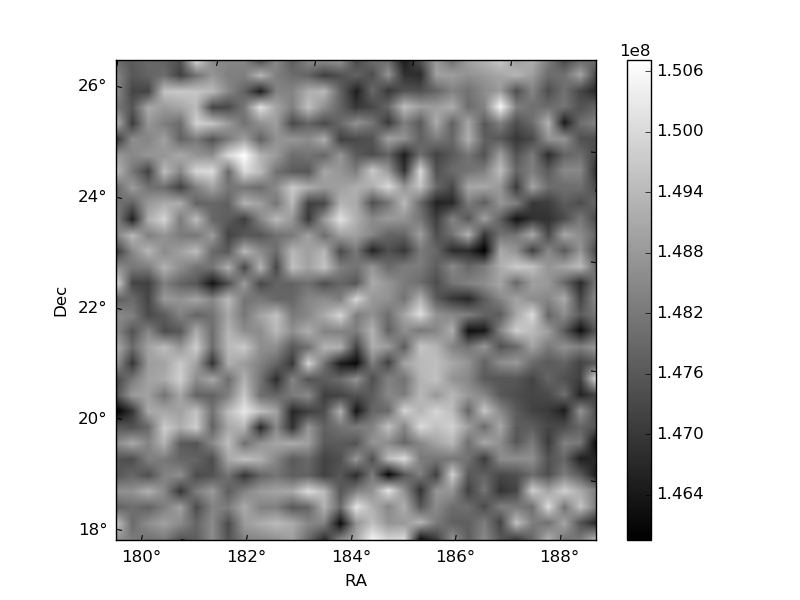
Histogram calculated using DETX and DETY for each event in the final _common_clean file
| Quadrant A | 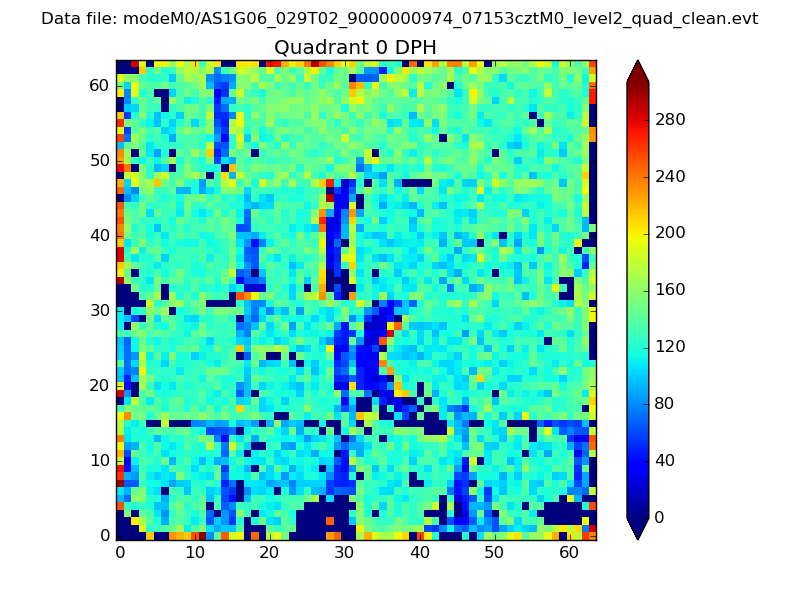 |
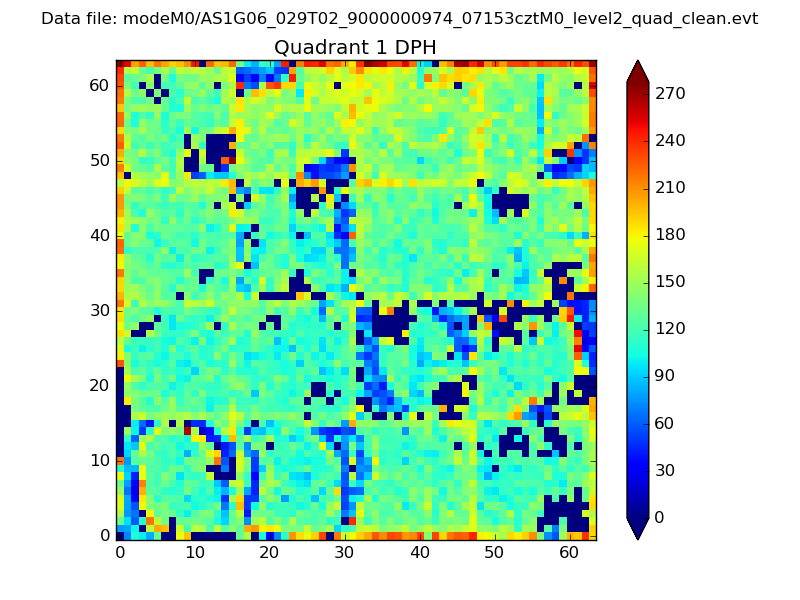 |
Quadrant B |
|---|---|---|---|
| Quadrant D | 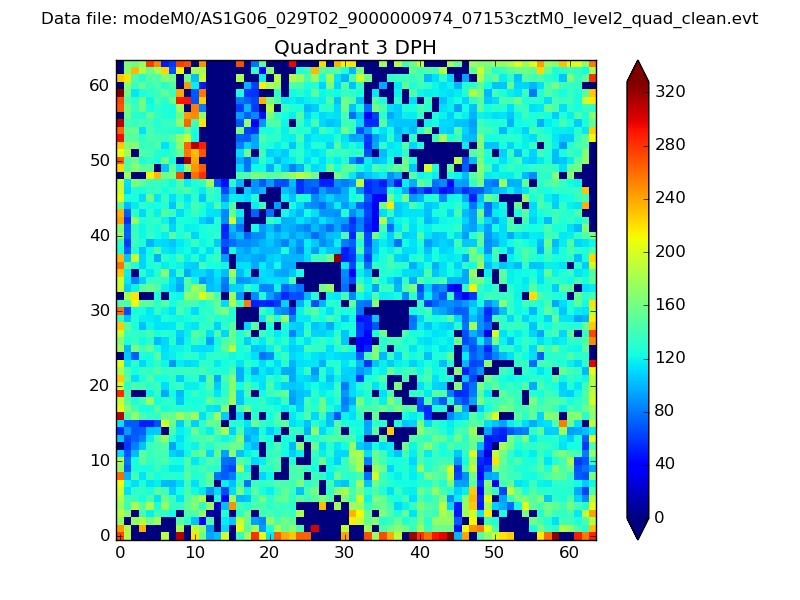 |
 |
Quadrant C |
| Plot type | Count rate plots | Images |
|---|---|---|
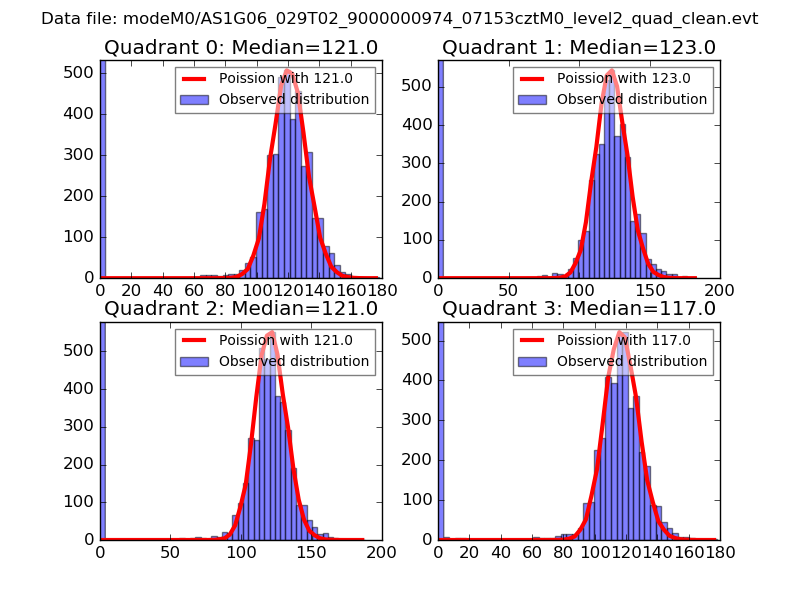
| Comparison with Poisson distribution Blue bars denote a histogram of data divided into 1 sec bins. Red curve is a Poisson curve with rate = median count rate of data. |
 |
 |
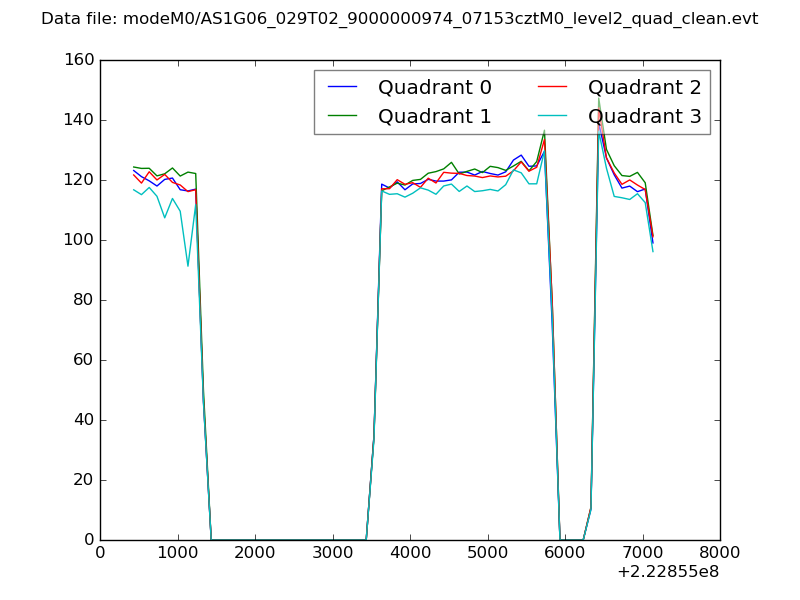
| Quadrant-wise count rates Data is divided into 100 sec bins |
 |
|
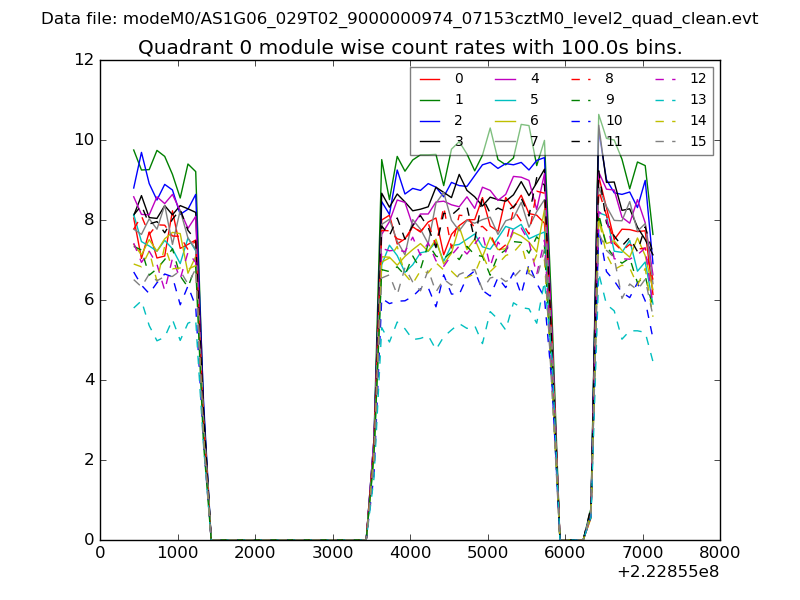
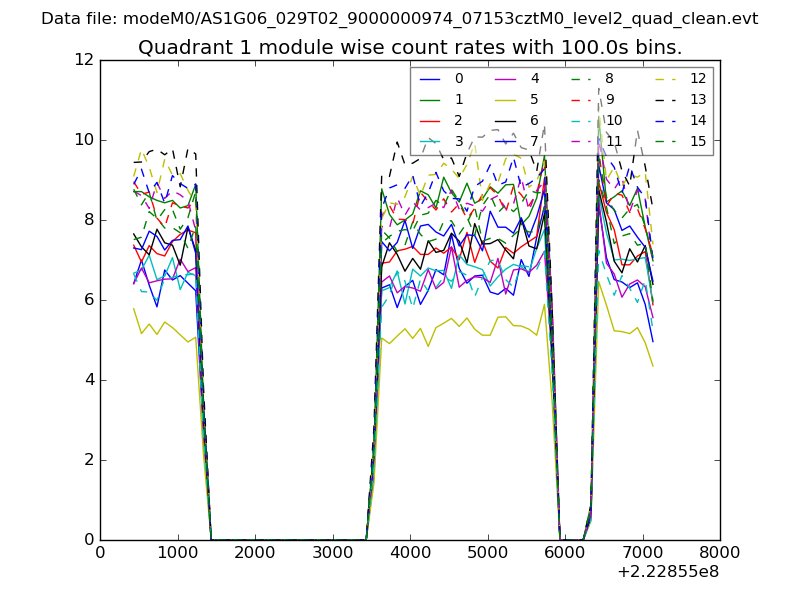
| Module-wise count rates for Quadrant A Data is divided into 100 sec bins |
 |
 |
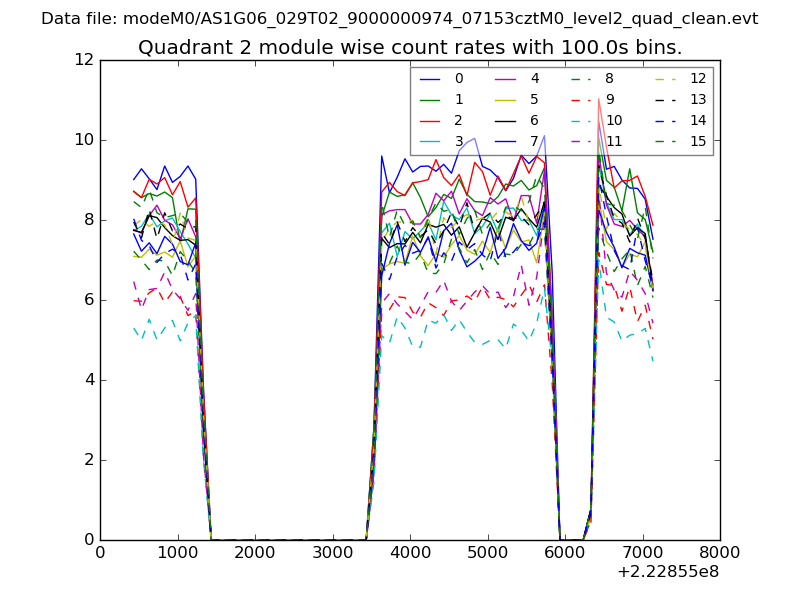
| Module-wise count rates for Quadrant B Data is divided into 100 sec bins |
 |
 |
| Module-wise count rates for Quadrant C Data is divided into 100 sec bins |
 |
 |
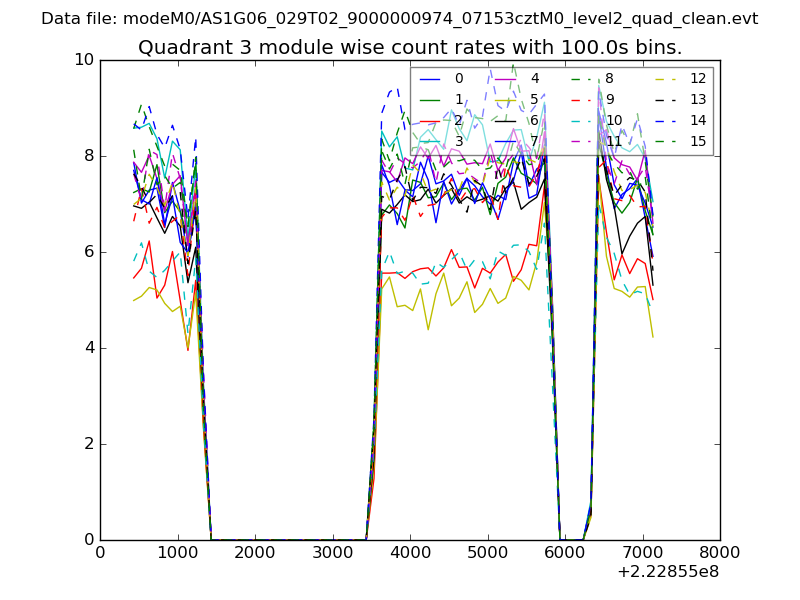
| Module-wise count rates for Quadrant D Data is divided into 100 sec bins |
 |
 |
| Parameter | Plot |
|---|---|
| CZT HV Monitor | 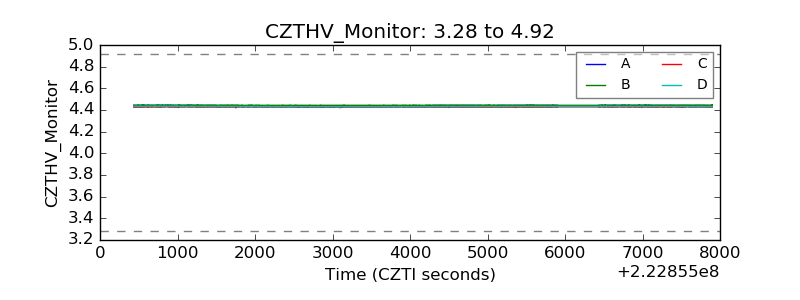 |
| D_VDD | 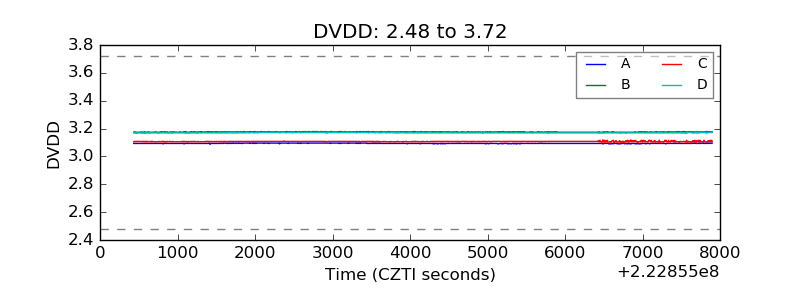 |
| Temperature 1 | 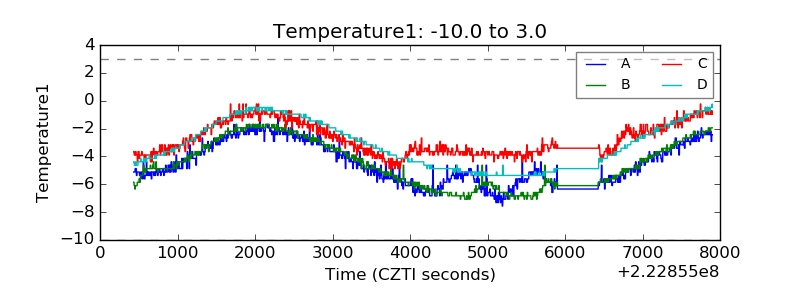 |
| Veto HV Monitor | 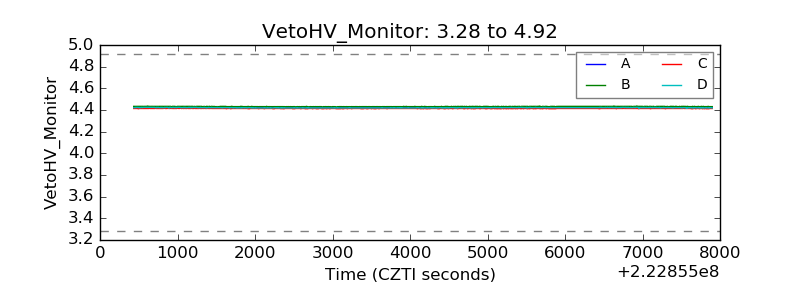 |
| Veto LLD |  |
| Alpha Counter | 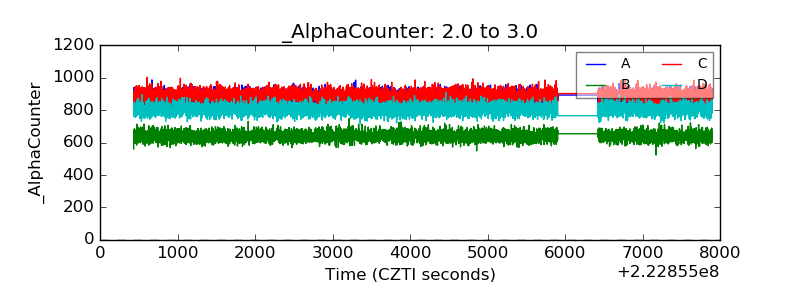 |
| _CPM_Rate | 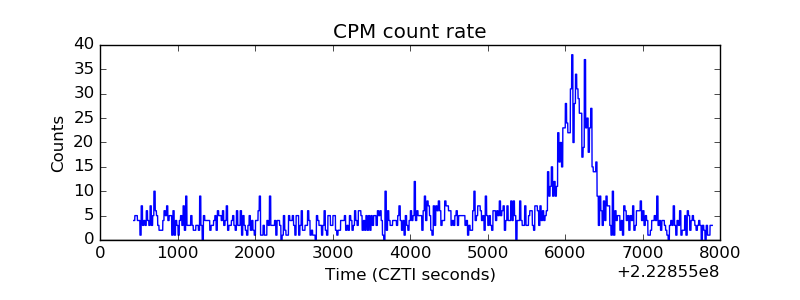 |
| CZT Counter | 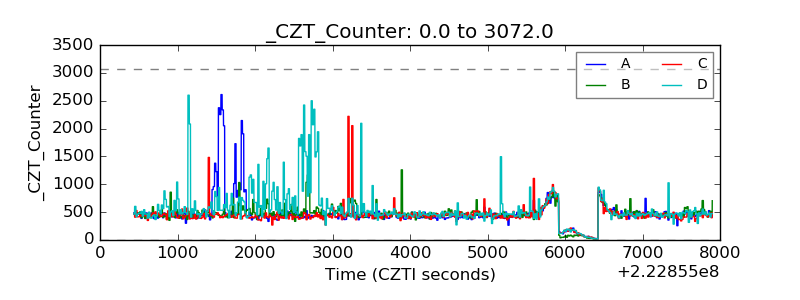 |
| +2.5 Volts monitor |  |
| +5 Volts monitor |  |
| _ROLL_ROT | 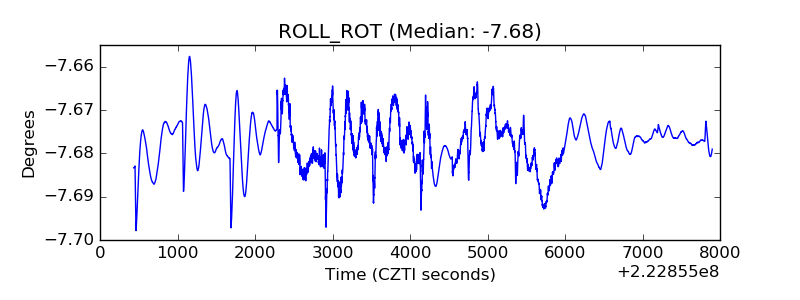 |
| _Roll_DEC | 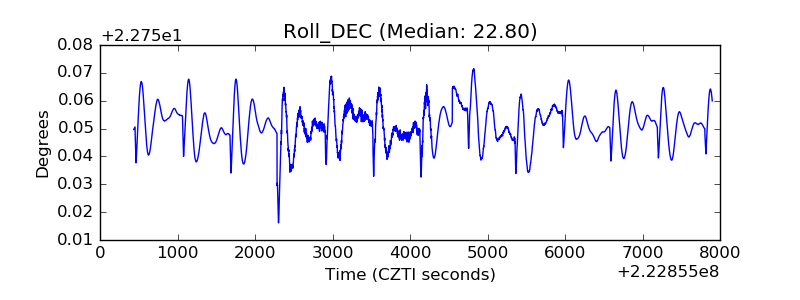 |
| _Roll_RA | 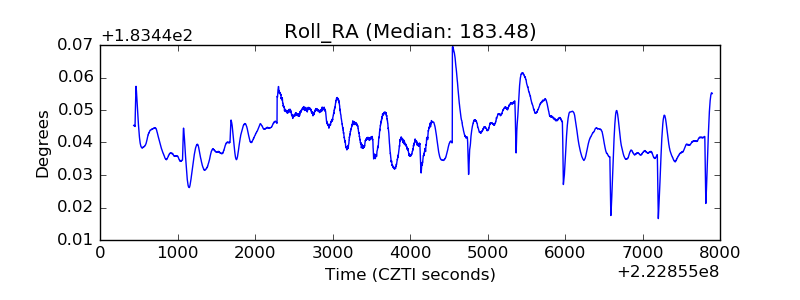 |
| Veto Counter | 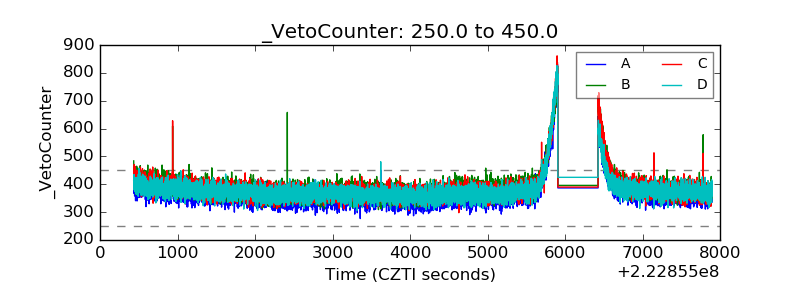 |