| Param | Original file | Final file |
|---|---|---|
| Filename | modeM0/AS1G06_029T02_9000000974_07154cztM0_level2.evt | modeM0/AS1G06_029T02_9000000974_07154cztM0_level2_quad_clean.evt |
| Size (bytes) | 515,957,760 | 78,609,600 |
| Size | 492.1 MB | 75.0 MB |
| Events in quadrant A | 3,405,124 | 468,932 |
| Events in quadrant B | 3,662,264 | 478,237 |
| Events in quadrant C | 3,614,251 | 471,013 |
| Events in quadrant D | 4,446,120 | 451,518 |
| Mode M9 | |||
|---|---|---|---|
| Quadrant | BADHDUFLAG | Total packets | Discarded packets |
| A | 0 | 1 | 0 |
| B | 0 | 1 | 0 |
| C | 0 | 1 | 0 |
| D | 0 | 1 | 0 |
| Mode SS | |||
|---|---|---|---|
| Quadrant | BADHDUFLAG | Total packets | Discarded packets |
| A | 0 | 150 | 0 |
| B | 0 | 150 | 0 |
| C | 0 | 150 | 0 |
| D | 0 | 150 | 0 |
| Mode M0 | |||
|---|---|---|---|
| Quadrant | BADHDUFLAG | Total packets | Discarded packets |
| A | 0 | 15188 | 3 |
| B | 0 | 15656 | 2 |
| C | 0 | 15869 | 2 |
| D | 0 | 17912 | 2 |
| Quadrant | Total seconds | Saturated seconds | Saturation percentage |
|---|---|---|---|
| A | 7324 | 175 | 2.389405% |
| B | 7324 | 182 | 2.484981% |
| C | 7324 | 174 | 2.375751% |
| D | 7324 | 346 | 4.724194% |
Noise dominated data is calculated using 1-second bins in cleaned event files. If a bin has >2000 counts, and if more than 50% of those come from <1% of pixels, then it is considered to be noise-dominated and hence unusable.
| Quadrant | # 1 sec bins | Bins with >0 counts | Bins with >2000 counts | High rate bins dominated by noise | Noise dominated (total time) | Noise dominated (detector-on time) | Marked lightcurve |
|---|---|---|---|---|---|---|---|
| A | 7484 | 7325 | 1 | 1 | 0.01% | 0.01% | 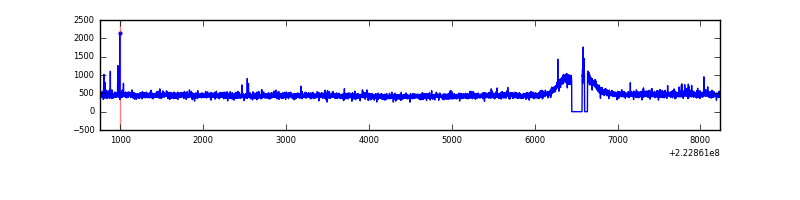 |
| B | 7484 | 7324 | 3 | 3 | 0.04% | 0.04% | 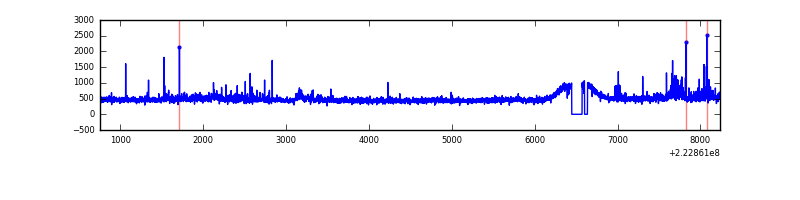 |
| C | 7484 | 7325 | 27 | 27 | 0.36% | 0.37% | 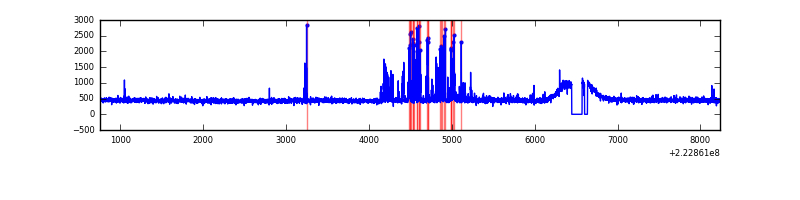 |
| D | 7484 | 7325 | 143 | 143 | 1.91% | 1.95% | 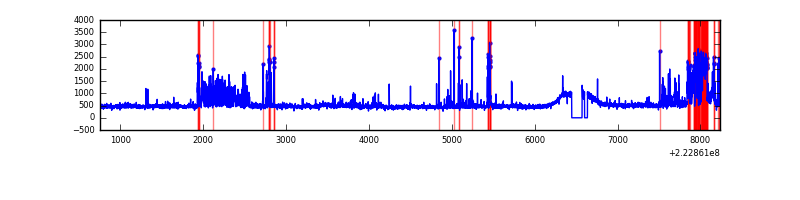 |
Top three noisy pixels from each quadrant. If the there are fewer than three noisy pixels in the level2.evt file, extra rows are filled as -1
| Pixel properties | Quadrant properties | ||||||
|---|---|---|---|---|---|---|---|
| Quadrant | DetID | PixID | Counts | Sigma | Mean | Median | Sigma |
| A | 5 | 112 | 15713 | 82.51 | 874 | 853 | 180.1 |
| A | 13 | 248 | 10252 | 52.19 | 874 | 853 | 180.1 |
| A | 0 | 226 | 8271 | 41.19 | 874 | 853 | 180.1 |
| B | 0 | 214 | 140109 | 814.48 | 877 | 853 | 171.0 |
| B | 4 | 80 | 47395 | 272.22 | 877 | 853 | 171.0 |
| B | 0 | 219 | 40108 | 229.59 | 877 | 853 | 171.0 |
| C | 4 | 254 | 277526 | 1393.08 | 849 | 852 | 198.6 |
| C | 8 | 128 | 13548 | 63.93 | 849 | 852 | 198.6 |
| C | 8 | 112 | 6877 | 30.34 | 849 | 852 | 198.6 |
| D | 2 | 216 | 663575 | 3178.44 | 845 | 817 | 208.5 |
| D | 8 | 195 | 320912 | 1535.1 | 845 | 817 | 208.5 |
| D | 12 | 233 | 153860 | 733.96 | 845 | 817 | 208.5 |
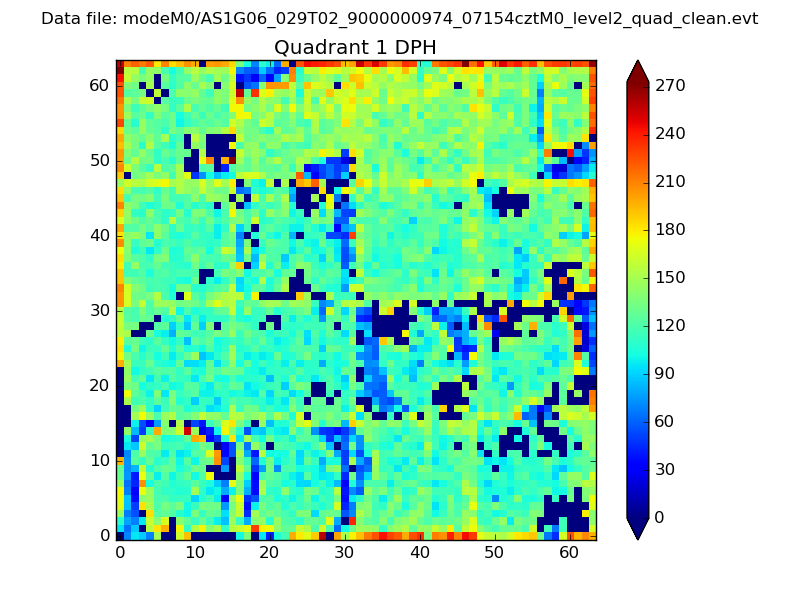
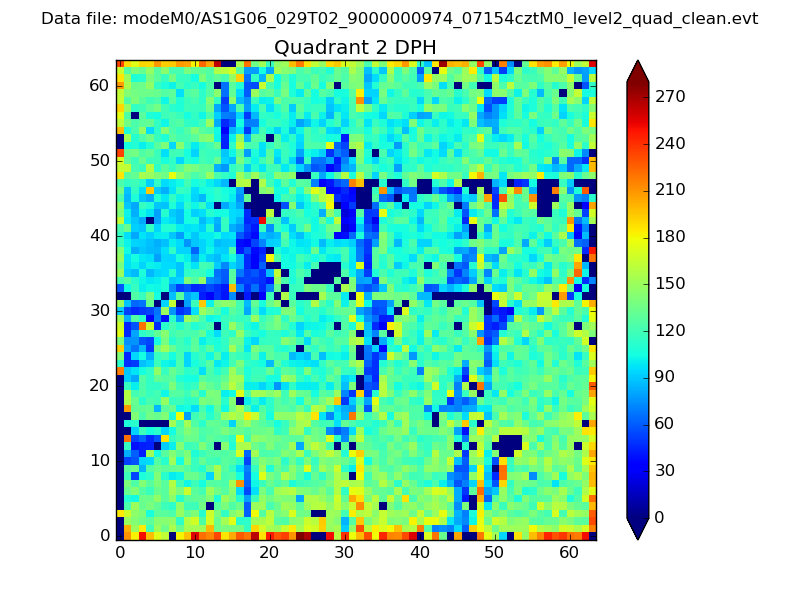
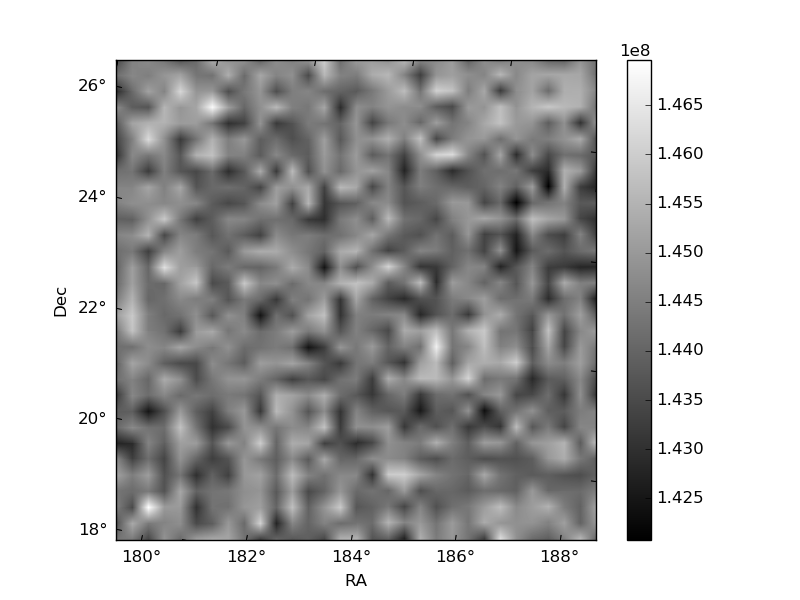
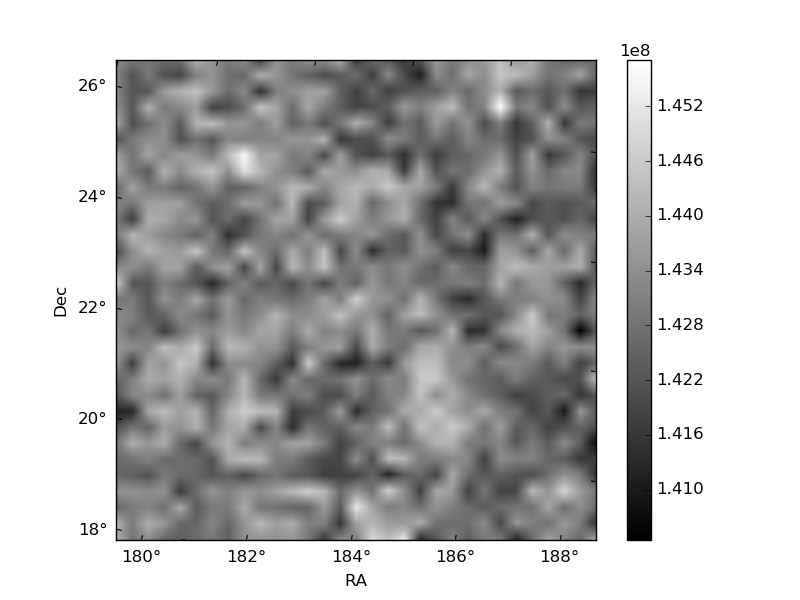
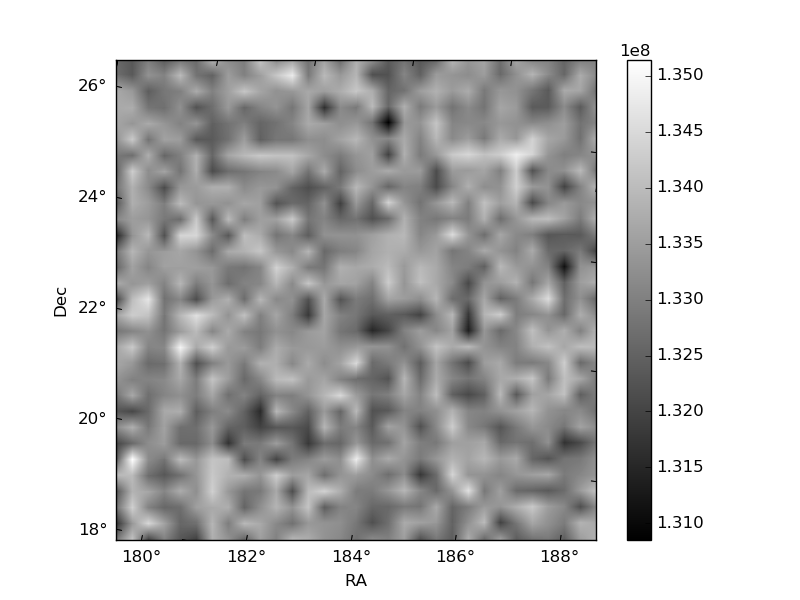
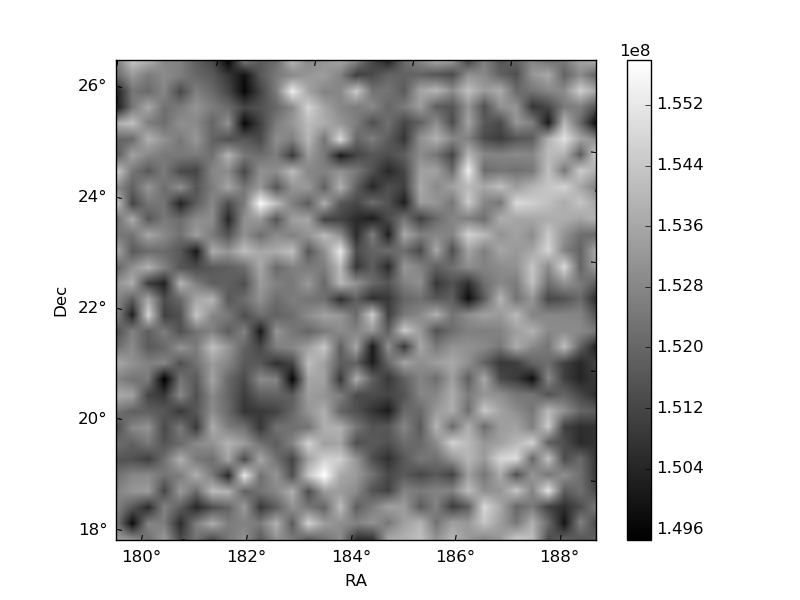
Histogram calculated using DETX and DETY for each event in the final _common_clean file
| Quadrant A |  |
 |
Quadrant B |
|---|---|---|---|
| Quadrant D | 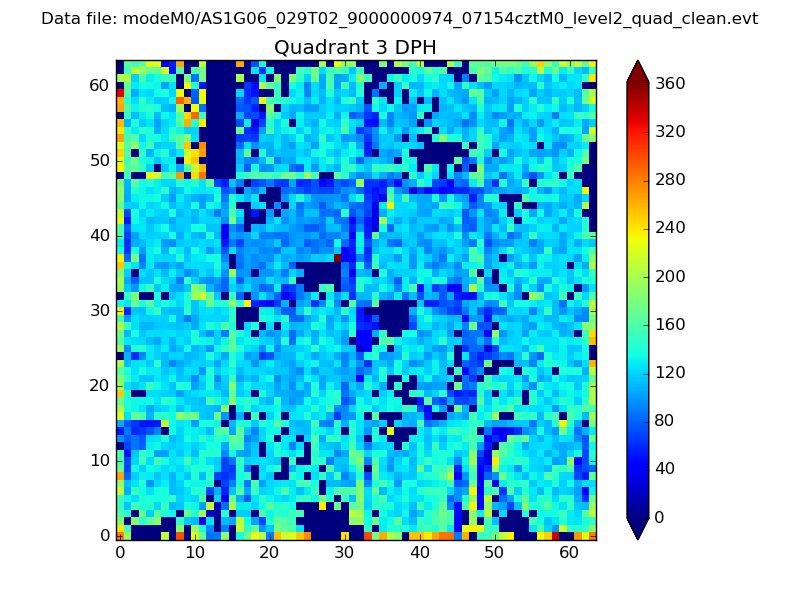 |
 |
Quadrant C |
| Plot type | Count rate plots | Images |
|---|---|---|
| Comparison with Poisson distribution Blue bars denote a histogram of data divided into 1 sec bins. Red curve is a Poisson curve with rate = median count rate of data. |
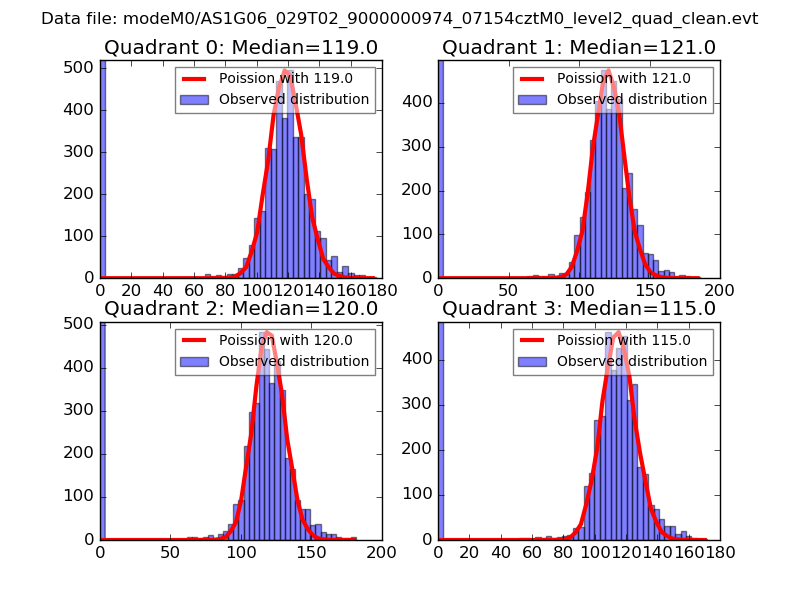 |
 |
| Quadrant-wise count rates Data is divided into 100 sec bins |
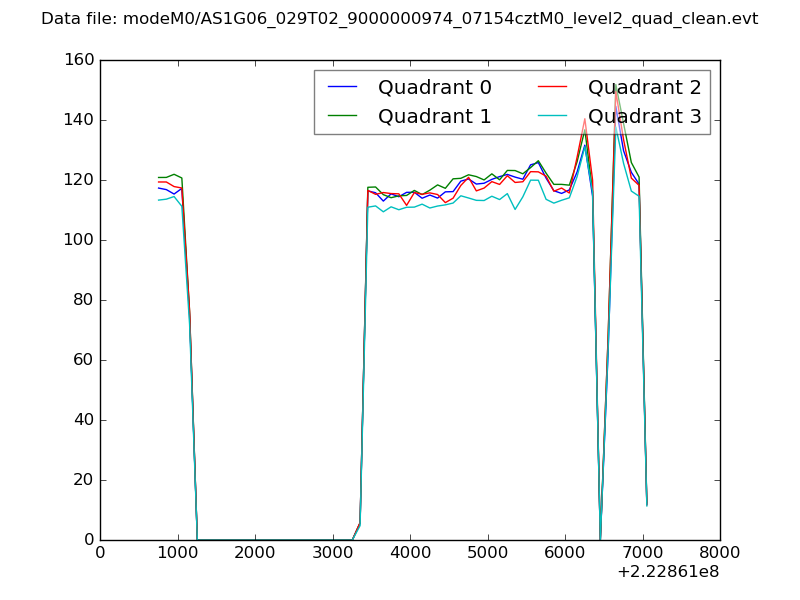 |
|
| Module-wise count rates for Quadrant A Data is divided into 100 sec bins |
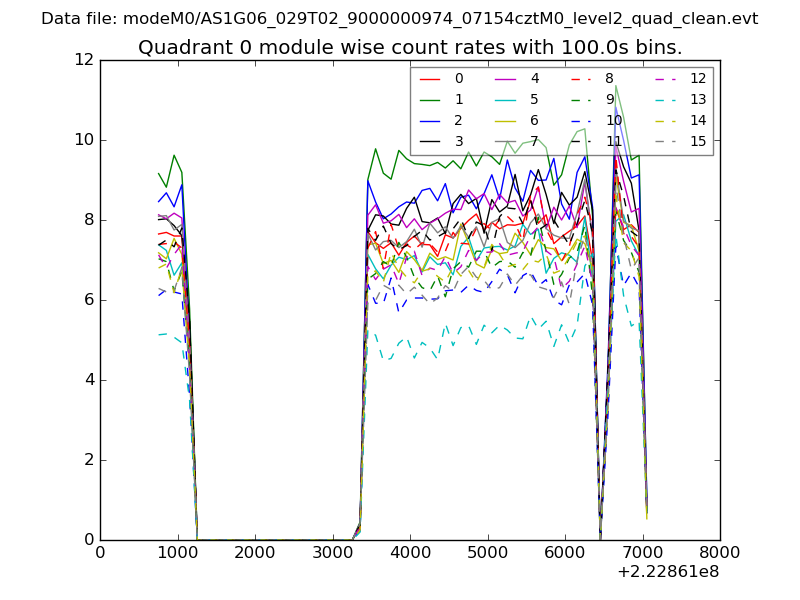 |
 |
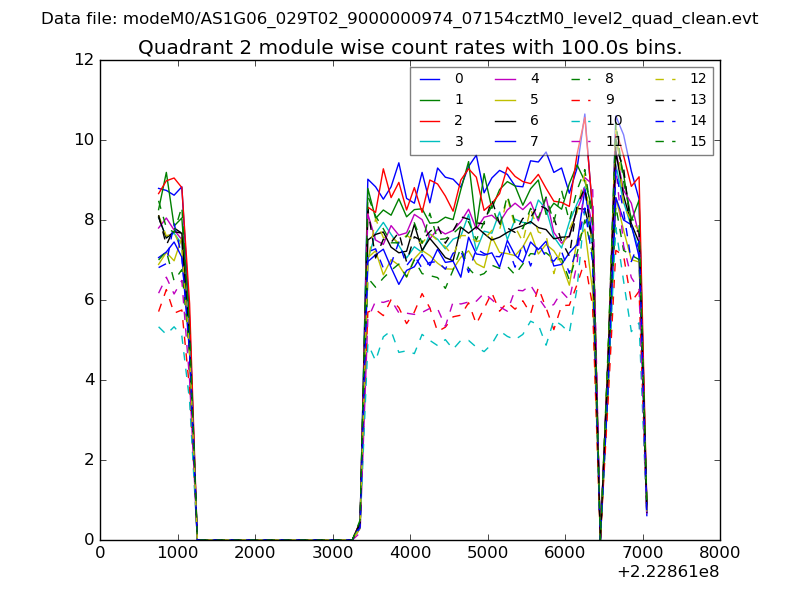
| Module-wise count rates for Quadrant B Data is divided into 100 sec bins |
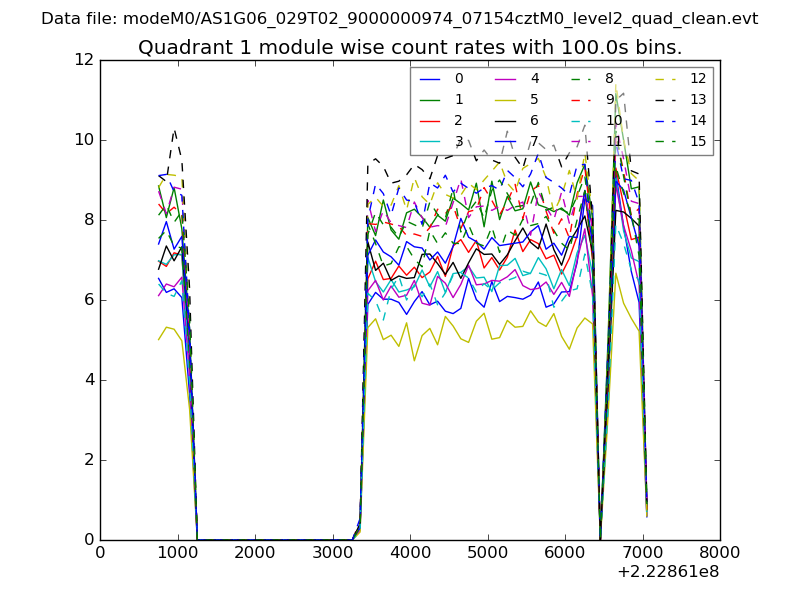 |
 |
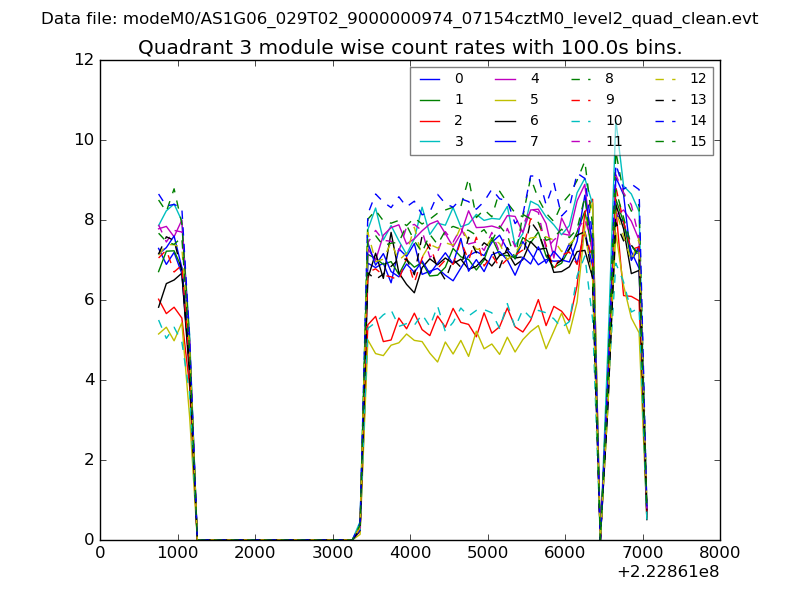
| Module-wise count rates for Quadrant C Data is divided into 100 sec bins |
 |
 |
| Module-wise count rates for Quadrant D Data is divided into 100 sec bins |
 |
 |
| Parameter | Plot |
|---|---|
| CZT HV Monitor | 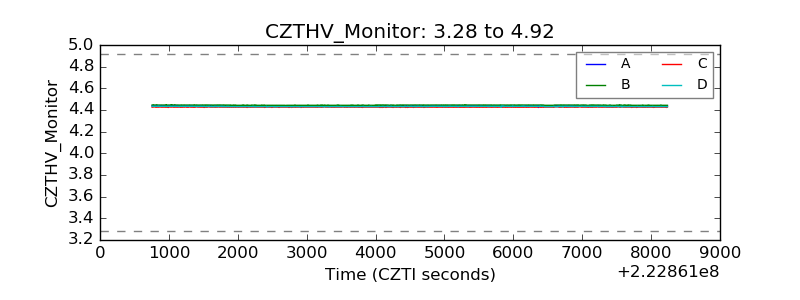 |
| D_VDD | 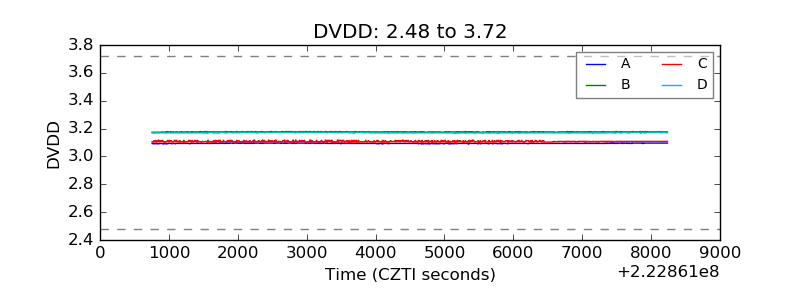 |
| Temperature 1 | 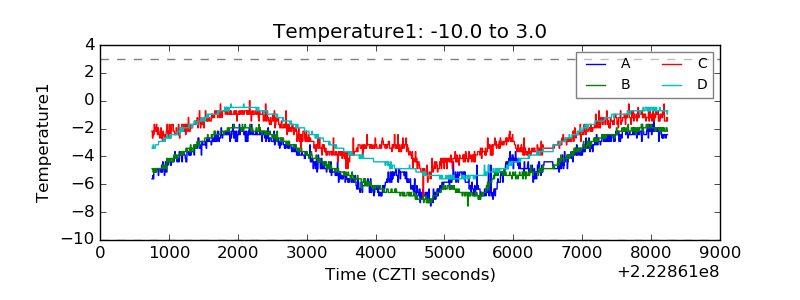 |
| Veto HV Monitor | 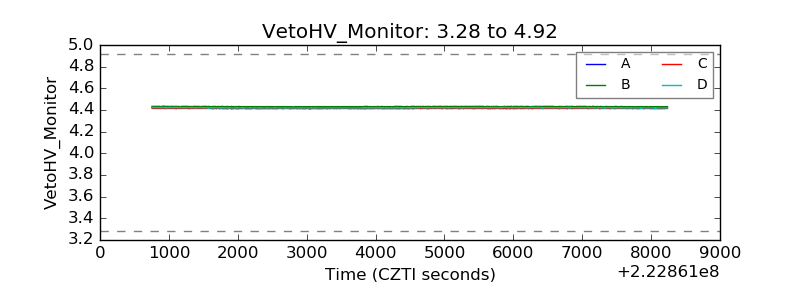 |
| Veto LLD | 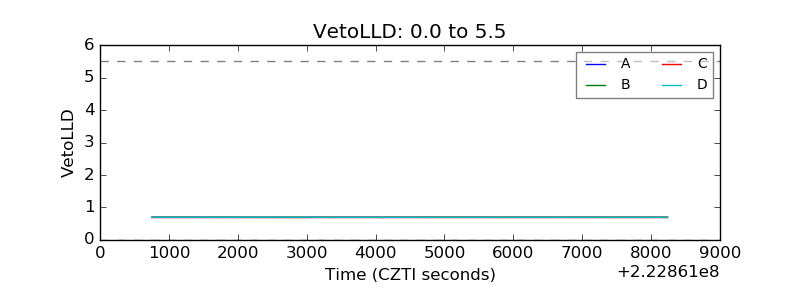 |
| Alpha Counter |  |
| _CPM_Rate | 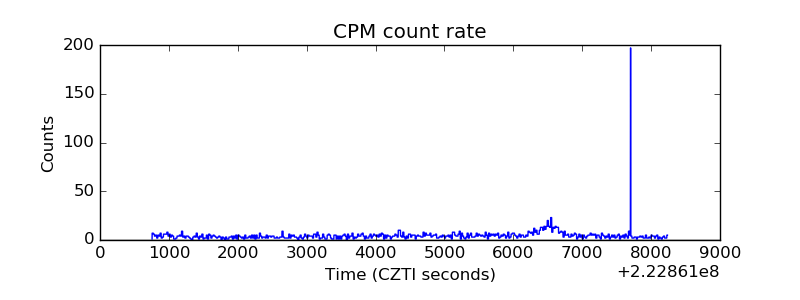 |
| CZT Counter | 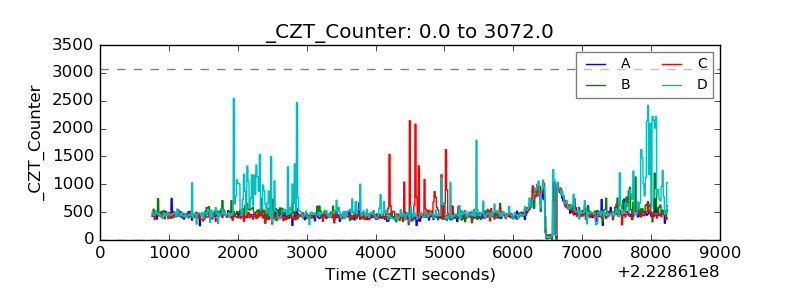 |
| +2.5 Volts monitor |  |
| +5 Volts monitor |  |
| _ROLL_ROT | 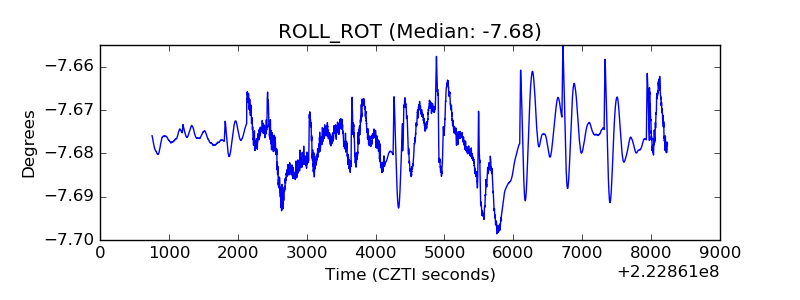 |
| _Roll_DEC | 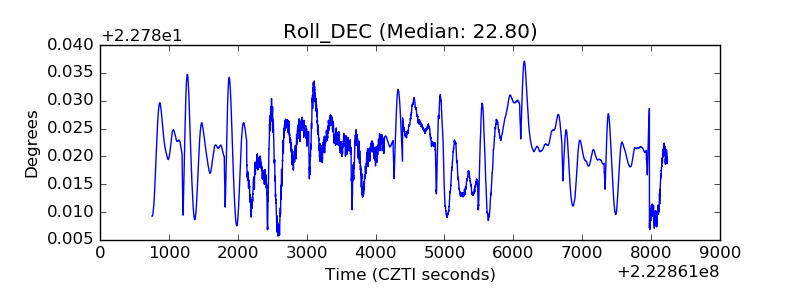 |
| _Roll_RA | 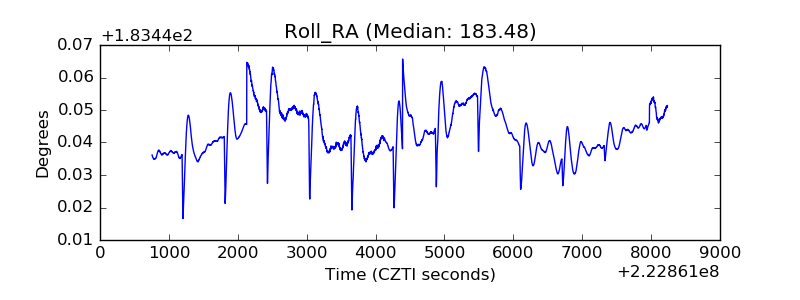 |
| Veto Counter | 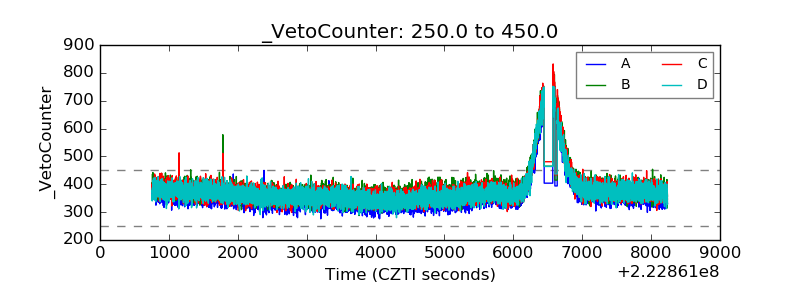 |