| Param | Original file | Final file |
|---|---|---|
| Filename | modeM0/AS1G06_029T02_9000000974_07156cztM0_level2.evt | modeM0/AS1G06_029T02_9000000974_07156cztM0_level2_quad_clean.evt |
| Size (bytes) | 141,122,880 | 9,267,840 |
| Size | 134.6 MB | 8.8 MB |
| Events in quadrant A | 939,632 | 37,958 |
| Events in quadrant B | 1,069,648 | 39,230 |
| Events in quadrant C | 920,580 | 39,021 |
| Events in quadrant D | 1,224,175 | 37,047 |
| Mode M9 | |||
|---|---|---|---|
| Quadrant | BADHDUFLAG | Total packets | Discarded packets |
| A | 0 | 3 | 0 |
| B | 0 | 3 | 0 |
| C | 0 | 3 | 0 |
| D | 0 | 3 | 0 |
| Mode SS | |||
|---|---|---|---|
| Quadrant | BADHDUFLAG | Total packets | Discarded packets |
| A | 0 | 36 | 0 |
| B | 0 | 36 | 0 |
| C | 0 | 36 | 0 |
| D | 0 | 36 | 0 |
| Mode M0 | |||
|---|---|---|---|
| Quadrant | BADHDUFLAG | Total packets | Discarded packets |
| A | 0 | 3860 | 2 |
| B | 0 | 4262 | 1 |
| C | 0 | 3883 | 1 |
| D | 0 | 4769 | 4 |
| Quadrant | Total seconds | Saturated seconds | Saturation percentage |
|---|---|---|---|
| A | 1733 | 136 | 7.847663% |
| B | 1733 | 162 | 9.347952% |
| C | 1733 | 134 | 7.732256% |
| D | 1732 | 179 | 10.334873% |
Noise dominated data is calculated using 1-second bins in cleaned event files. If a bin has >2000 counts, and if more than 50% of those come from <1% of pixels, then it is considered to be noise-dominated and hence unusable.
| Quadrant | # 1 sec bins | Bins with >0 counts | Bins with >2000 counts | High rate bins dominated by noise | Noise dominated (total time) | Noise dominated (detector-on time) | Marked lightcurve |
|---|---|---|---|---|---|---|---|
| A | 1928 | 1733 | 0 | 0 | 0.00% | 0.00% | 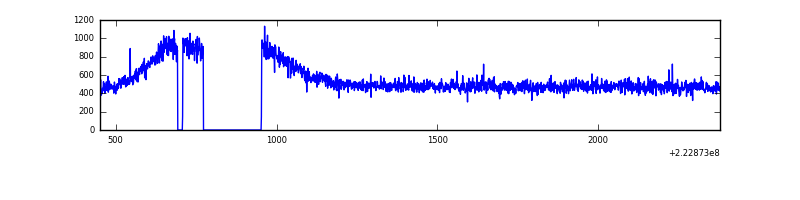 |
| B | 1928 | 1734 | 2 | 2 | 0.10% | 0.12% | 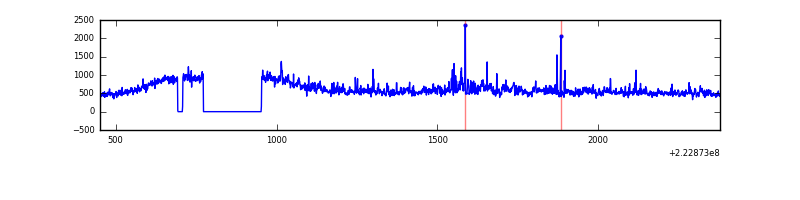 |
| C | 1928 | 1734 | 0 | 0 | 0.00% | 0.00% | 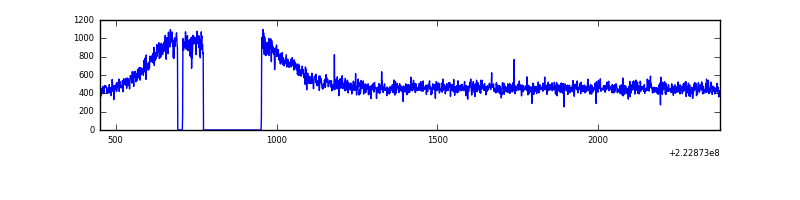 |
| D | 1928 | 1733 | 6 | 6 | 0.31% | 0.35% | 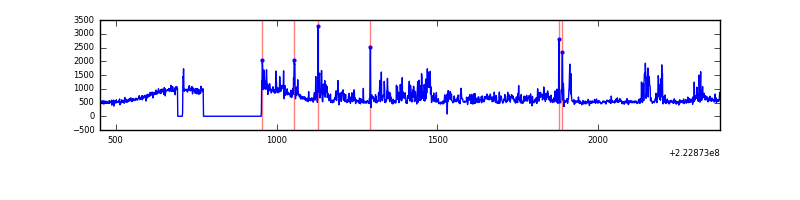 |
Top three noisy pixels from each quadrant. If the there are fewer than three noisy pixels in the level2.evt file, extra rows are filled as -1
| Pixel properties | Quadrant properties | ||||||
|---|---|---|---|---|---|---|---|
| Quadrant | DetID | PixID | Counts | Sigma | Mean | Median | Sigma |
| A | 0 | 226 | 2274 | 38.41 | 243 | 236 | 53.1 |
| A | 12 | 194 | 2148 | 36.04 | 243 | 236 | 53.1 |
| A | 3 | 1 | 1241 | 18.94 | 243 | 236 | 53.1 |
| B | 0 | 214 | 70850 | 1389.26 | 241 | 234 | 50.8 |
| B | 4 | 81 | 30994 | 605.16 | 241 | 234 | 50.8 |
| B | 4 | 80 | 23753 | 462.7 | 241 | 234 | 50.8 |
| C | 13 | 61 | 1811 | 27.12 | 235 | 235 | 58.1 |
| C | 7 | 159 | 830 | 10.24 | 235 | 235 | 58.1 |
| C | 3 | 202 | 603 | 6.33 | 235 | 235 | 58.1 |
| D | 2 | 216 | 190808 | 3086.86 | 237 | 228 | 61.7 |
| D | 8 | 195 | 108103 | 1747.27 | 237 | 228 | 61.7 |
| D | 14 | 34 | 11088 | 175.9 | 237 | 228 | 61.7 |
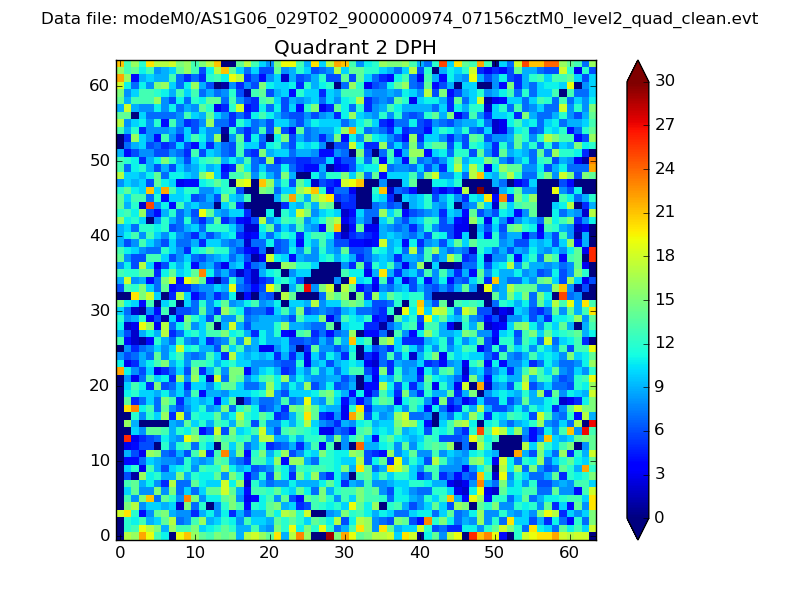
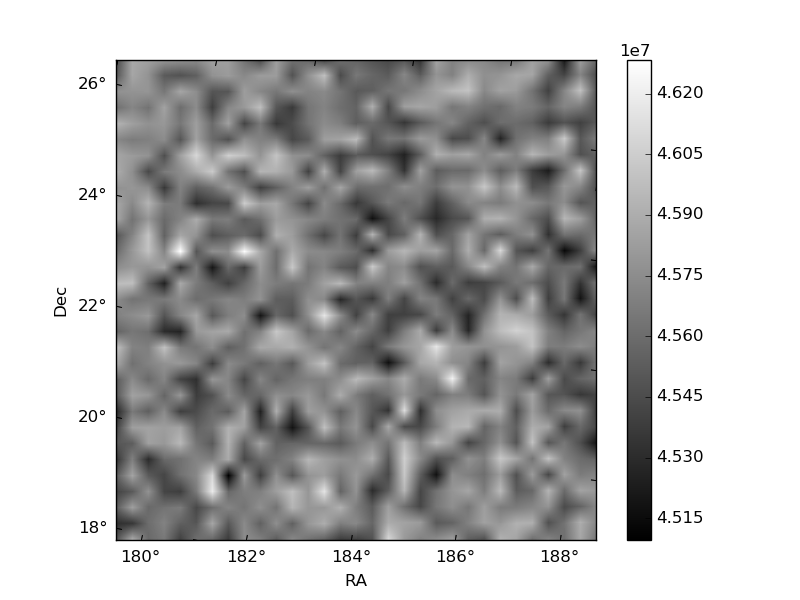
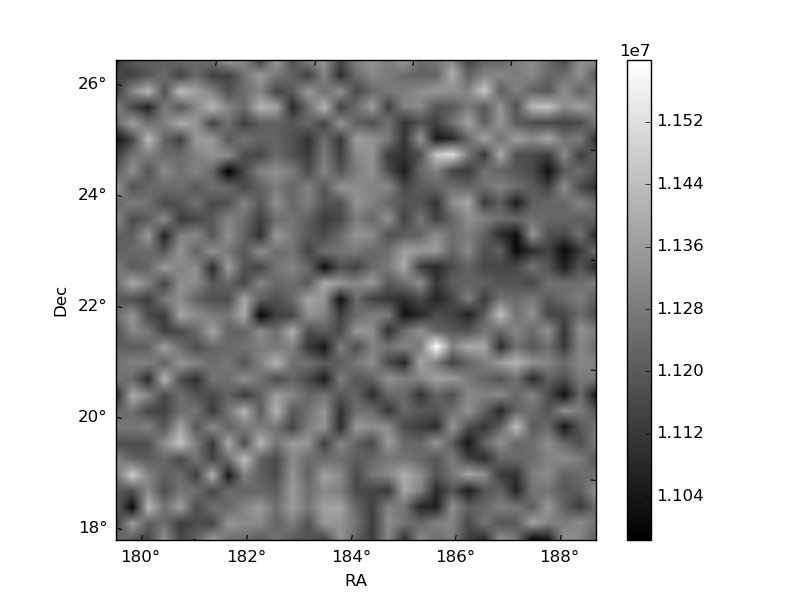
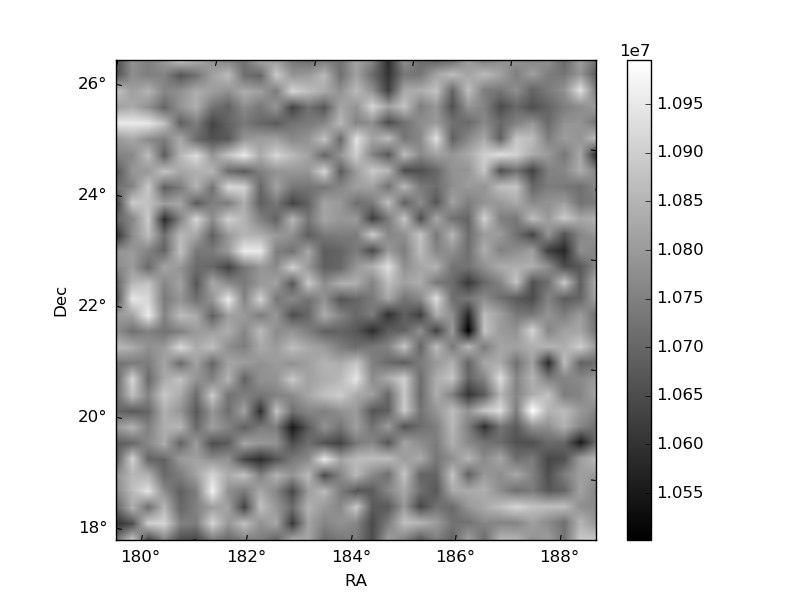
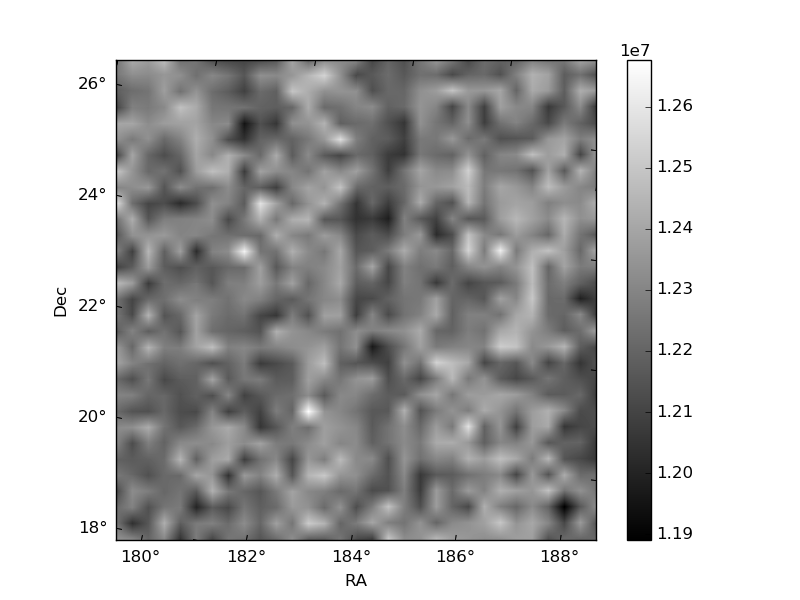
Histogram calculated using DETX and DETY for each event in the final _common_clean file
| Quadrant A | 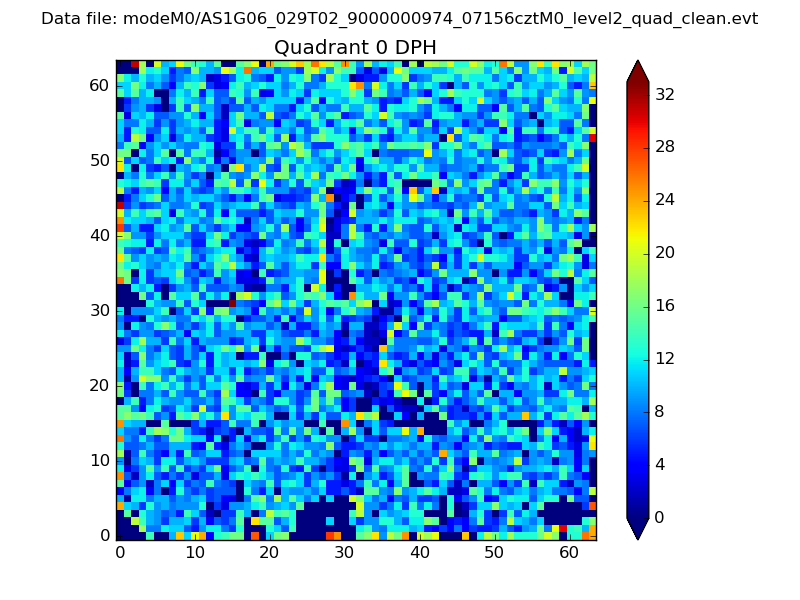 |
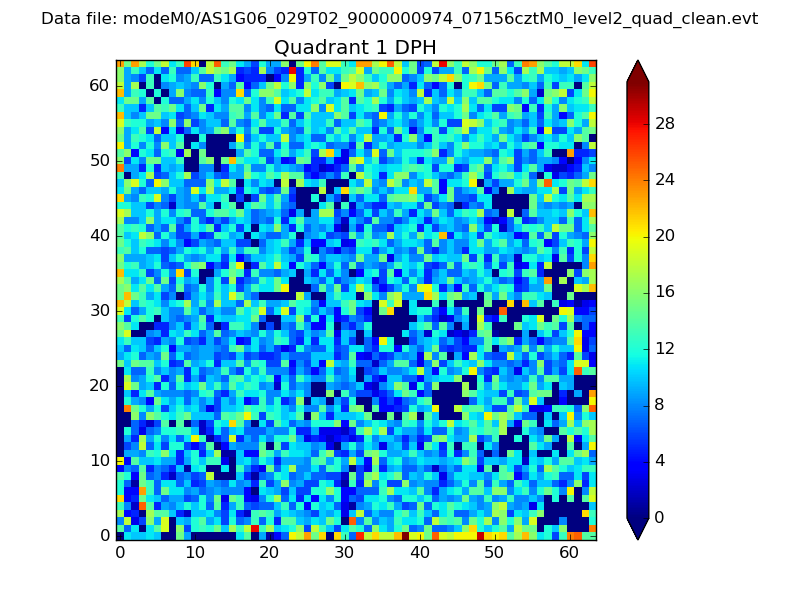 |
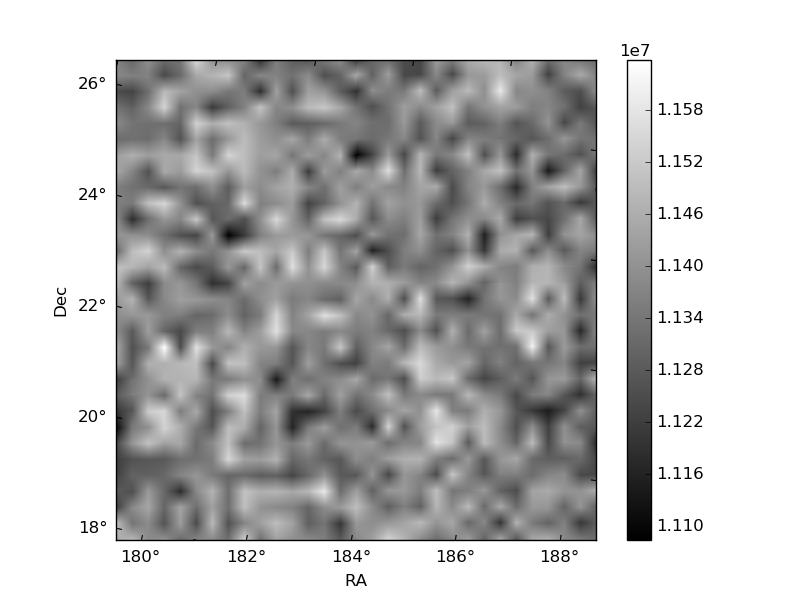
Quadrant B |
|---|---|---|---|
| Quadrant D | 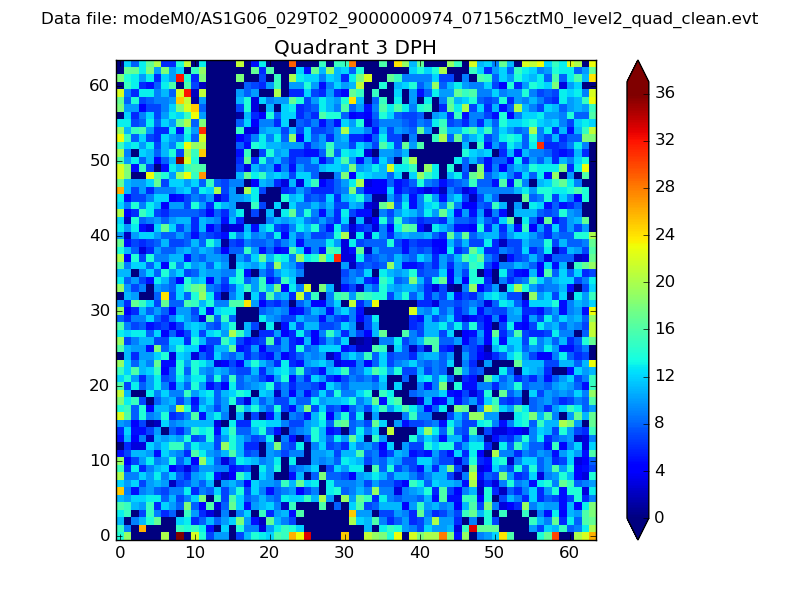 |
 |
Quadrant C |
| Plot type | Count rate plots | Images |
|---|---|---|
| Comparison with Poisson distribution Blue bars denote a histogram of data divided into 1 sec bins. Red curve is a Poisson curve with rate = median count rate of data. |
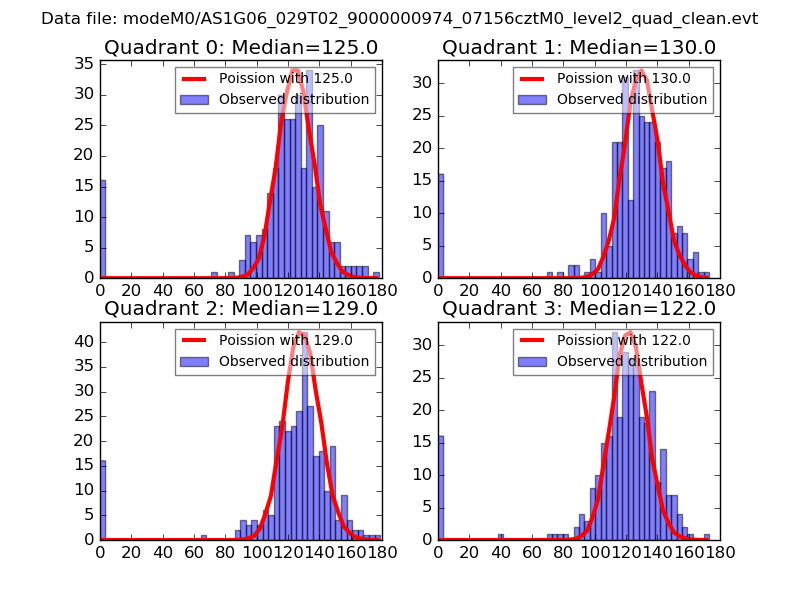 |
 |
| Quadrant-wise count rates Data is divided into 100 sec bins |
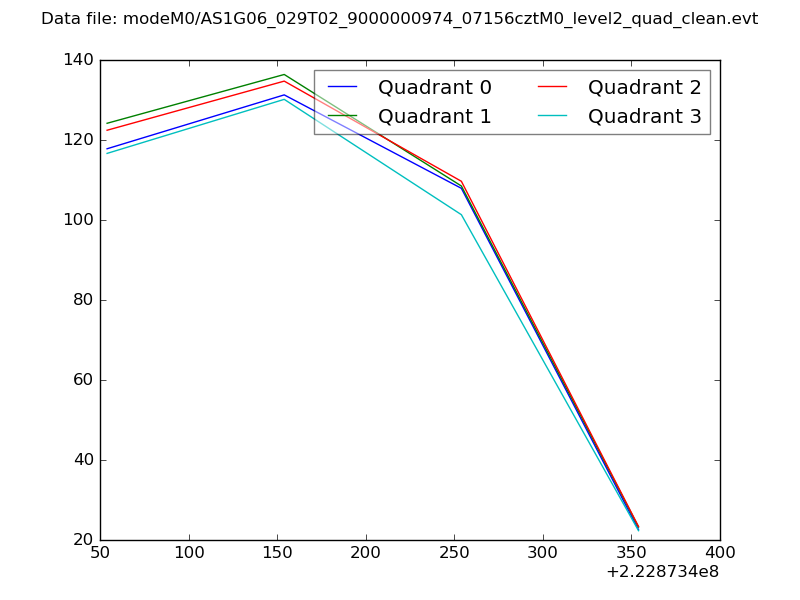 |
|
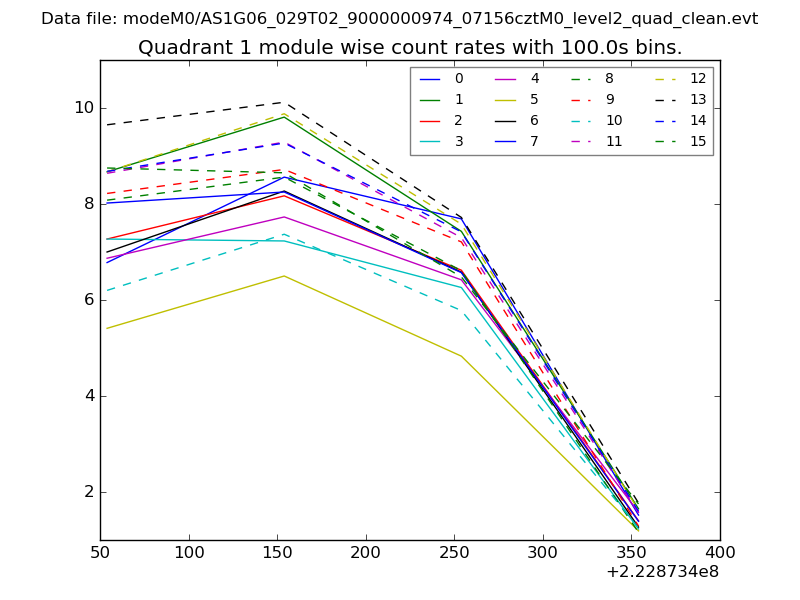
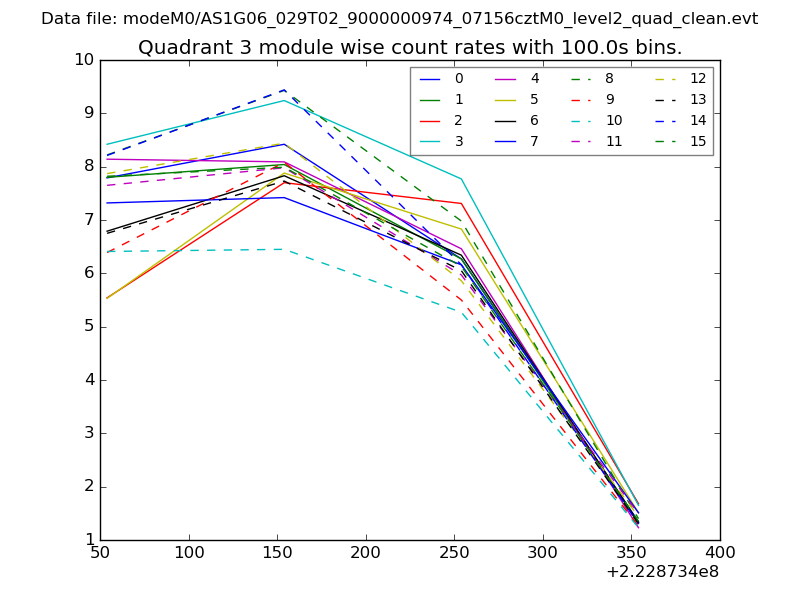
| Module-wise count rates for Quadrant A Data is divided into 100 sec bins |
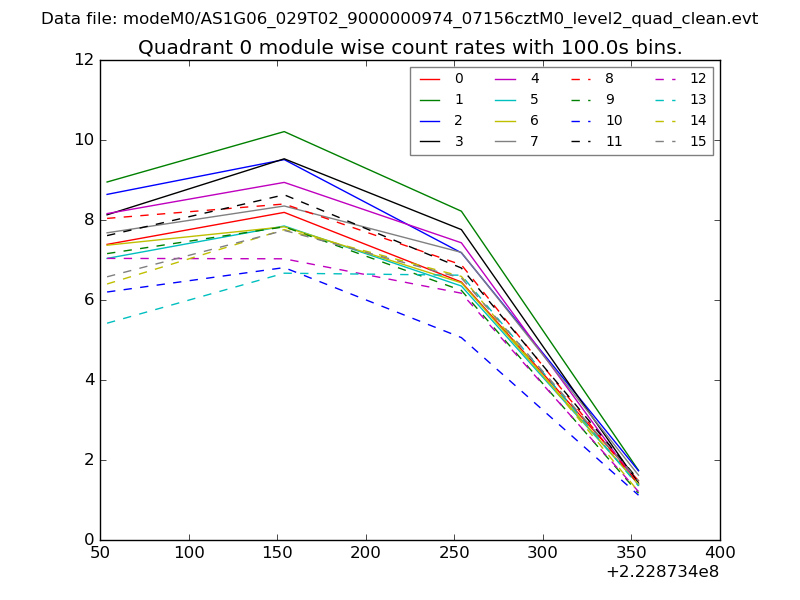 |
 |
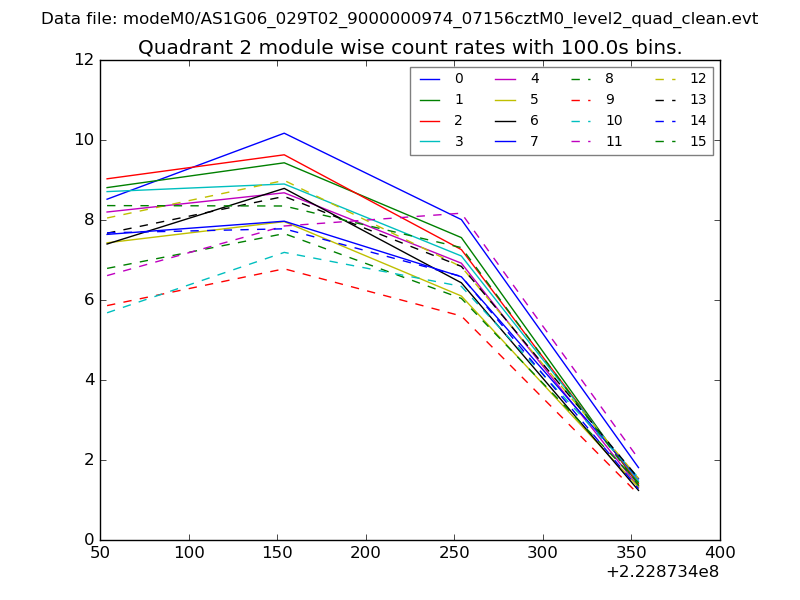
| Module-wise count rates for Quadrant B Data is divided into 100 sec bins |
 |
 |
| Module-wise count rates for Quadrant C Data is divided into 100 sec bins |
 |
 |
| Module-wise count rates for Quadrant D Data is divided into 100 sec bins |
 |
 |
| Parameter | Plot |
|---|---|
| CZT HV Monitor | 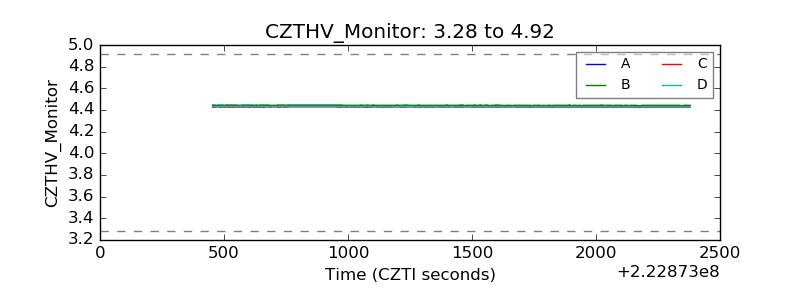 |
| D_VDD | 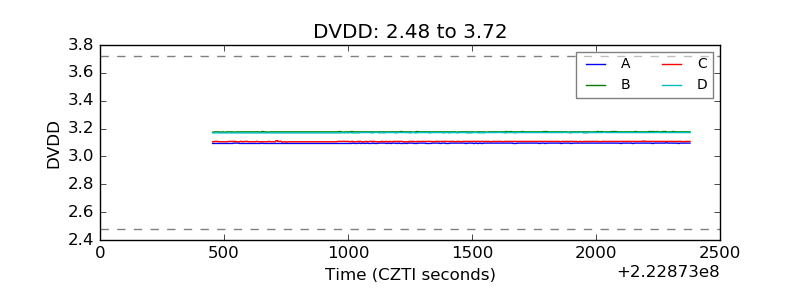 |
| Temperature 1 | 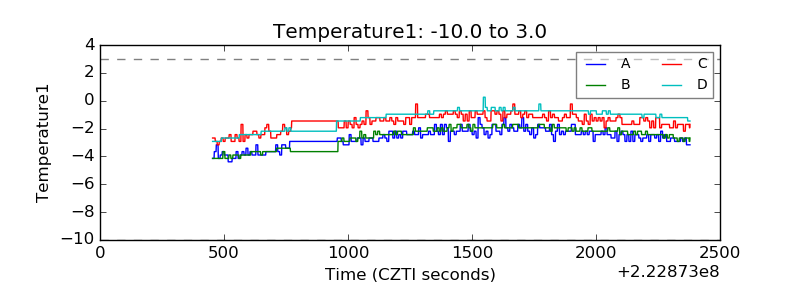 |
| Veto HV Monitor | 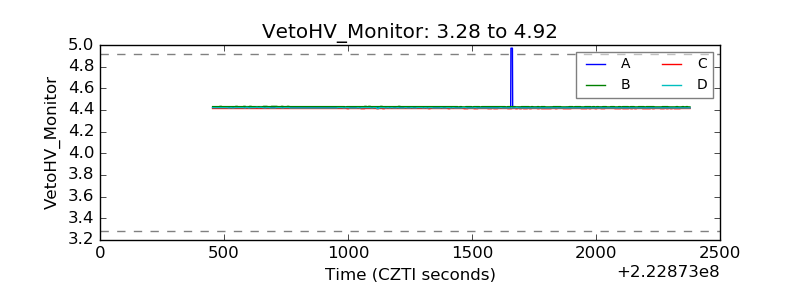 |
| Veto LLD | 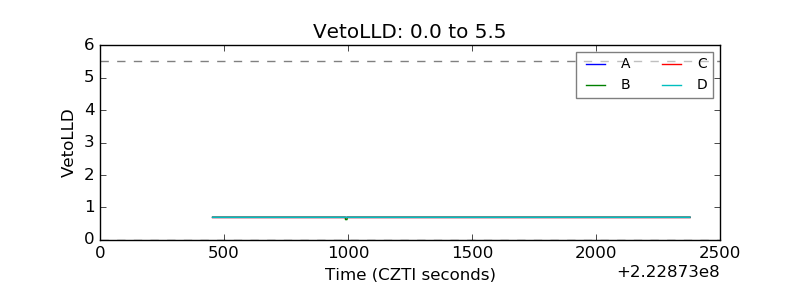 |
| Alpha Counter | 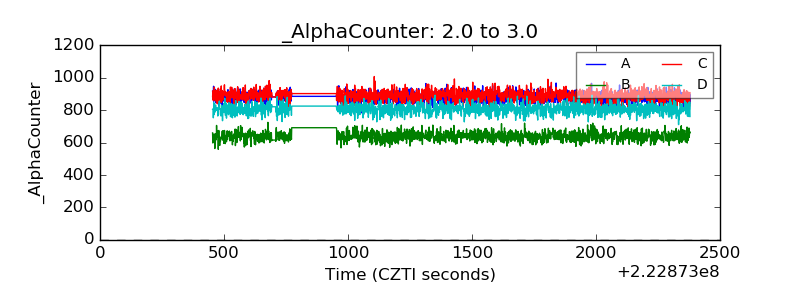 |
| _CPM_Rate | 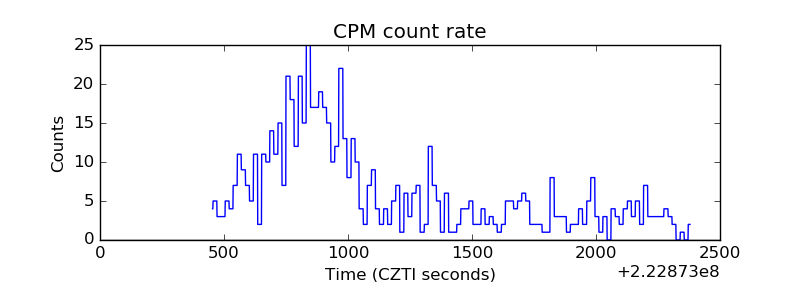 |
| CZT Counter | 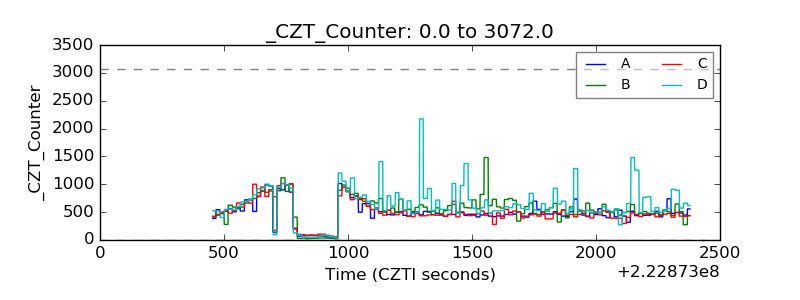 |
| +2.5 Volts monitor |  |
| +5 Volts monitor |  |
| _ROLL_ROT | 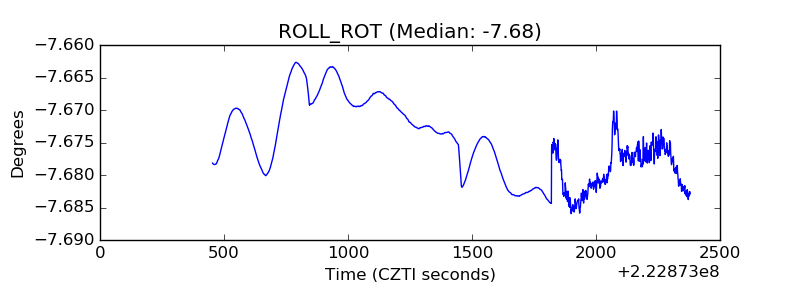 |
| _Roll_DEC | 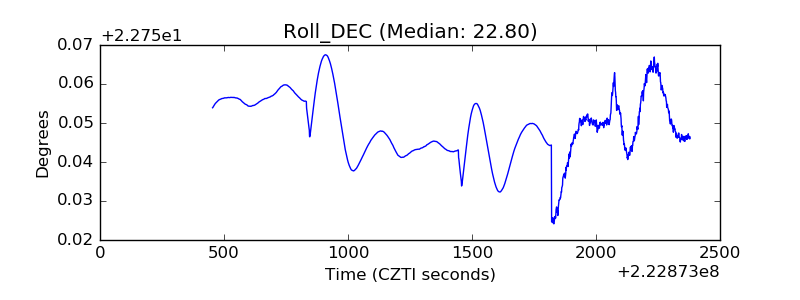 |
| _Roll_RA | 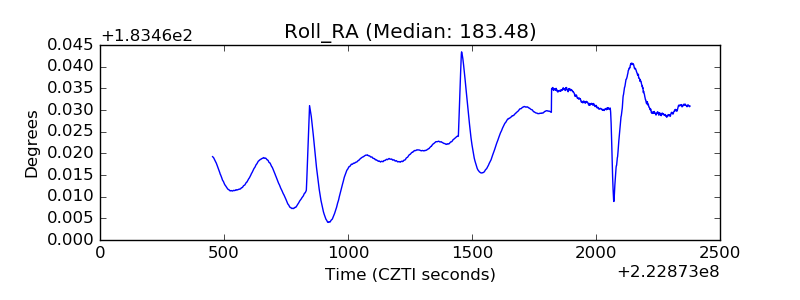 |
| Veto Counter | 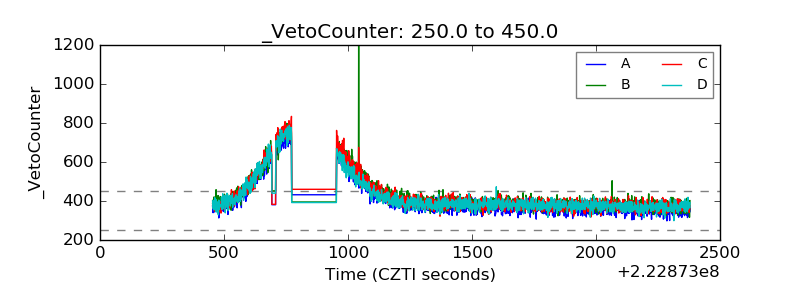 |