| Param | Original file | Final file |
|---|---|---|
| Filename | modeM0/AS1G06_029T02_9000000974_07158cztM0_level2.evt | modeM0/AS1G06_029T02_9000000974_07158cztM0_level2_quad_clean.evt |
| Size (bytes) | 1,240,928,640 | 215,550,720 |
| Size | 1.2 GB | 205.6 MB |
| Events in quadrant A | 8,120,469 | 1,337,967 |
| Events in quadrant B | 8,583,341 | 1,350,513 |
| Events in quadrant C | 8,027,048 | 1,336,618 |
| Events in quadrant D | 11,633,053 | 1,262,362 |
| Mode M9 | |||
|---|---|---|---|
| Quadrant | BADHDUFLAG | Total packets | Discarded packets |
| A | 0 | 19 | 0 |
| B | 0 | 19 | 0 |
| C | 0 | 19 | 0 |
| D | 0 | 19 | 0 |
| Mode SS | |||
|---|---|---|---|
| Quadrant | BADHDUFLAG | Total packets | Discarded packets |
| A | 0 | 366 | 0 |
| B | 0 | 366 | 0 |
| C | 0 | 366 | 0 |
| D | 0 | 366 | 0 |
| Mode M0 | |||
|---|---|---|---|
| Quadrant | BADHDUFLAG | Total packets | Discarded packets |
| A | 0 | 36690 | 4 |
| B | 0 | 37717 | 3 |
| C | 0 | 36691 | 3 |
| D | 0 | 46605 | 3 |
| Quadrant | Total seconds | Saturated seconds | Saturation percentage |
|---|---|---|---|
| A | 18005 | 155 | 0.860872% |
| B | 18005 | 182 | 1.010830% |
| C | 18005 | 145 | 0.805332% |
| D | 18005 | 765 | 4.248820% |
Noise dominated data is calculated using 1-second bins in cleaned event files. If a bin has >2000 counts, and if more than 50% of those come from <1% of pixels, then it is considered to be noise-dominated and hence unusable.
| Quadrant | # 1 sec bins | Bins with >0 counts | Bins with >2000 counts | High rate bins dominated by noise | Noise dominated (total time) | Noise dominated (detector-on time) | Marked lightcurve |
|---|---|---|---|---|---|---|---|
| A | 19855 | 18005 | 3 | 3 | 0.02% | 0.02% | 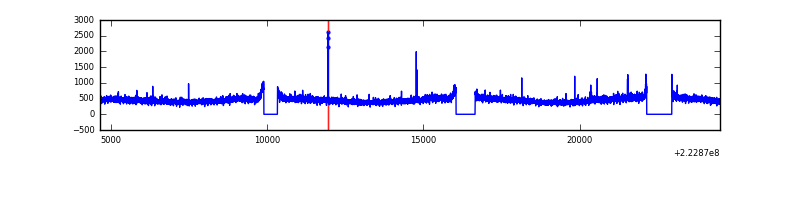 |
| B | 19855 | 18005 | 7 | 7 | 0.04% | 0.04% | 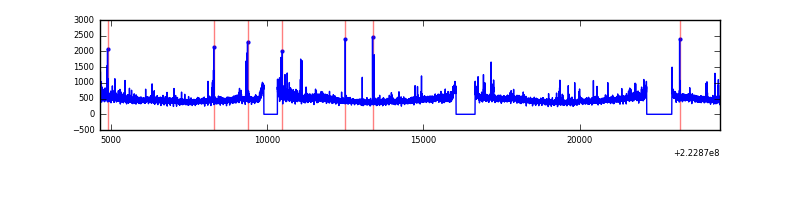 |
| C | 19855 | 18005 | 3 | 3 | 0.02% | 0.02% | 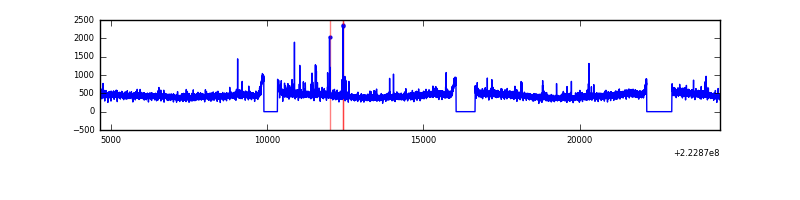 |
| D | 19855 | 18005 | 493 | 493 | 2.48% | 2.74% | 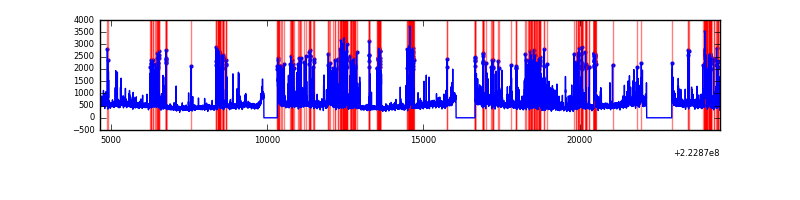 |
Top three noisy pixels from each quadrant. If the there are fewer than three noisy pixels in the level2.evt file, extra rows are filled as -1
| Pixel properties | Quadrant properties | ||||||
|---|---|---|---|---|---|---|---|
| Quadrant | DetID | PixID | Counts | Sigma | Mean | Median | Sigma |
| A | 8 | 15 | 57687 | 131.19 | 2083 | 2034 | 424.2 |
| A | 13 | 248 | 26900 | 58.62 | 2083 | 2034 | 424.2 |
| A | 0 | 226 | 20035 | 42.43 | 2083 | 2034 | 424.2 |
| B | 0 | 214 | 156513 | 383.8 | 2097 | 2043 | 402.5 |
| B | 0 | 219 | 144515 | 353.99 | 2097 | 2043 | 402.5 |
| B | 4 | 81 | 75359 | 182.16 | 2097 | 2043 | 402.5 |
| C | 4 | 254 | 97785 | 203.68 | 2024 | 2033 | 470.1 |
| C | 13 | 61 | 15821 | 29.33 | 2024 | 2033 | 470.1 |
| C | 8 | 128 | 14361 | 26.22 | 2024 | 2033 | 470.1 |
| D | 2 | 216 | 2049124 | 4180.46 | 1999 | 1934 | 489.7 |
| D | 2 | 14 | 898617 | 1831.07 | 1999 | 1934 | 489.7 |
| D | 8 | 195 | 831748 | 1694.52 | 1999 | 1934 | 489.7 |
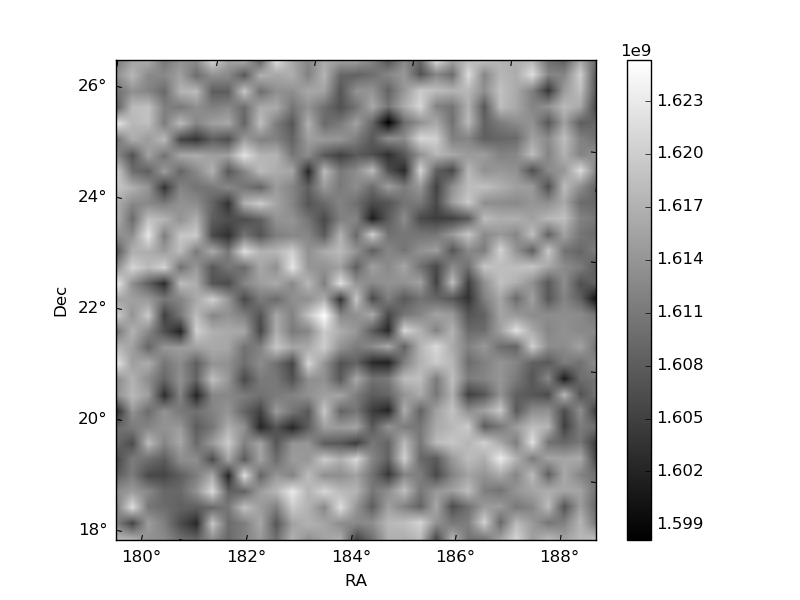
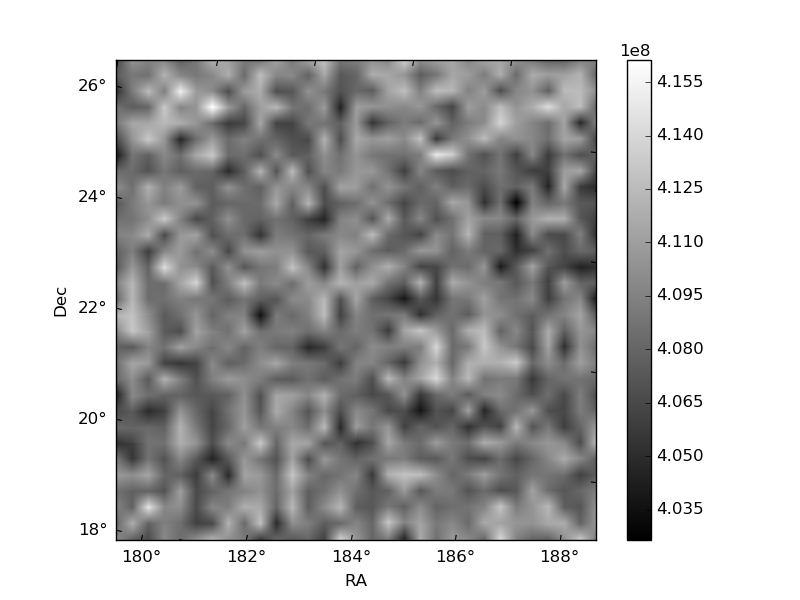
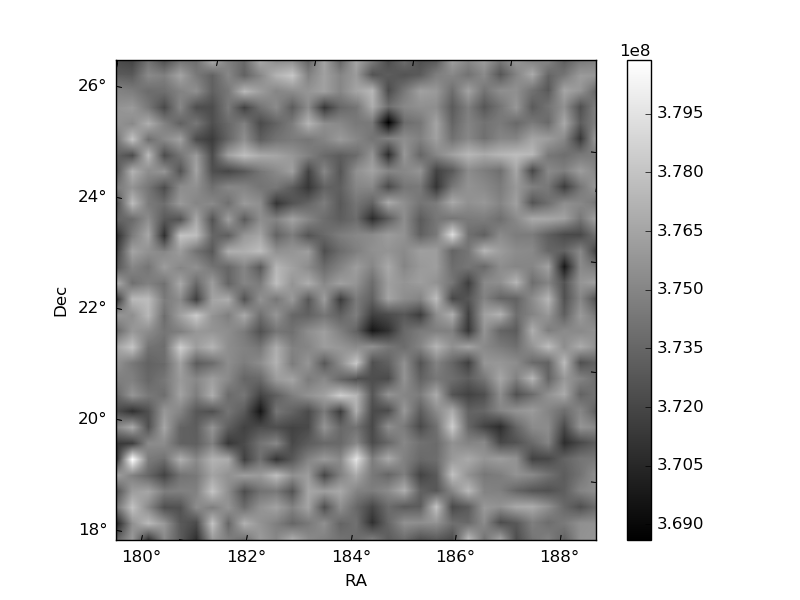
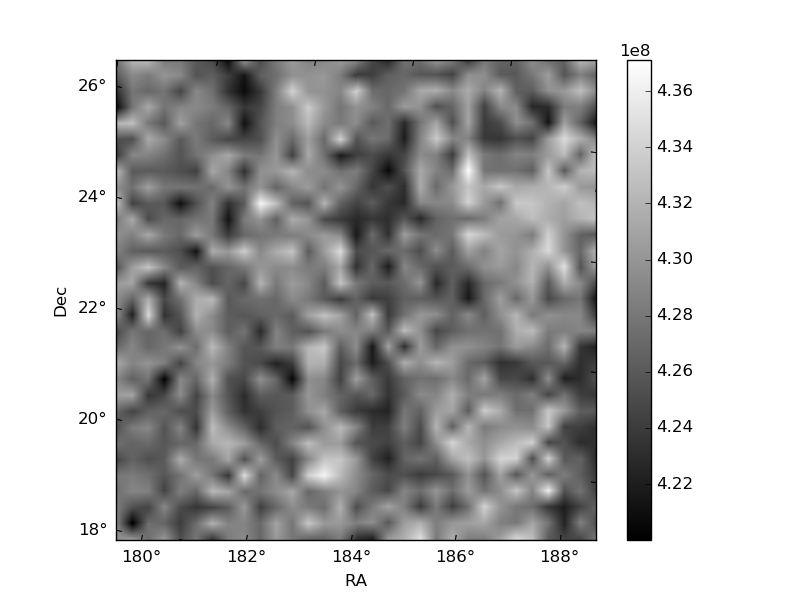
Histogram calculated using DETX and DETY for each event in the final _common_clean file
| Quadrant A | 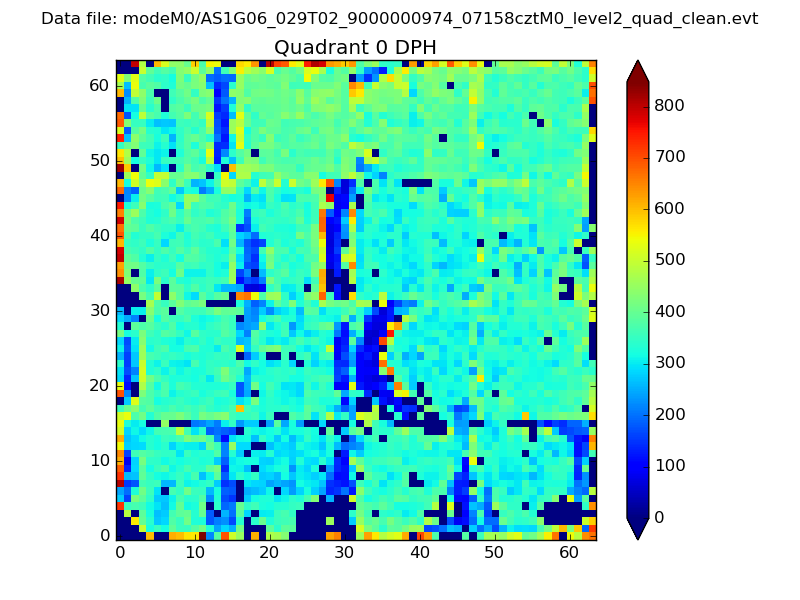 |
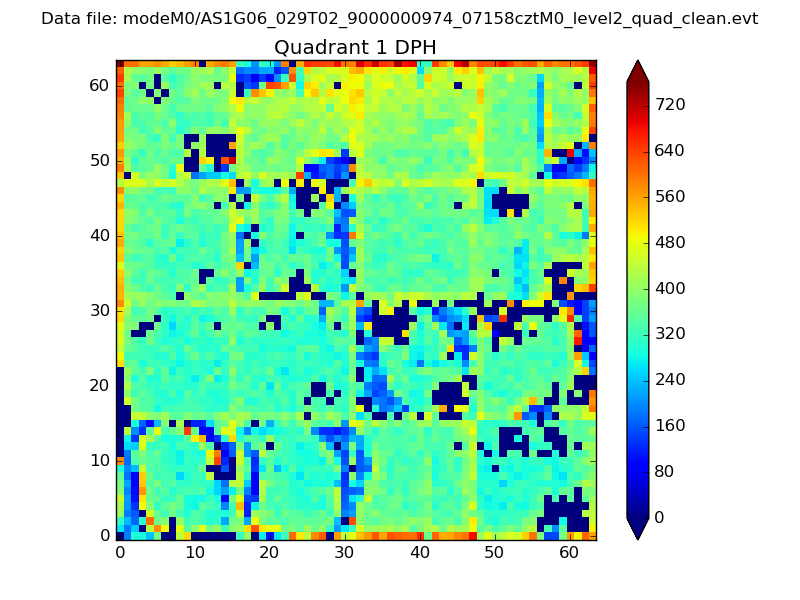 |
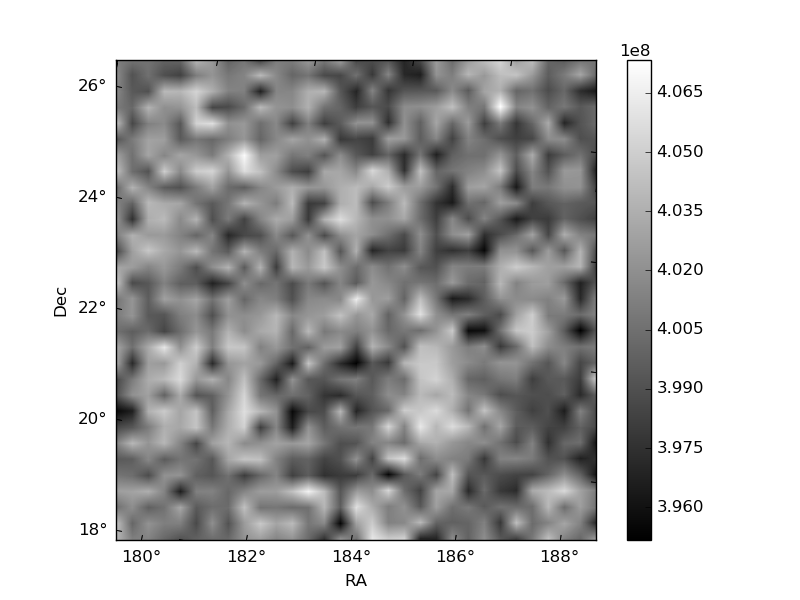
Quadrant B |
|---|---|---|---|
| Quadrant D | 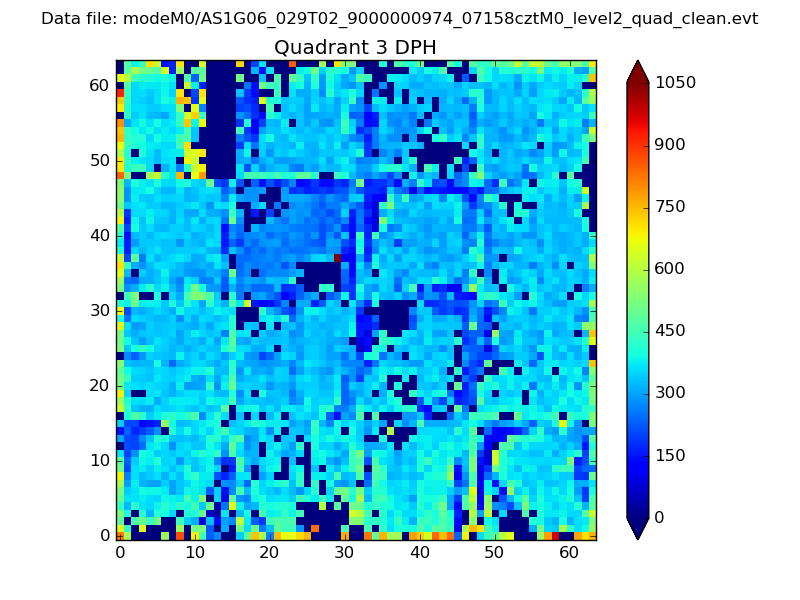 |
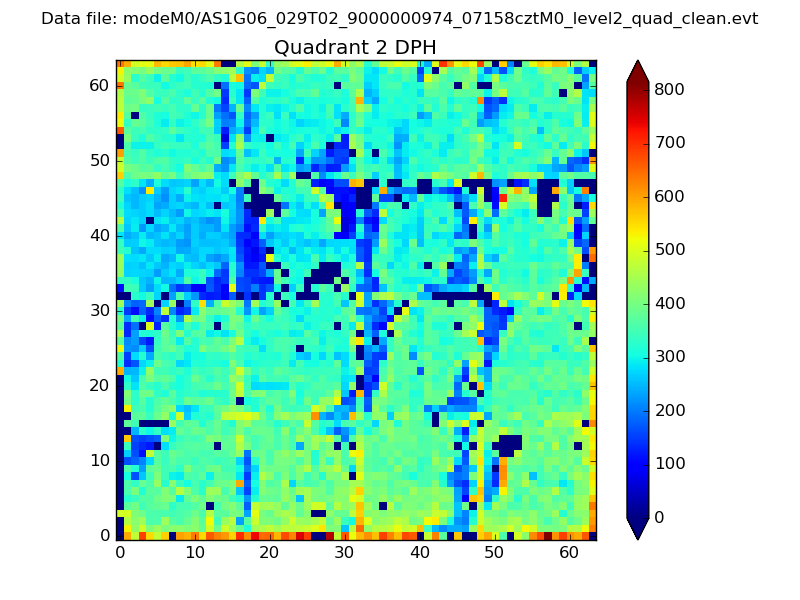 |
Quadrant C |
| Plot type | Count rate plots | Images |
|---|---|---|
| Comparison with Poisson distribution Blue bars denote a histogram of data divided into 1 sec bins. Red curve is a Poisson curve with rate = median count rate of data. |
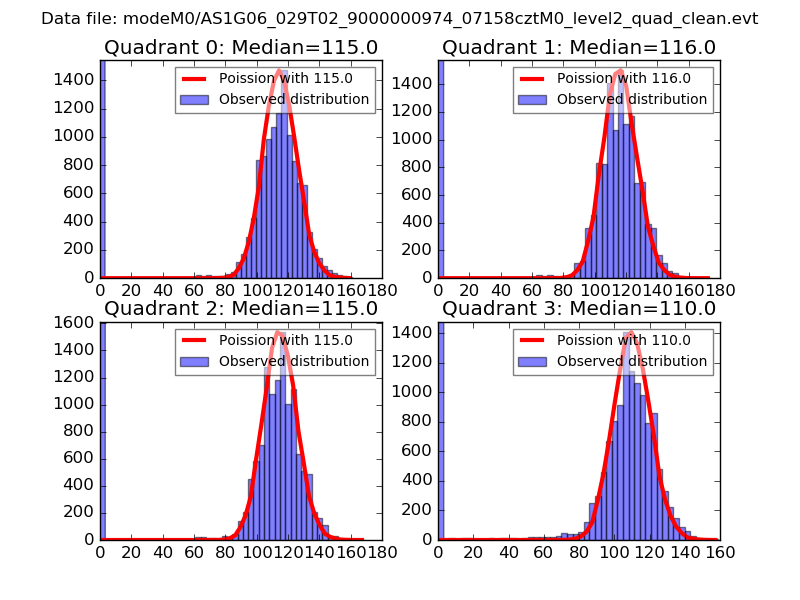 |
 |
| Quadrant-wise count rates Data is divided into 100 sec bins |
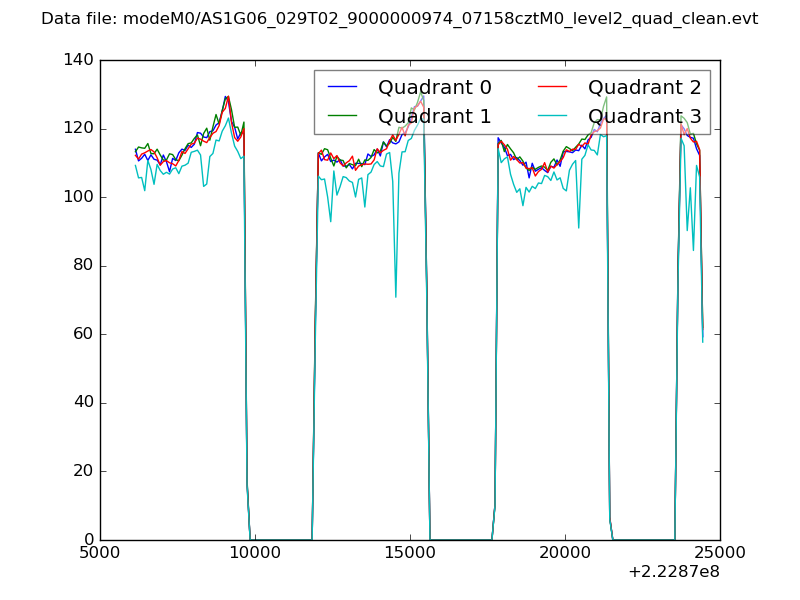 |
|
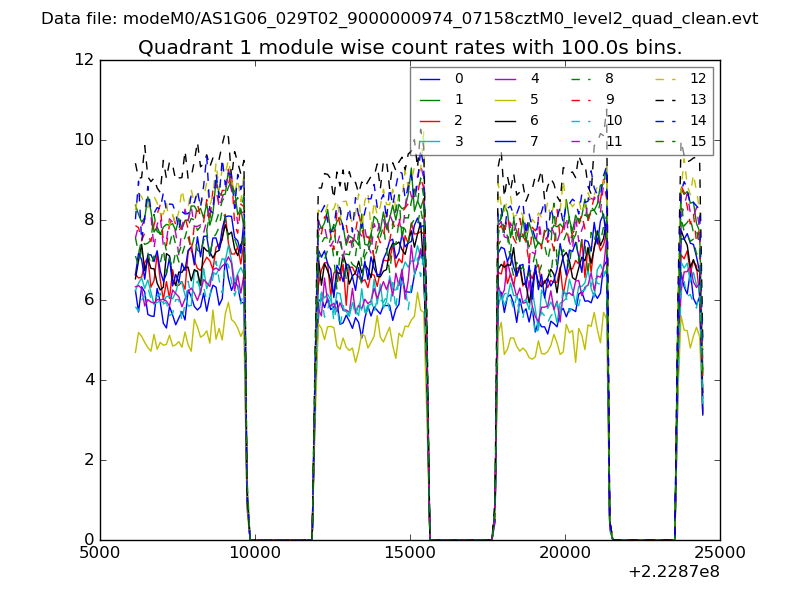
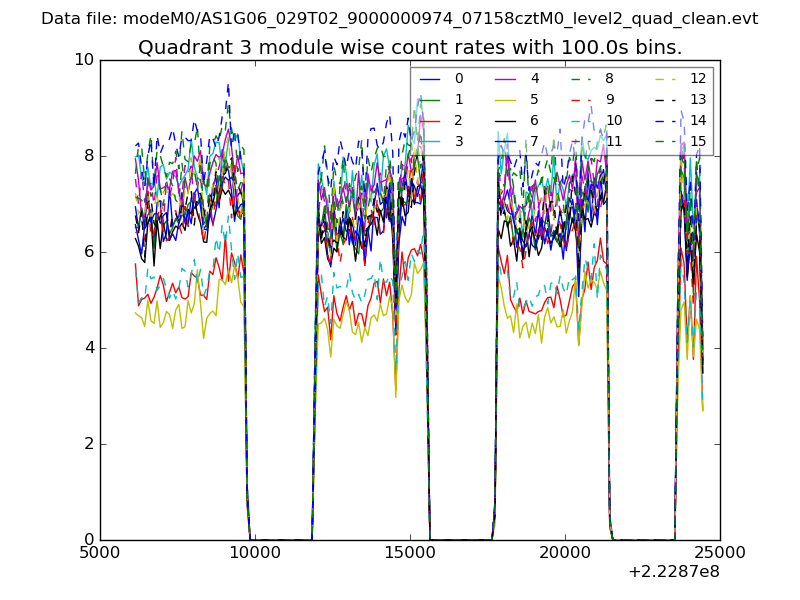
| Module-wise count rates for Quadrant A Data is divided into 100 sec bins |
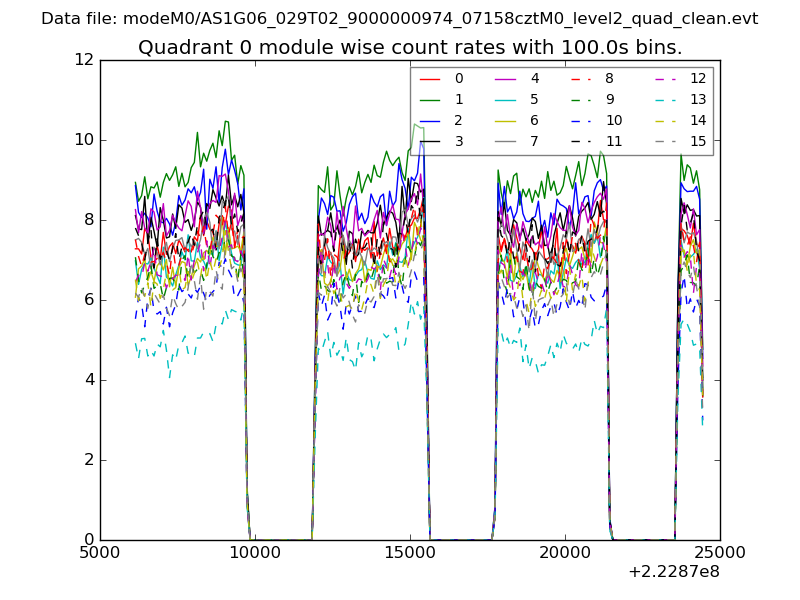 |
 |
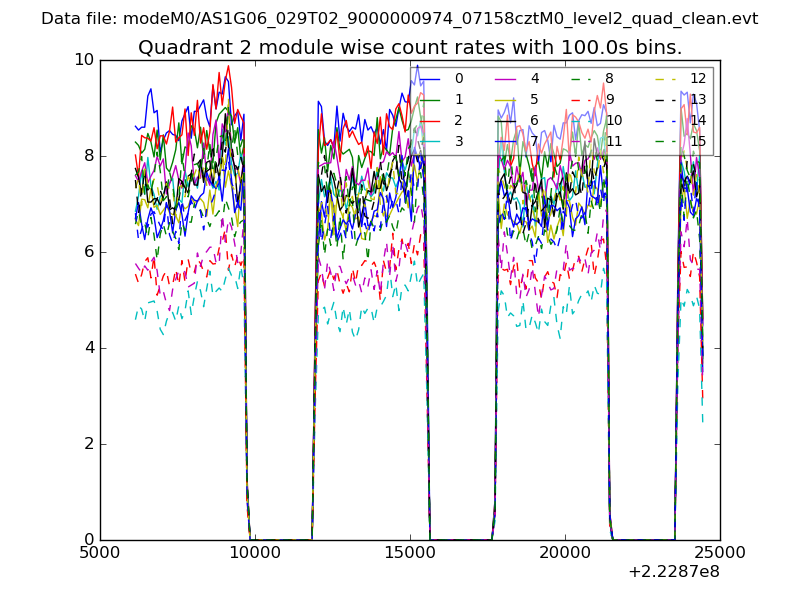
| Module-wise count rates for Quadrant B Data is divided into 100 sec bins |
 |
 |
| Module-wise count rates for Quadrant C Data is divided into 100 sec bins |
 |
 |
| Module-wise count rates for Quadrant D Data is divided into 100 sec bins |
 |
 |
| Parameter | Plot |
|---|---|
| CZT HV Monitor | 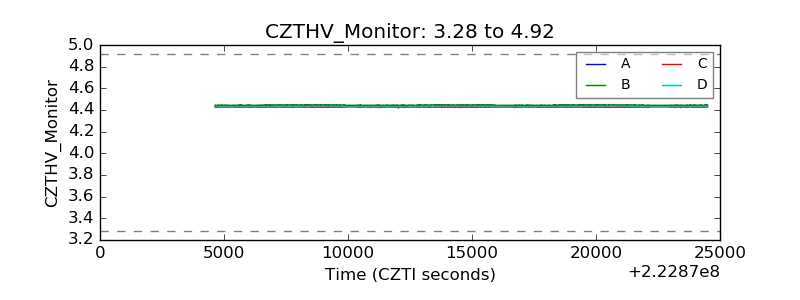 |
| D_VDD | 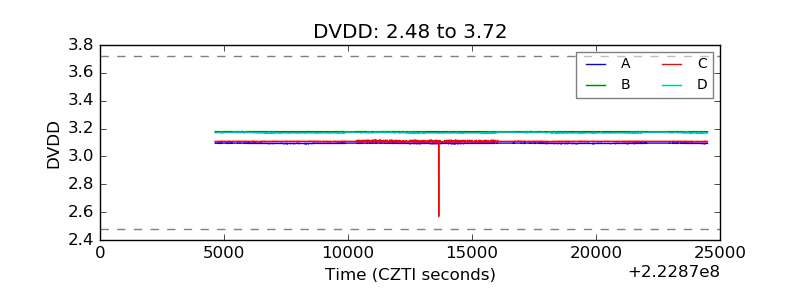 |
| Temperature 1 | 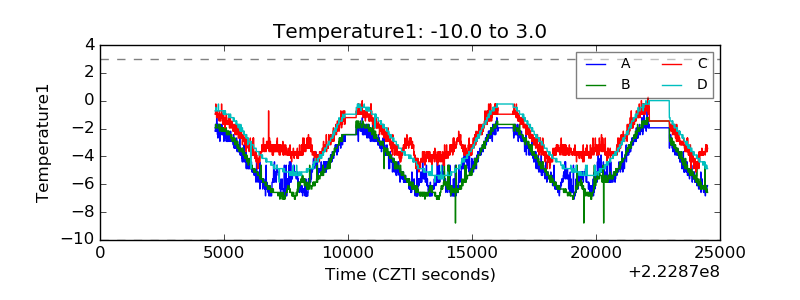 |
| Veto HV Monitor | 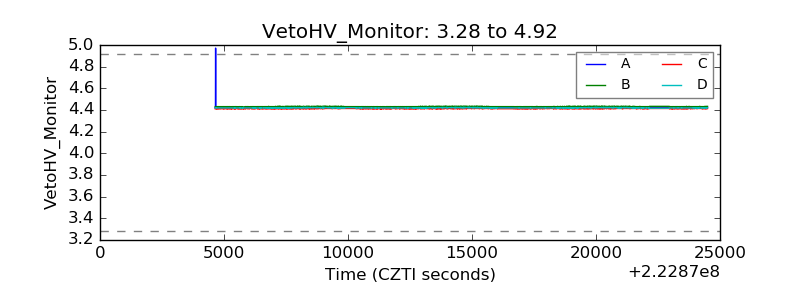 |
| Veto LLD | 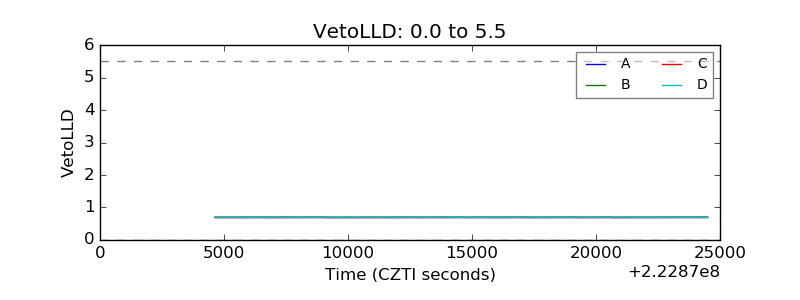 |
| Alpha Counter | 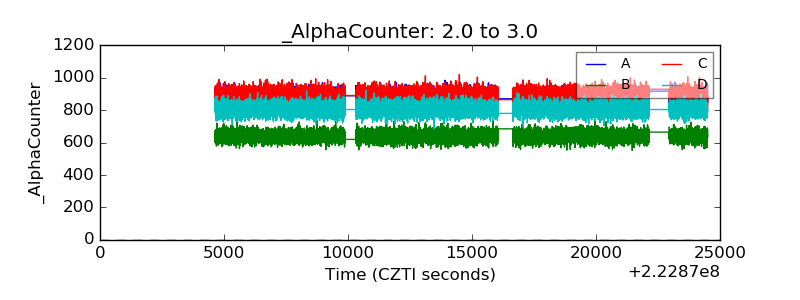 |
| _CPM_Rate | 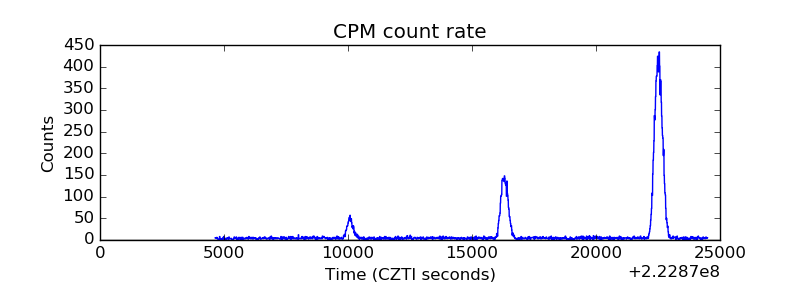 |
| CZT Counter | 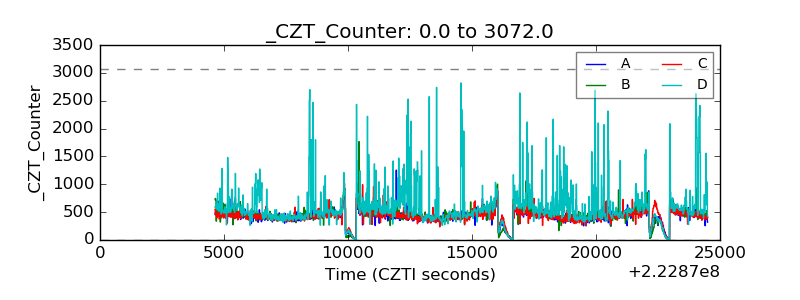 |
| +2.5 Volts monitor |  |
| +5 Volts monitor |  |
| _ROLL_ROT | 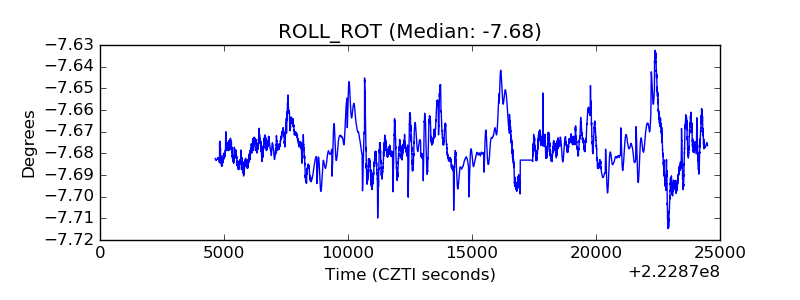 |
| _Roll_DEC | 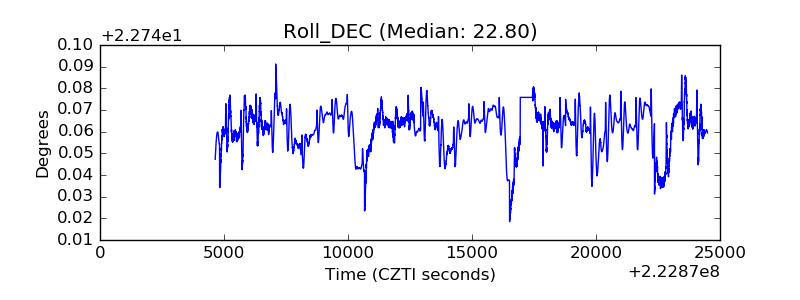 |
| _Roll_RA | 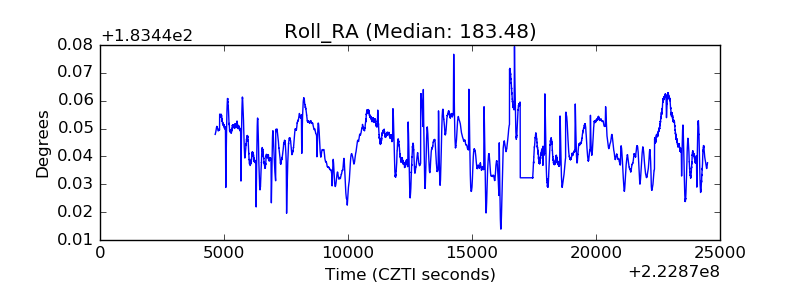 |
| Veto Counter | 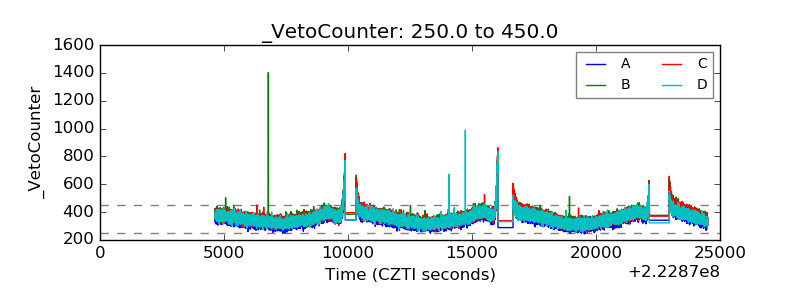 |