| Param | Original file | Final file |
|---|---|---|
| Filename | modeM0/AS1G06_029T02_9000000974_07160cztM0_level2.evt | modeM0/AS1G06_029T02_9000000974_07160cztM0_level2_quad_clean.evt |
| Size (bytes) | 290,600,640 | 51,327,360 |
| Size | 277.1 MB | 48.9 MB |
| Events in quadrant A | 1,836,421 | 322,122 |
| Events in quadrant B | 1,938,618 | 329,562 |
| Events in quadrant C | 2,205,260 | 313,573 |
| Events in quadrant D | 2,546,837 | 305,932 |
| Mode M9 | |||
|---|---|---|---|
| Quadrant | BADHDUFLAG | Total packets | Discarded packets |
| A | 0 | 9 | 0 |
| B | 0 | 9 | 0 |
| C | 0 | 9 | 0 |
| D | 0 | 9 | 0 |
| Mode SS | |||
|---|---|---|---|
| Quadrant | BADHDUFLAG | Total packets | Discarded packets |
| A | 0 | 84 | 0 |
| B | 0 | 84 | 0 |
| C | 0 | 84 | 0 |
| D | 0 | 84 | 0 |
| Mode M0 | |||
|---|---|---|---|
| Quadrant | BADHDUFLAG | Total packets | Discarded packets |
| A | 0 | 8250 | 1 |
| B | 0 | 8650 | 1 |
| C | 0 | 9358 | 1 |
| D | 0 | 10369 | 1 |
| Quadrant | Total seconds | Saturated seconds | Saturation percentage |
|---|---|---|---|
| A | 4001 | 24 | 0.599850% |
| B | 4001 | 52 | 1.299675% |
| C | 4001 | 156 | 3.899025% |
| D | 4001 | 113 | 2.824294% |
Noise dominated data is calculated using 1-second bins in cleaned event files. If a bin has >2000 counts, and if more than 50% of those come from <1% of pixels, then it is considered to be noise-dominated and hence unusable.
| Quadrant | # 1 sec bins | Bins with >0 counts | Bins with >2000 counts | High rate bins dominated by noise | Noise dominated (total time) | Noise dominated (detector-on time) | Marked lightcurve |
|---|---|---|---|---|---|---|---|
| A | 4951 | 4001 | 0 | 0 | 0.00% | 0.00% | 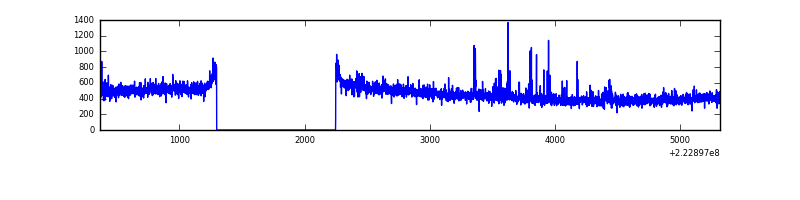 |
| B | 4951 | 4001 | 3 | 3 | 0.06% | 0.07% | 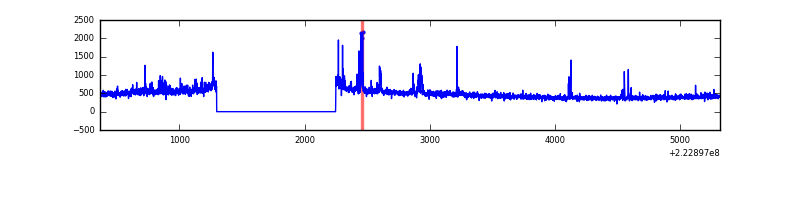 |
| C | 4951 | 4001 | 116 | 116 | 2.34% | 2.90% |  |
| D | 4951 | 4001 | 68 | 68 | 1.37% | 1.70% | 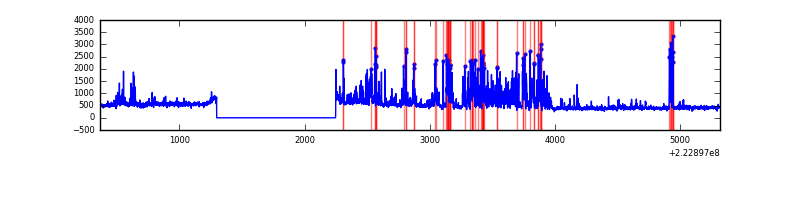 |
Top three noisy pixels from each quadrant. If the there are fewer than three noisy pixels in the level2.evt file, extra rows are filled as -1
| Pixel properties | Quadrant properties | ||||||
|---|---|---|---|---|---|---|---|
| Quadrant | DetID | PixID | Counts | Sigma | Mean | Median | Sigma |
| A | 8 | 15 | 39917 | 409.19 | 461 | 451 | 96.4 |
| A | 13 | 248 | 8838 | 86.96 | 461 | 451 | 96.4 |
| A | 14 | 238 | 6608 | 63.84 | 461 | 451 | 96.4 |
| B | 0 | 214 | 51468 | 557.76 | 467 | 454 | 91.5 |
| B | 4 | 81 | 37979 | 410.28 | 467 | 454 | 91.5 |
| B | 4 | 80 | 25327 | 271.95 | 467 | 454 | 91.5 |
| C | 4 | 254 | 469104 | 4470.1 | 442 | 445 | 104.8 |
| C | 9 | 68 | 9076 | 82.32 | 442 | 445 | 104.8 |
| C | 13 | 61 | 3473 | 28.88 | 442 | 445 | 104.8 |
| D | 2 | 216 | 517333 | 4716.44 | 443 | 429 | 109.6 |
| D | 8 | 195 | 157526 | 1433.42 | 443 | 429 | 109.6 |
| D | 2 | 14 | 126483 | 1150.17 | 443 | 429 | 109.6 |
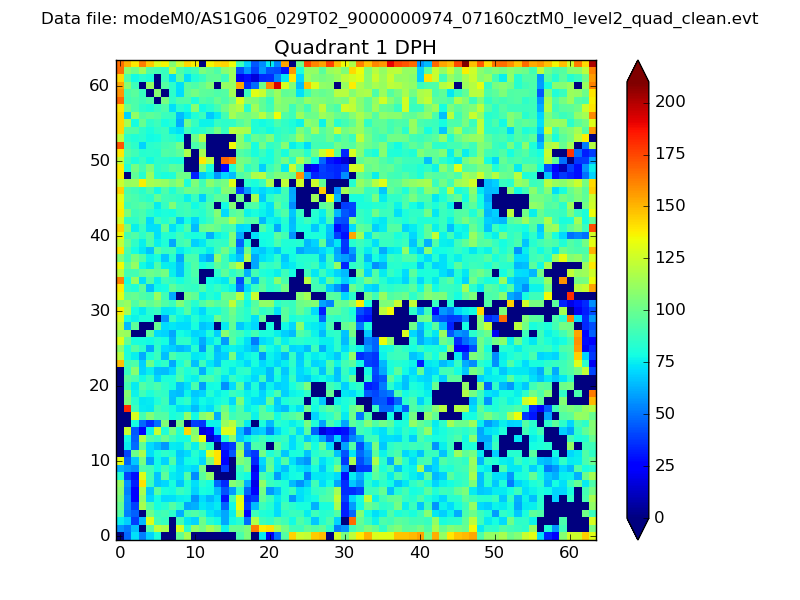
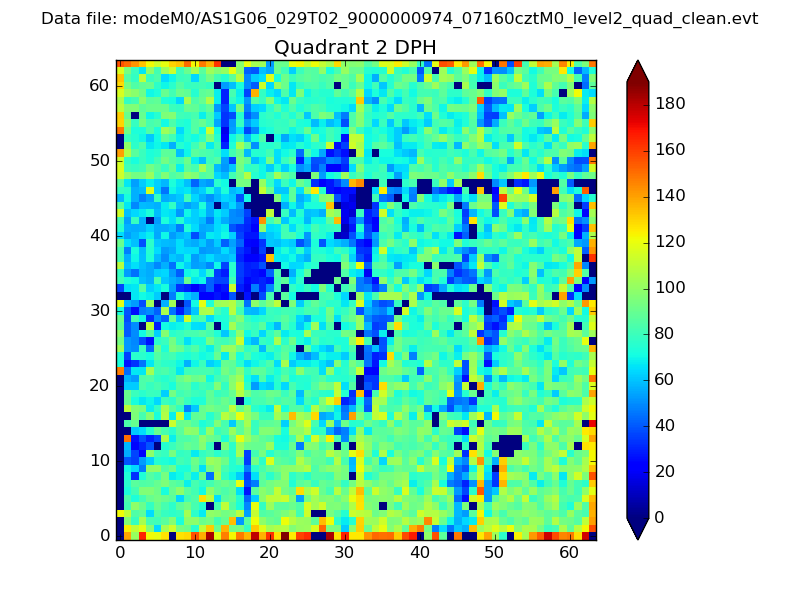
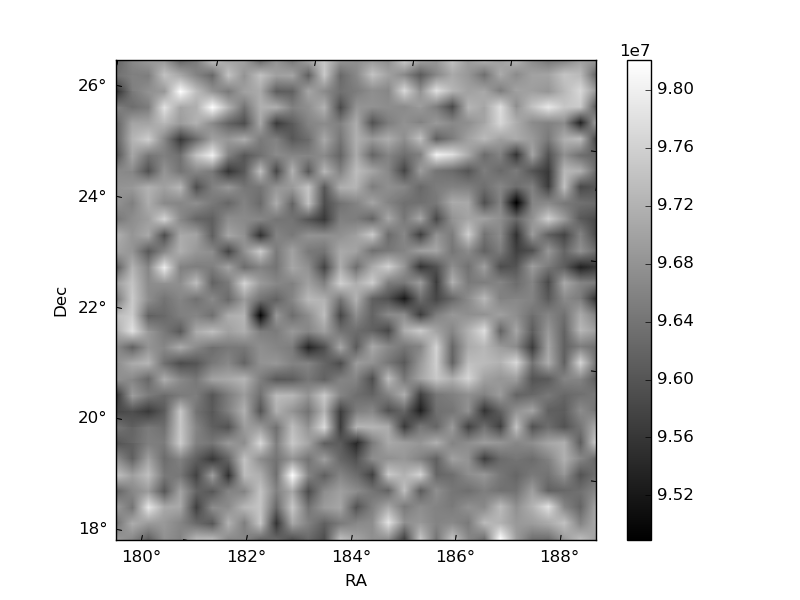
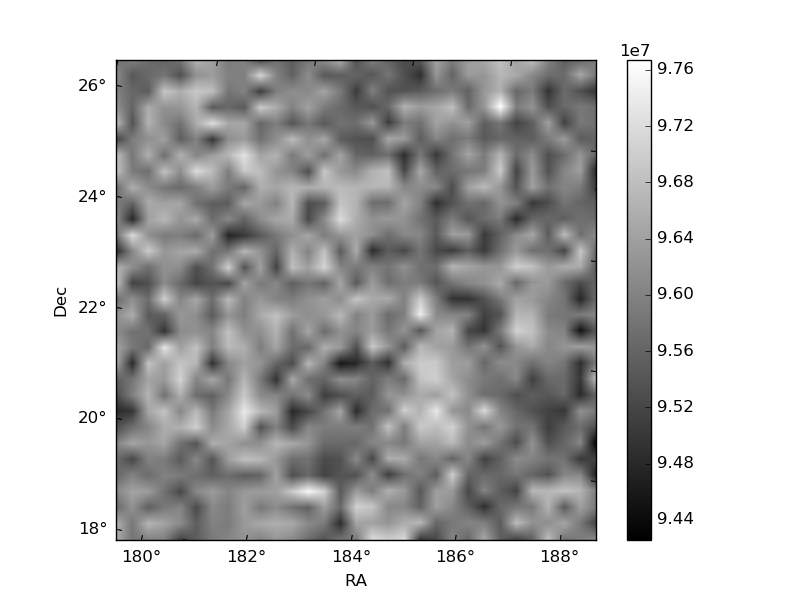
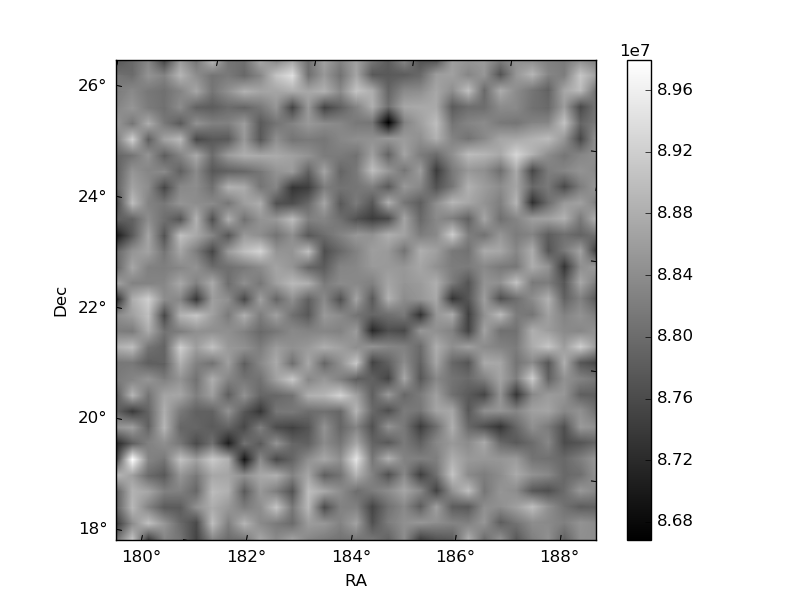
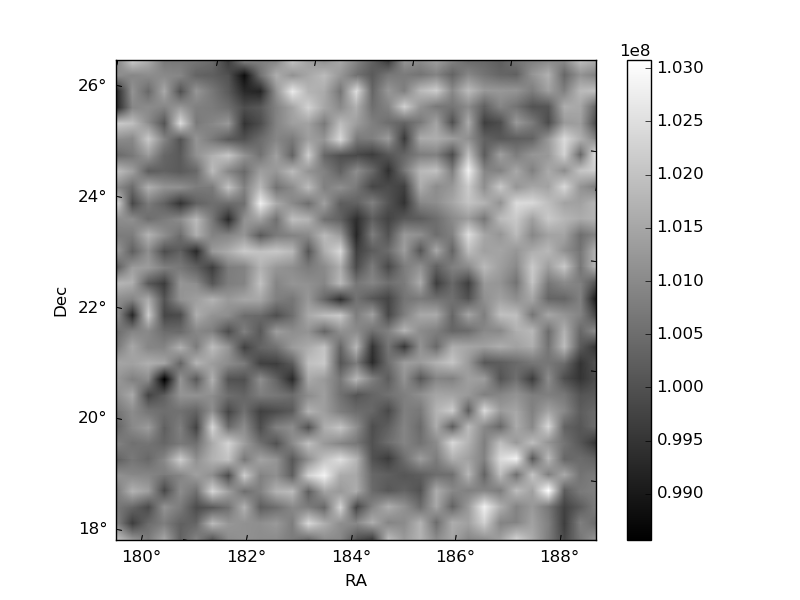
Histogram calculated using DETX and DETY for each event in the final _common_clean file
| Quadrant A |  |
 |
Quadrant B |
|---|---|---|---|
| Quadrant D | 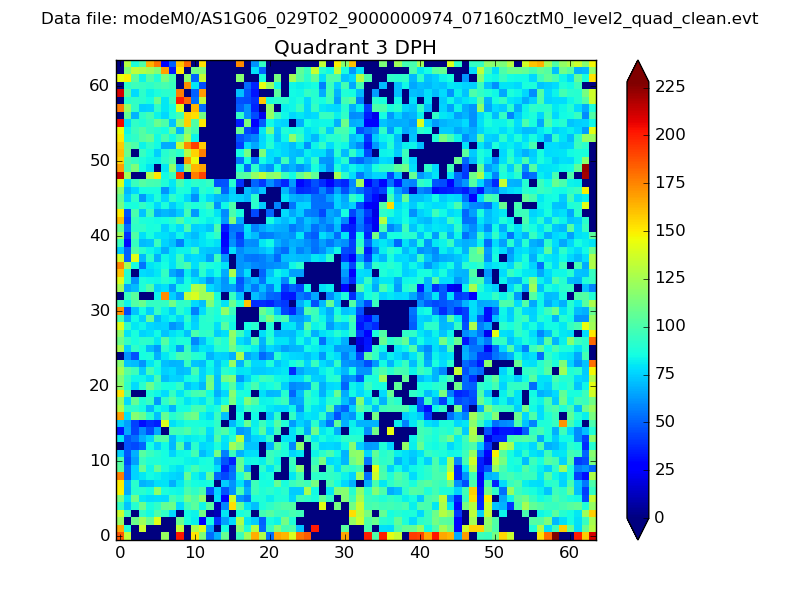 |
 |
Quadrant C |
| Plot type | Count rate plots | Images |
|---|---|---|
| Comparison with Poisson distribution Blue bars denote a histogram of data divided into 1 sec bins. Red curve is a Poisson curve with rate = median count rate of data. |
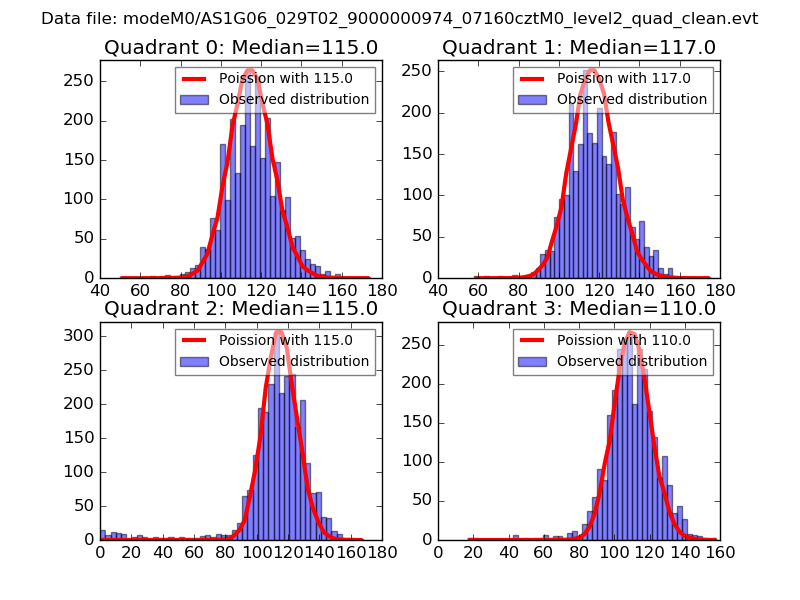 |
 |
| Quadrant-wise count rates Data is divided into 100 sec bins |
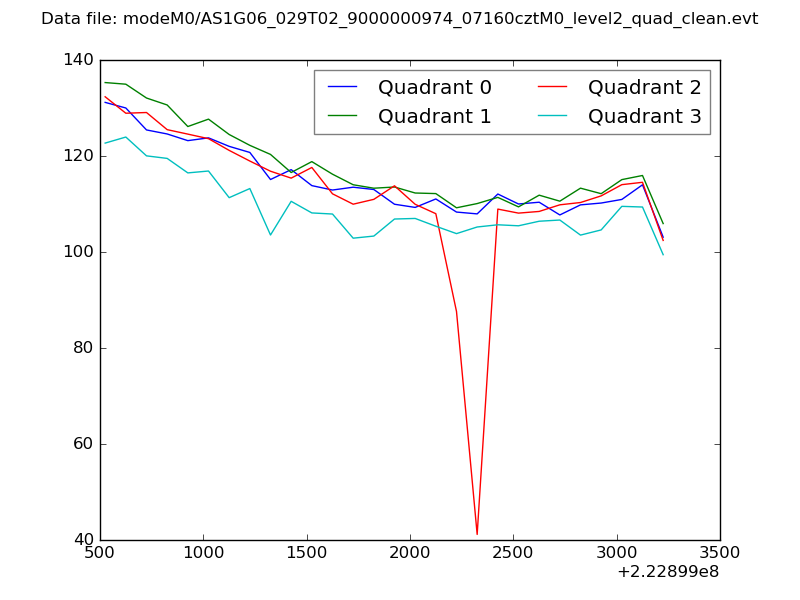 |
|
| Module-wise count rates for Quadrant A Data is divided into 100 sec bins |
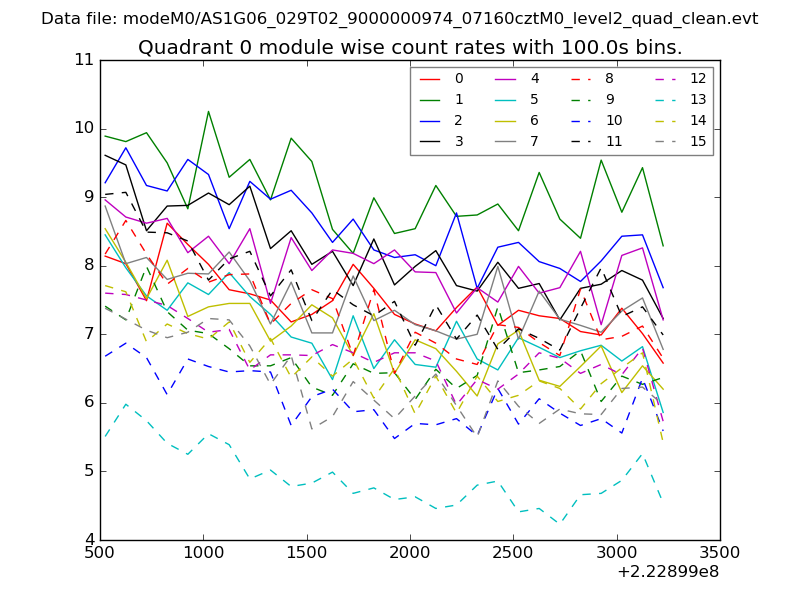 |
 |
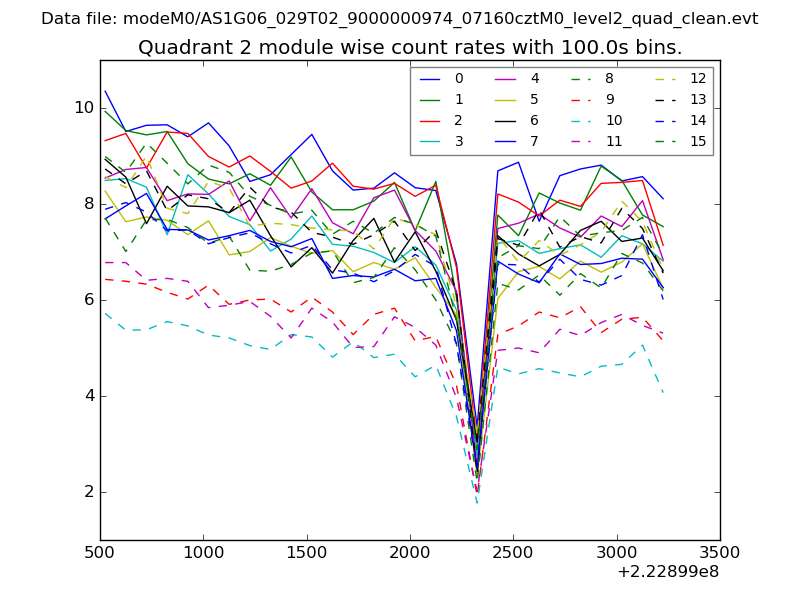
| Module-wise count rates for Quadrant B Data is divided into 100 sec bins |
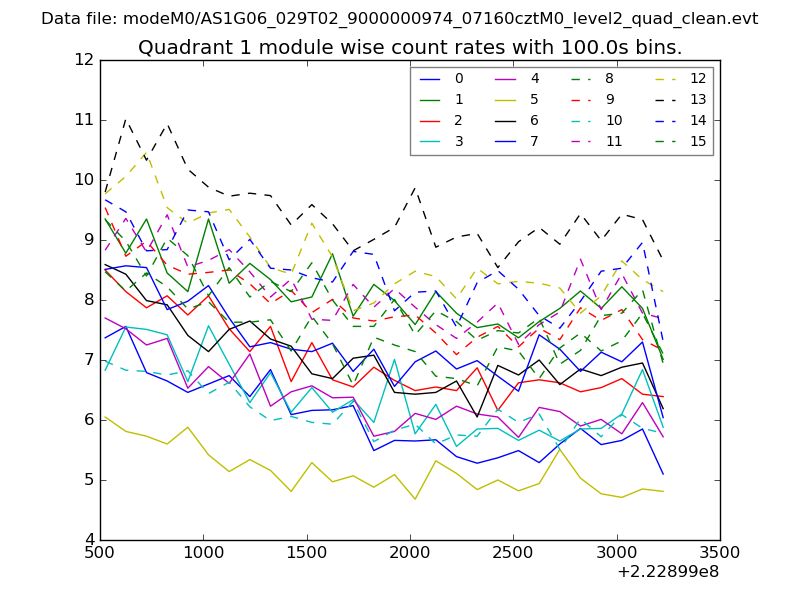 |
 |
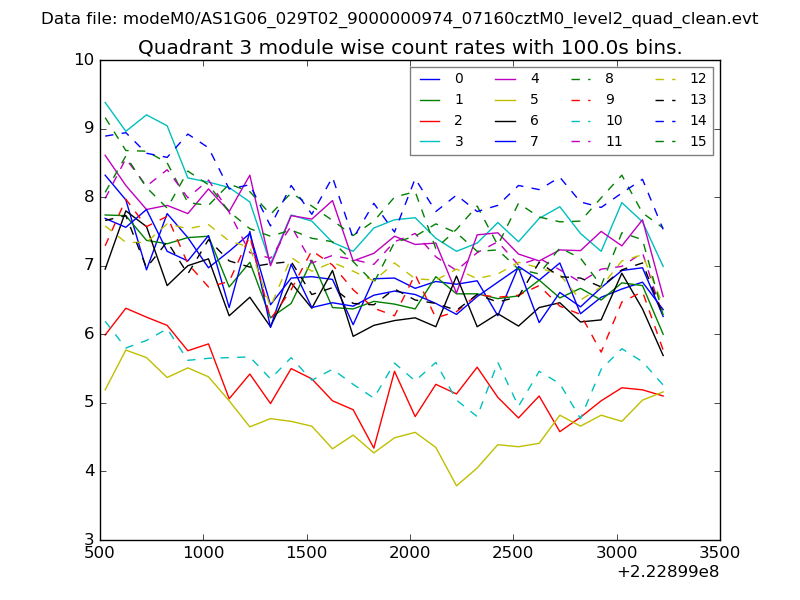
| Module-wise count rates for Quadrant C Data is divided into 100 sec bins |
 |
 |
| Module-wise count rates for Quadrant D Data is divided into 100 sec bins |
 |
 |
| Parameter | Plot |
|---|---|
| CZT HV Monitor | 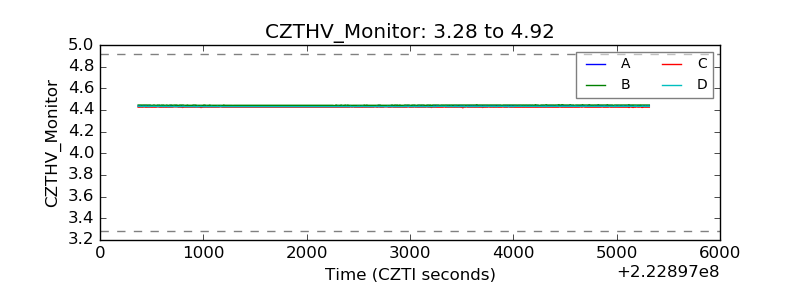 |
| D_VDD | 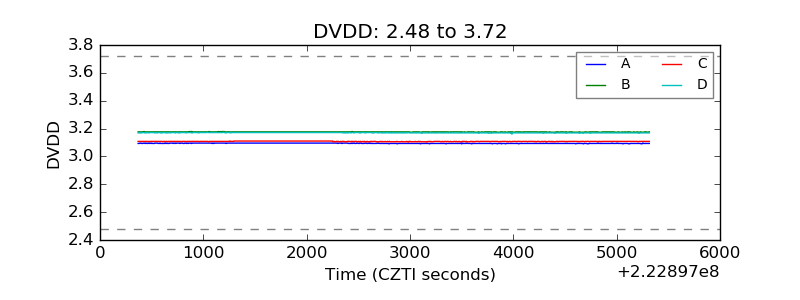 |
| Temperature 1 | 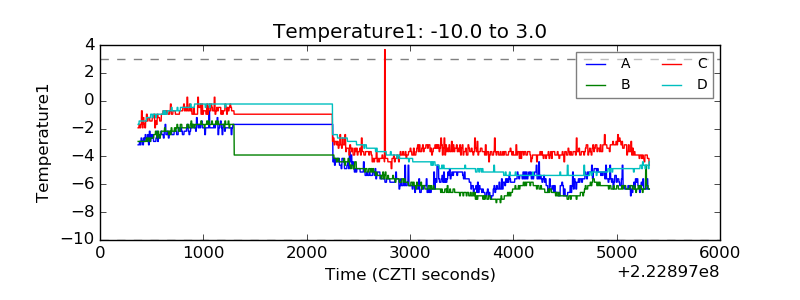 |
| Veto HV Monitor | 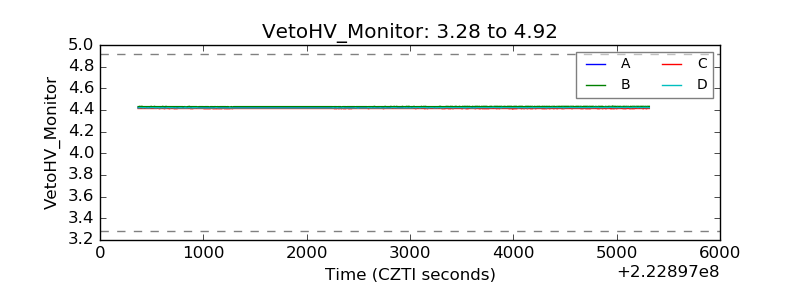 |
| Veto LLD | 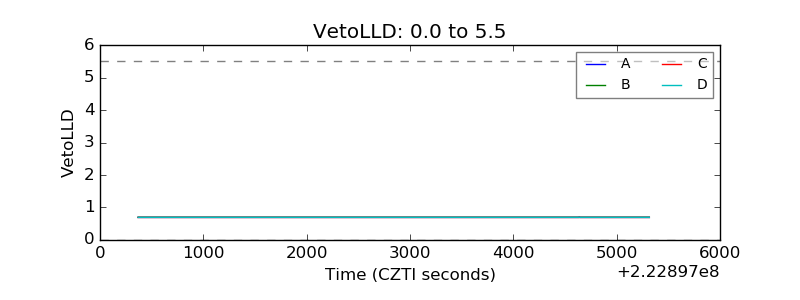 |
| Alpha Counter | 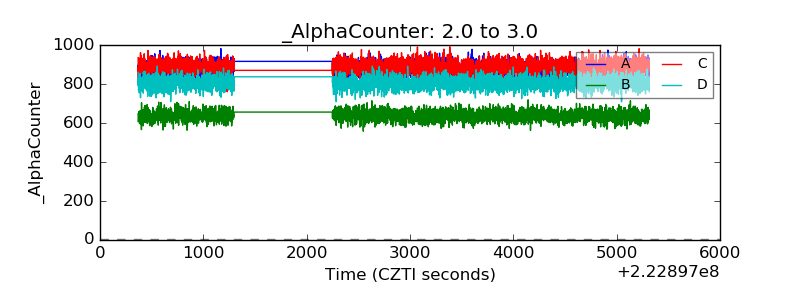 |
| _CPM_Rate | 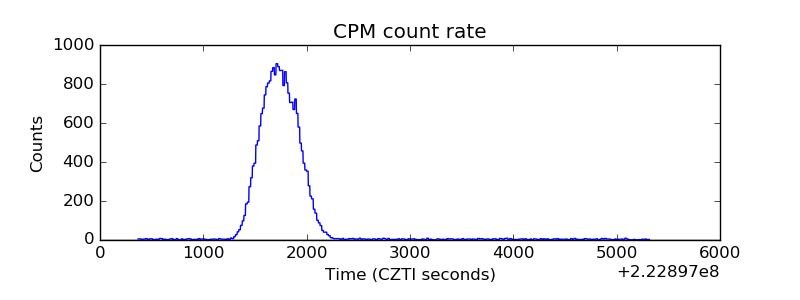 |
| CZT Counter |  |
| +2.5 Volts monitor |  |
| +5 Volts monitor |  |
| _ROLL_ROT | 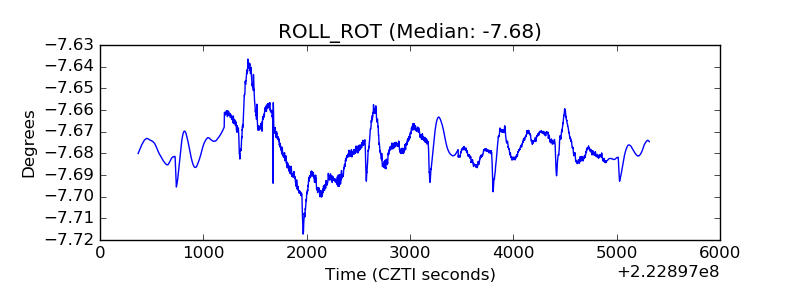 |
| _Roll_DEC | 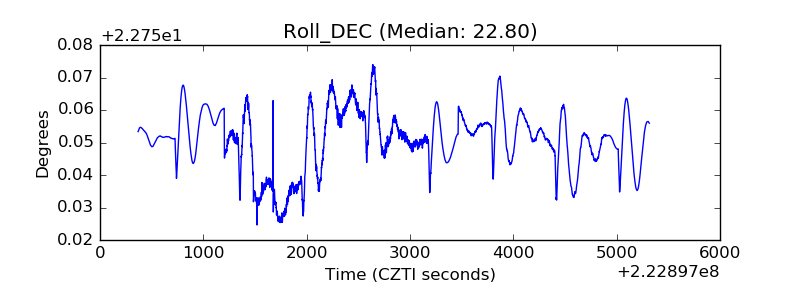 |
| _Roll_RA |  |
| Veto Counter | 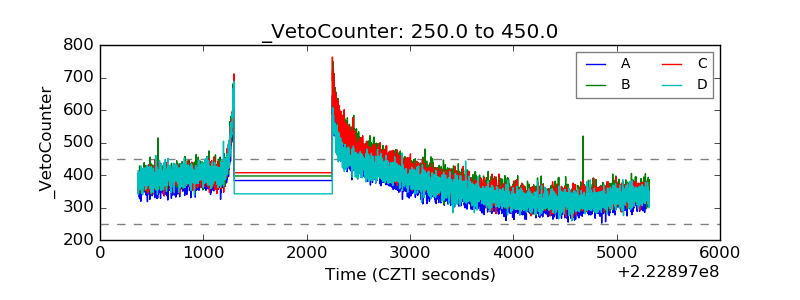 |