| Param | Original file | Final file |
|---|---|---|
| Filename | modeM0/AS1A02_175T01_9000000976cztM0_level2.fits | modeM0/AS1A02_175T01_9000000976cztM0_level2_quad_clean.evt |
| Size (bytes) | 211,697,280 | 139,596,480 |
| Size | 201.9 MB | 133.1 MB |
| Events in quadrant A | 1,285,347 | 694,423 |
| Events in quadrant B | 1,274,361 | 718,536 |
| Events in quadrant C | 1,268,980 | 679,097 |
| Events in quadrant D | 1,060,506 | 612,177 |
| Mode M0 | |||
|---|---|---|---|
| Quadrant | BADHDUFLAG | Total packets | Discarded packets |
| A | 0 | 48230 | 0 |
| B | 0 | 46733 | 0 |
| C | 0 | 50280 | 0 |
| D | 0 | 64623 | 0 |
| Mode SS | |||
|---|---|---|---|
| Quadrant | BADHDUFLAG | Total packets | Discarded packets |
| A | 0 | 524 | 0 |
| B | 0 | 524 | 0 |
| C | 0 | 524 | 0 |
| D | 0 | 524 | 0 |
| Mode M9 | |||
|---|---|---|---|
| Quadrant | BADHDUFLAG | Total packets | Discarded packets |
| A | 0 | 72 | 0 |
| B | 0 | 72 | 0 |
| C | 0 | 72 | 0 |
| D | 0 | 72 | 0 |
| Quadrant | Total seconds | Saturated seconds | Saturation percentage |
|---|---|---|---|
| A | 21863 | 249 | 1.138910% |
| B | 21862 | 177 | 0.809624% |
| C | 21864 | 431 | 1.971277% |
| D | 21864 | 1423 | 6.508416% |
Noise dominated data is calculated using 1-second bins in cleaned event files. If a bin has >2000 counts, and if more than 50% of those come from <1% of pixels, then it is considered to be noise-dominated and hence unusable.
| Quadrant | # 1 sec bins | Bins with >0 counts | Bins with >2000 counts | High rate bins dominated by noise | Noise dominated (total time) | Noise dominated (detector-on time) | Marked lightcurve |
|---|---|---|---|---|---|---|---|
| A | 28003 | 21805 | 0 | 0 | 0.00% | 0.00% |  |
| B | 28003 | 21804 | 0 | 0 | 0.00% | 0.00% |  |
| C | 28003 | 21805 | 0 | 0 | 0.00% | 0.00% |  |
| D | 28003 | 21793 | 0 | 0 | 0.00% | 0.00% |  |
Top three noisy pixels from each quadrant. If the there are fewer than three noisy pixels in the level2.evt file, extra rows are filled as -1
| Pixel properties | Quadrant properties | ||||||
|---|---|---|---|---|---|---|---|
| Quadrant | DetID | PixID | Counts | Sigma | Mean | Median | Sigma |
| A | 0 | 29 | 1273 | 11.33 | 334 | 313 | 84.8 |
| A | 7 | 110 | 1108 | 9.38 | 334 | 313 | 84.8 |
| A | 0 | 30 | 943 | 7.43 | 334 | 313 | 84.8 |
| B | 2 | 9 | 1051 | 10.24 | 336 | 320 | 71.4 |
| B | 5 | 128 | 904 | 8.18 | 336 | 320 | 71.4 |
| B | 12 | 226 | 897 | 8.08 | 336 | 320 | 71.4 |
| C | 1 | 80 | 901 | 6.52 | 335 | 313 | 90.1 |
| C | 12 | 241 | 893 | 6.44 | 335 | 313 | 90.1 |
| C | 1 | 81 | 884 | 6.34 | 335 | 313 | 90.1 |
| D | 4 | 246 | 837 | 6.82 | 302 | 275 | 82.4 |
| D | 3 | 14 | 798 | 6.34 | 302 | 275 | 82.4 |
| D | 15 | 47 | 795 | 6.31 | 302 | 275 | 82.4 |
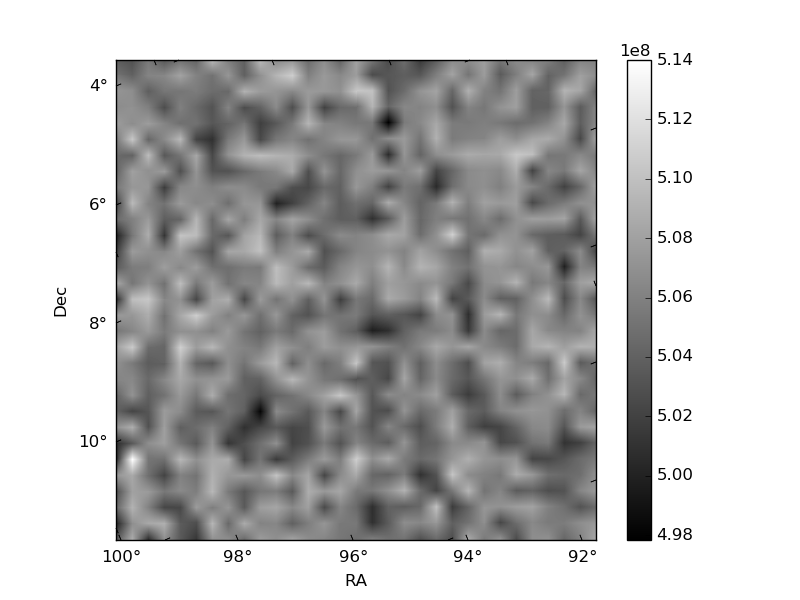
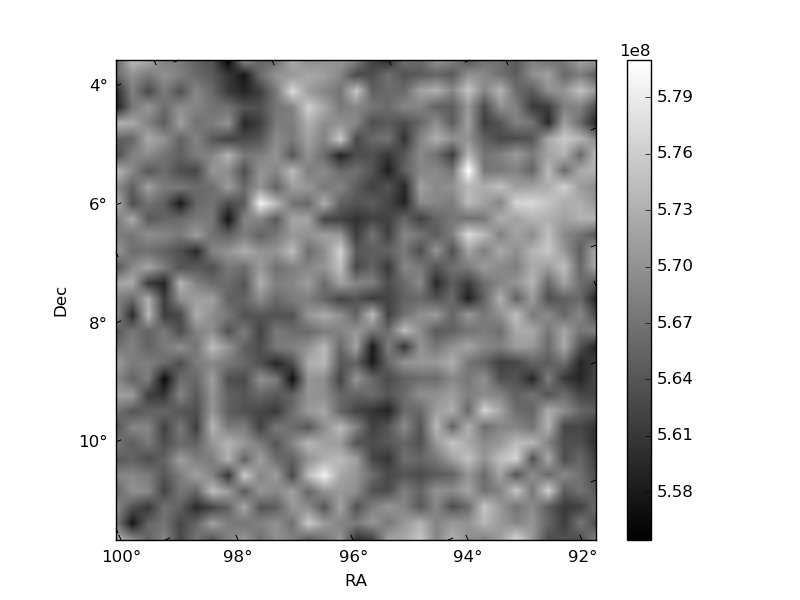
Histogram calculated using DETX and DETY for each event in the final _common_clean file
| Quadrant A | 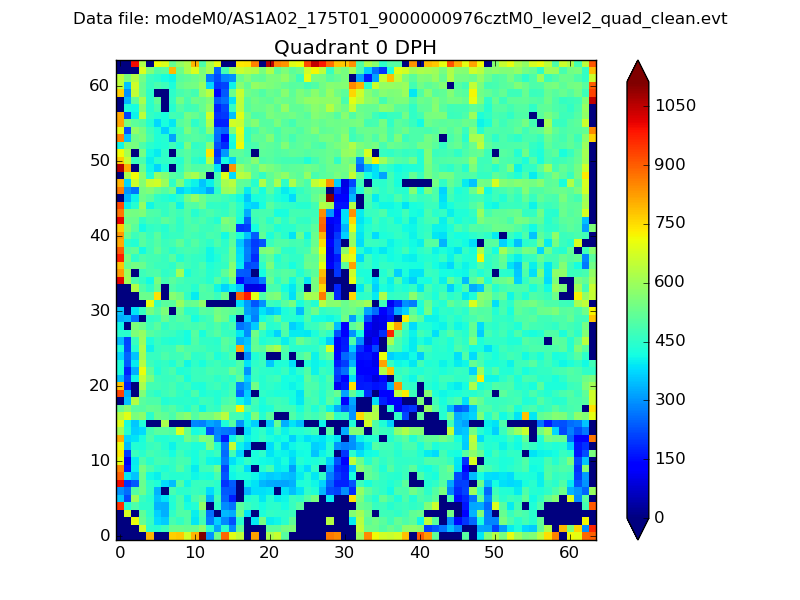 |
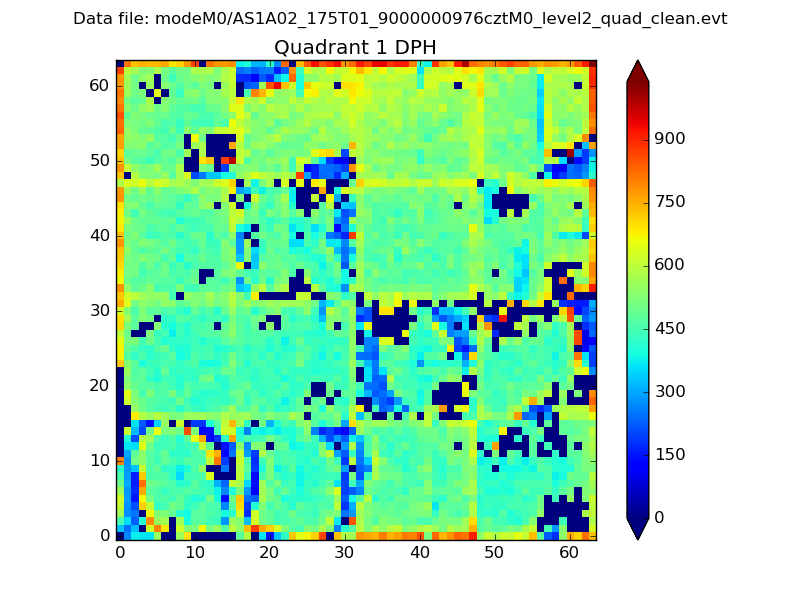 |
Quadrant B |
|---|---|---|---|
| Quadrant D |  |
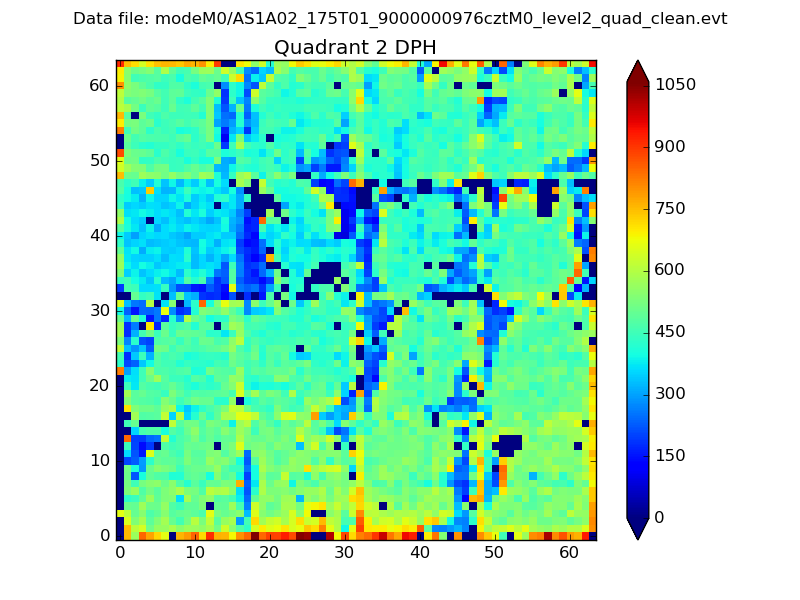 |
Quadrant C |
| Plot type | Count rate plots | Images |
|---|---|---|
| Comparison with Poisson distribution Blue bars denote a histogram of data divided into 1 sec bins. Red curve is a Poisson curve with rate = median count rate of data. |
 |
 |
| Quadrant-wise count rates Data is divided into 100 sec bins |
 |
|
| Module-wise count rates for Quadrant A Data is divided into 100 sec bins |
 |
 |
| Module-wise count rates for Quadrant B Data is divided into 100 sec bins |
 |
 |
| Module-wise count rates for Quadrant C Data is divided into 100 sec bins |
 |
 |
| Module-wise count rates for Quadrant D Data is divided into 100 sec bins |
 |
 |
| Parameter | Plot |
|---|---|
| CZT HV Monitor | 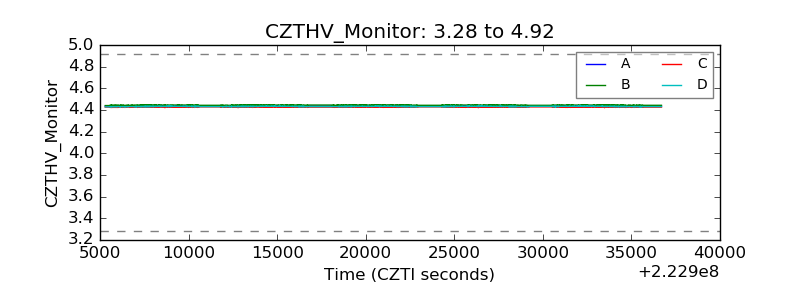 |
| D_VDD | 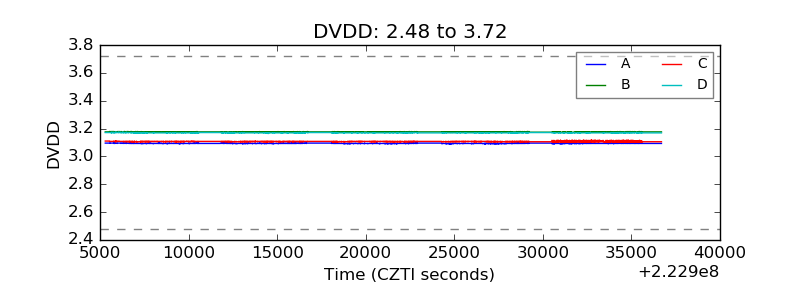 |
| Temperature 1 |  |
| Veto HV Monitor |  |
| Veto LLD |  |
| Alpha Counter |  |
| _CPM_Rate | 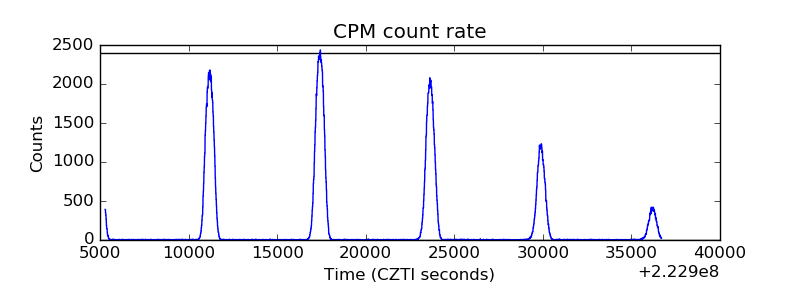 |
| CZT Counter |  |
| +2.5 Volts monitor |  |
| +5 Volts monitor |  |
| _ROLL_ROT |  |
| _Roll_DEC |  |
| _Roll_RA | 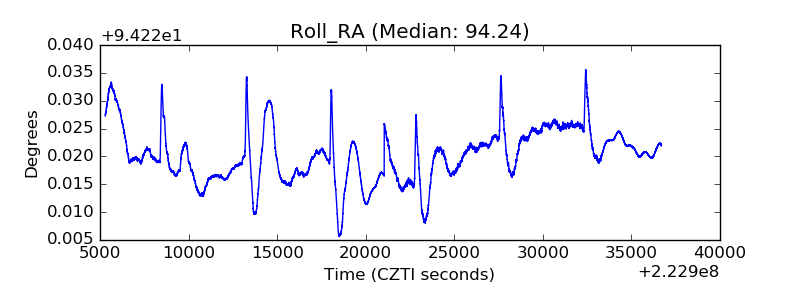 |
| Veto Counter |  |