| Param | Original file | Final file |
|---|---|---|
| Filename | modeM0/AS1A02_175T01_9000000976_07163cztM0_level2.evt | modeM0/AS1A02_175T01_9000000976_07163cztM0_level2_quad_clean.evt |
| Size (bytes) | 504,630,720 | 84,438,720 |
| Size | 481.3 MB | 80.5 MB |
| Events in quadrant A | 3,328,922 | 531,249 |
| Events in quadrant B | 3,270,189 | 555,340 |
| Events in quadrant C | 3,084,466 | 540,996 |
| Events in quadrant D | 5,165,624 | 483,272 |
| Mode M0 | |||
|---|---|---|---|
| Quadrant | BADHDUFLAG | Total packets | Discarded packets |
| A | 0 | 13973 | 3 |
| B | 0 | 13713 | 2 |
| C | 0 | 13240 | 2 |
| D | 0 | 19533 | 2 |
| Mode SS | |||
|---|---|---|---|
| Quadrant | BADHDUFLAG | Total packets | Discarded packets |
| A | 0 | 134 | 0 |
| B | 0 | 134 | 0 |
| C | 0 | 134 | 0 |
| D | 0 | 134 | 0 |
| Mode M9 | |||
|---|---|---|---|
| Quadrant | BADHDUFLAG | Total packets | Discarded packets |
| A | 0 | 24 | 0 |
| B | 0 | 24 | 0 |
| C | 0 | 24 | 0 |
| D | 0 | 24 | 0 |
| Quadrant | Total seconds | Saturated seconds | Saturation percentage |
|---|---|---|---|
| A | 6384 | 54 | 0.845865% |
| B | 6384 | 45 | 0.704887% |
| C | 6384 | 34 | 0.532581% |
| D | 6384 | 475 | 7.440476% |
Noise dominated data is calculated using 1-second bins in cleaned event files. If a bin has >2000 counts, and if more than 50% of those come from <1% of pixels, then it is considered to be noise-dominated and hence unusable.
| Quadrant | # 1 sec bins | Bins with >0 counts | Bins with >2000 counts | High rate bins dominated by noise | Noise dominated (total time) | Noise dominated (detector-on time) | Marked lightcurve |
|---|---|---|---|---|---|---|---|
| A | 8899 | 6385 | 23 | 23 | 0.26% | 0.36% | 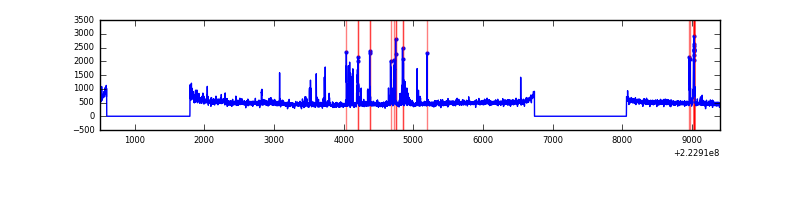 |
| B | 8899 | 6385 | 5 | 5 | 0.06% | 0.08% | 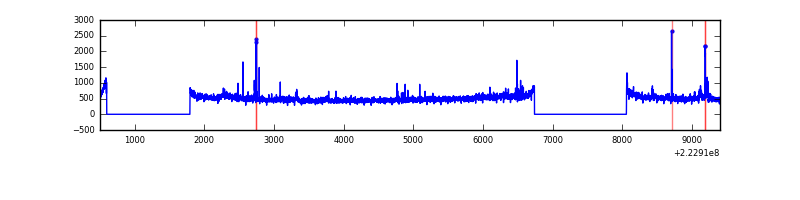 |
| C | 8899 | 6386 | 4 | 4 | 0.04% | 0.06% | 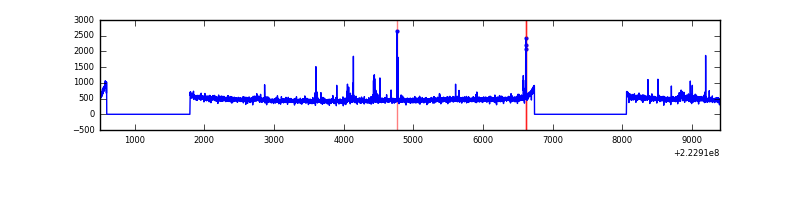 |
| D | 8899 | 6385 | 416 | 416 | 4.67% | 6.52% | 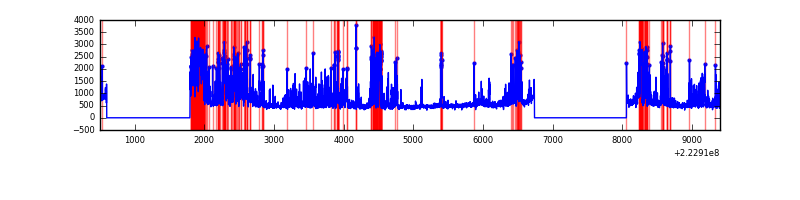 |
Top three noisy pixels from each quadrant. If the there are fewer than three noisy pixels in the level2.evt file, extra rows are filled as -1
| Pixel properties | Quadrant properties | ||||||
|---|---|---|---|---|---|---|---|
| Quadrant | DetID | PixID | Counts | Sigma | Mean | Median | Sigma |
| A | 14 | 238 | 259895 | 1632.19 | 777 | 760 | 158.8 |
| A | 8 | 15 | 66654 | 415.04 | 777 | 760 | 158.8 |
| A | 0 | 226 | 7447 | 42.12 | 777 | 760 | 158.8 |
| B | 0 | 219 | 72470 | 478.21 | 795 | 777 | 149.9 |
| B | 4 | 81 | 49164 | 322.75 | 795 | 777 | 149.9 |
| B | 0 | 214 | 48399 | 317.65 | 795 | 777 | 149.9 |
| C | 4 | 254 | 64737 | 356.11 | 766 | 771 | 179.6 |
| C | 9 | 68 | 19724 | 105.51 | 766 | 771 | 179.6 |
| C | 14 | 67 | 7479 | 37.34 | 766 | 771 | 179.6 |
| D | 14 | 34 | 887790 | 4840.7 | 736 | 713 | 183.3 |
| D | 2 | 216 | 733705 | 3999.87 | 736 | 713 | 183.3 |
| D | 2 | 14 | 247963 | 1349.22 | 736 | 713 | 183.3 |
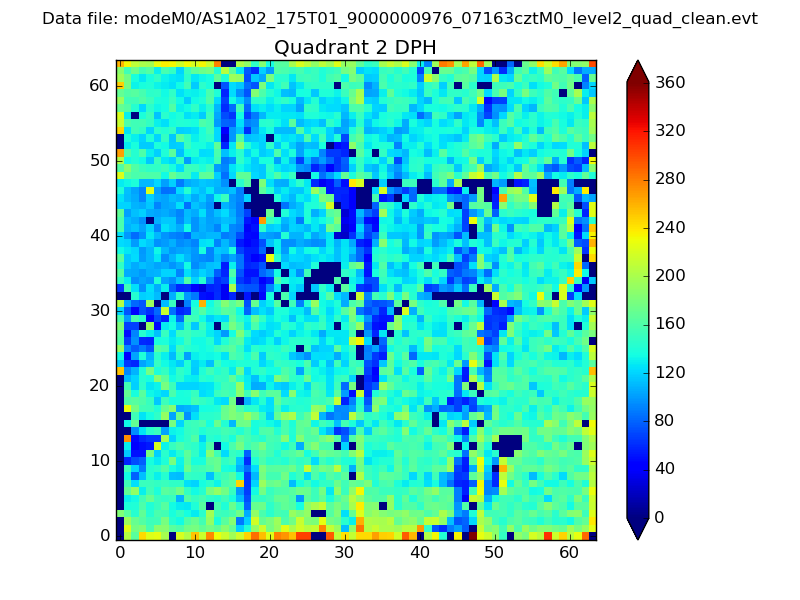
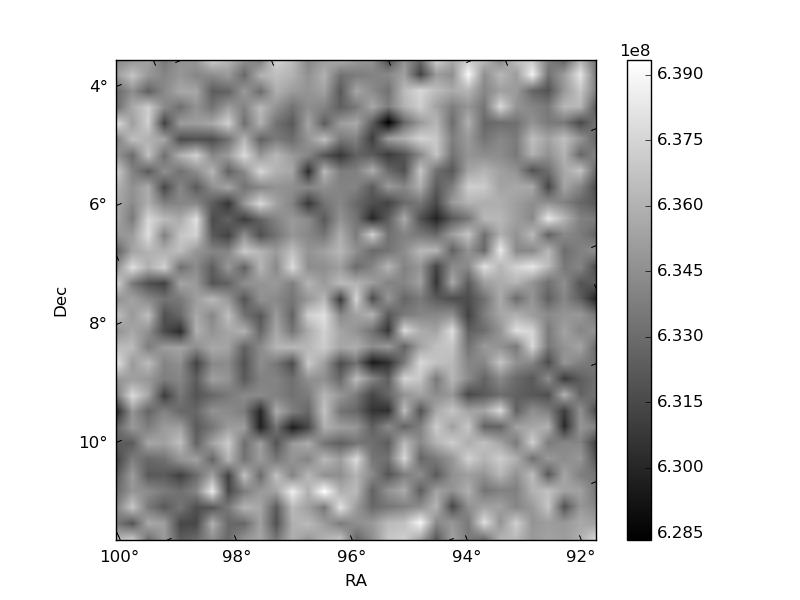
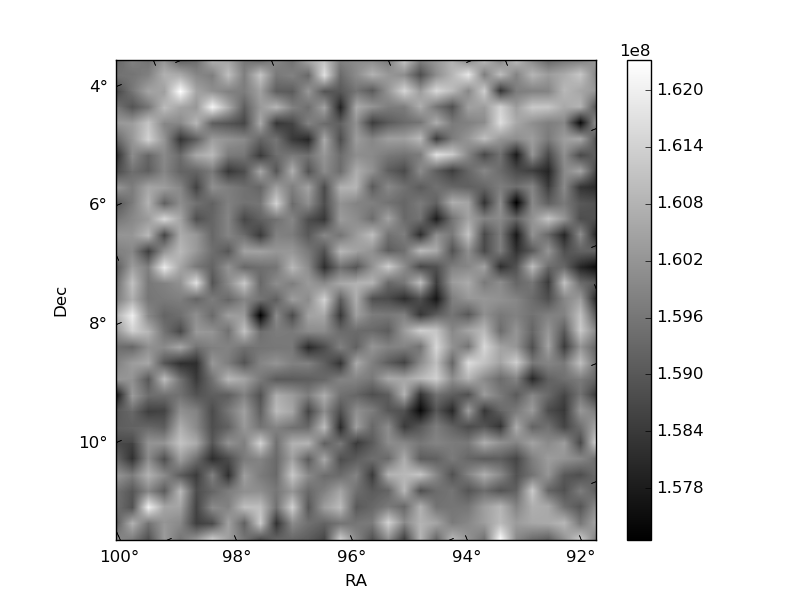
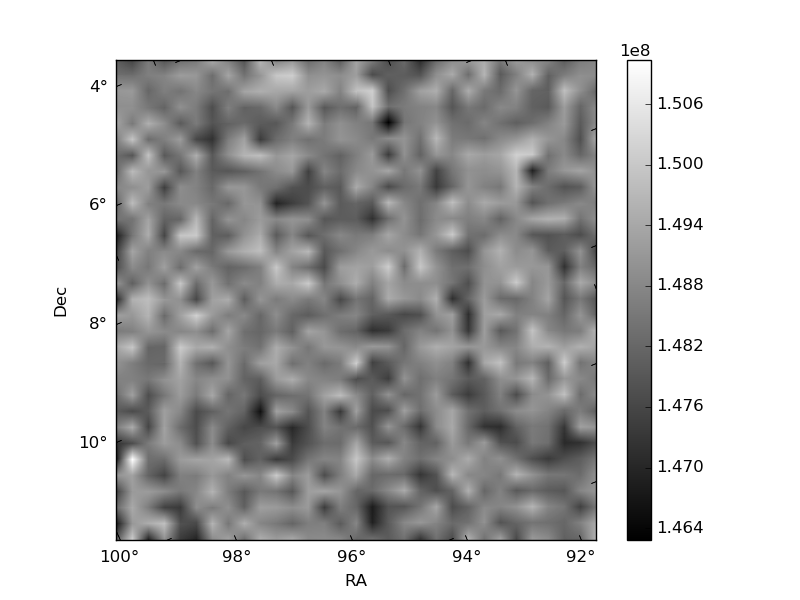
Histogram calculated using DETX and DETY for each event in the final _common_clean file
| Quadrant A | 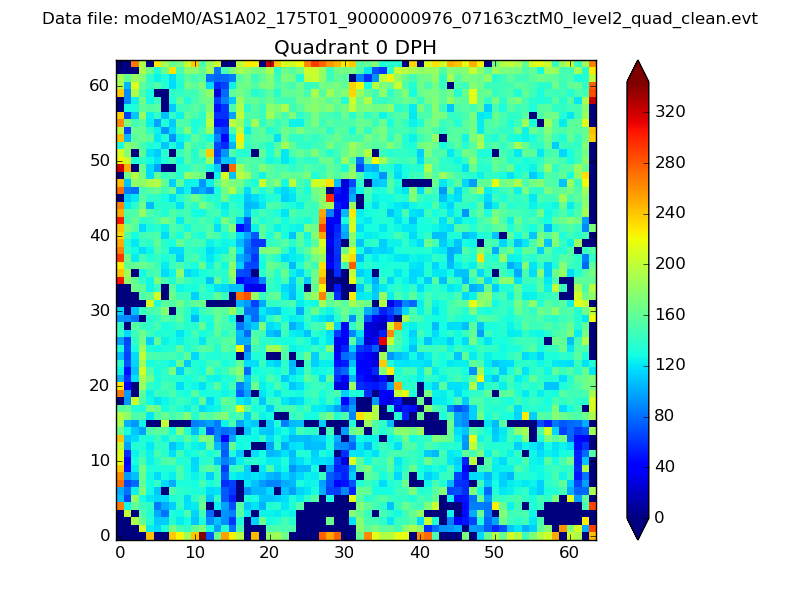 |
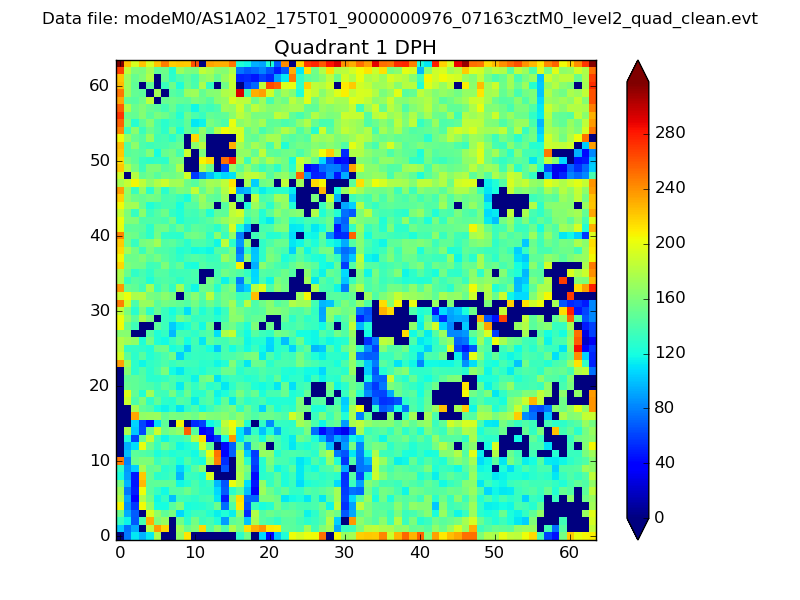 |
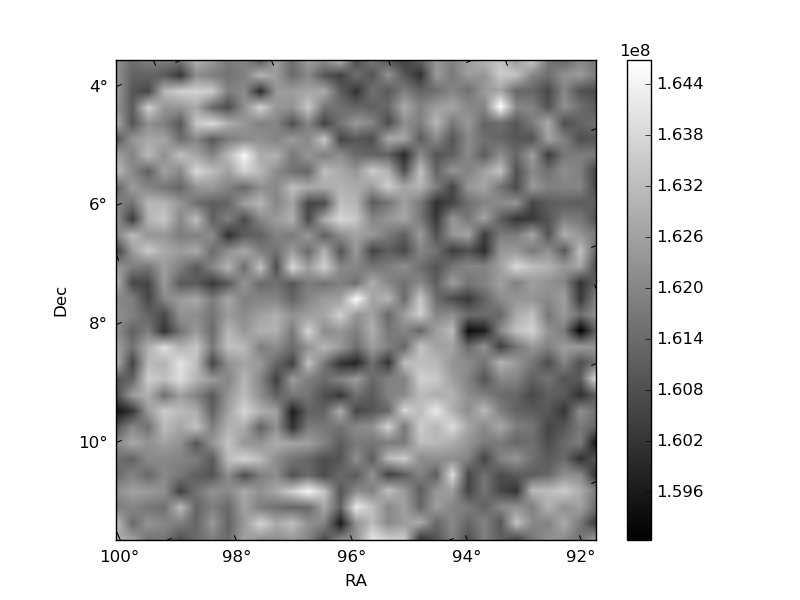
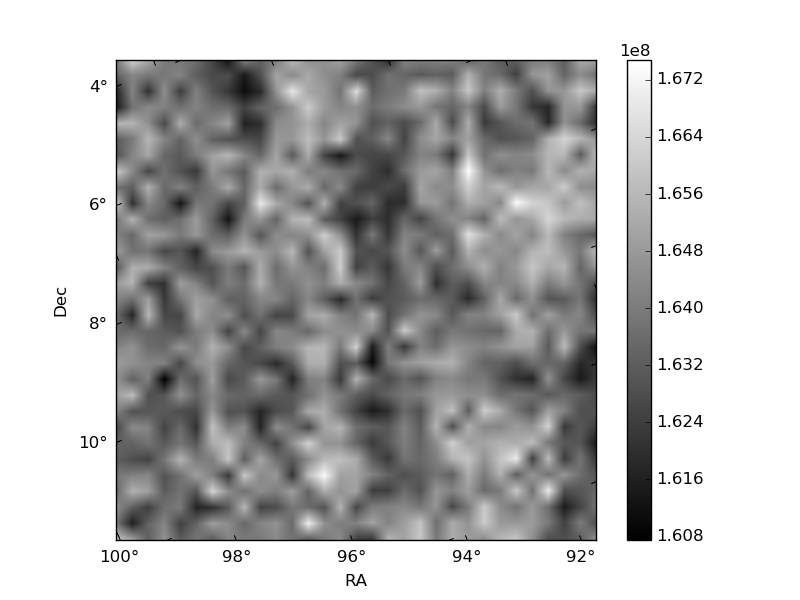
Quadrant B |
|---|---|---|---|
| Quadrant D | 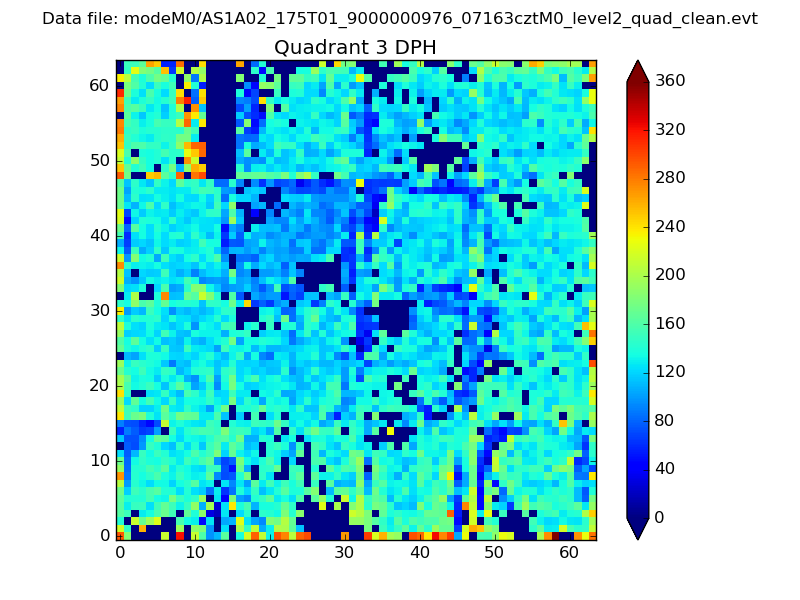 |
 |
Quadrant C |
| Plot type | Count rate plots | Images |
|---|---|---|
| Comparison with Poisson distribution Blue bars denote a histogram of data divided into 1 sec bins. Red curve is a Poisson curve with rate = median count rate of data. |
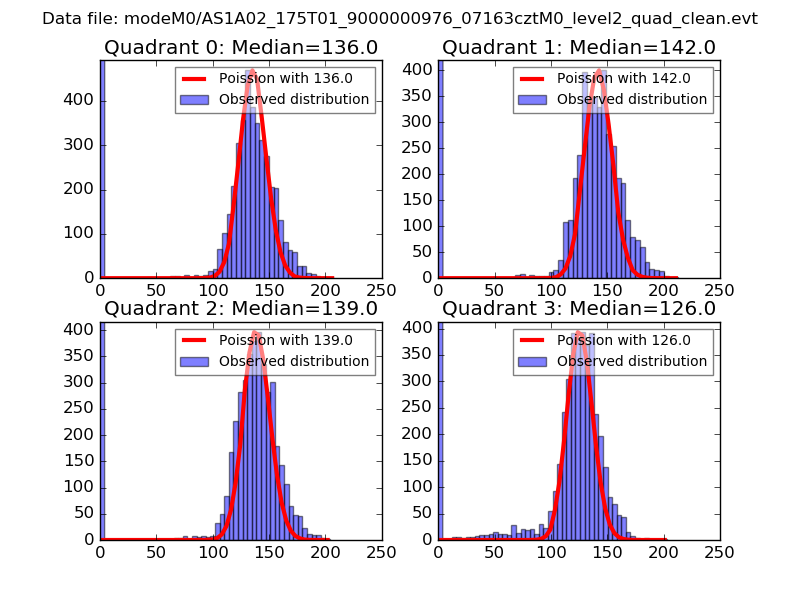 |
 |
| Quadrant-wise count rates Data is divided into 100 sec bins |
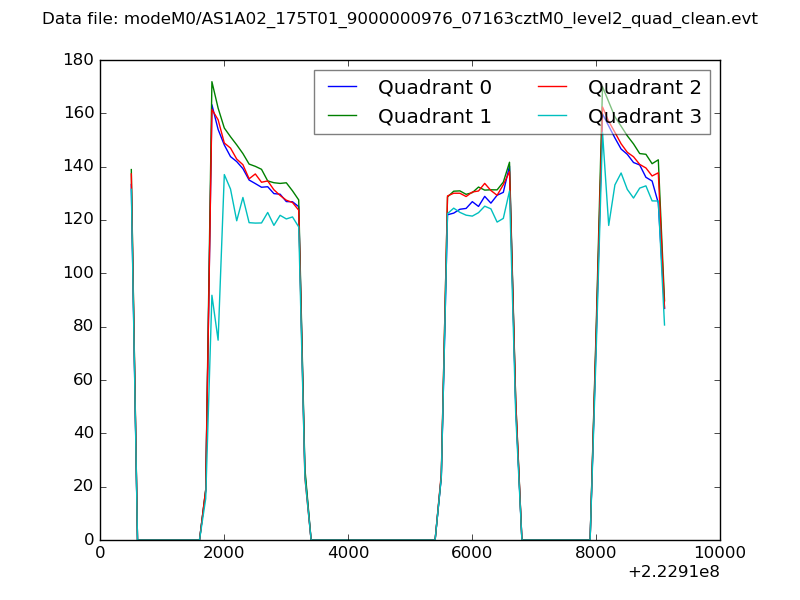 |
|
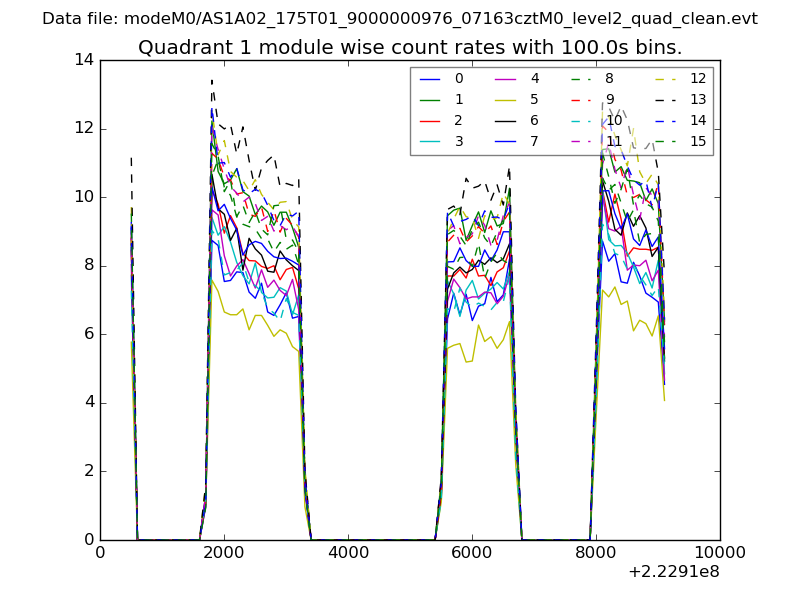
| Module-wise count rates for Quadrant A Data is divided into 100 sec bins |
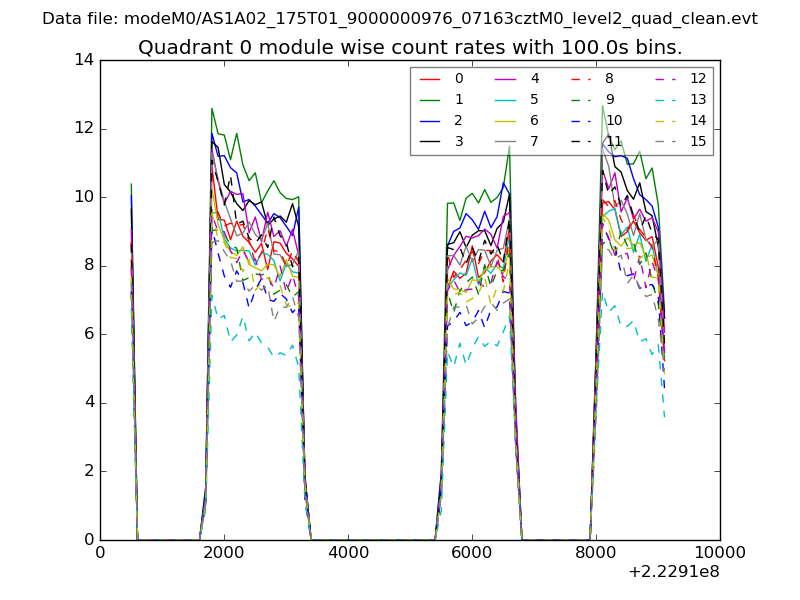 |
 |
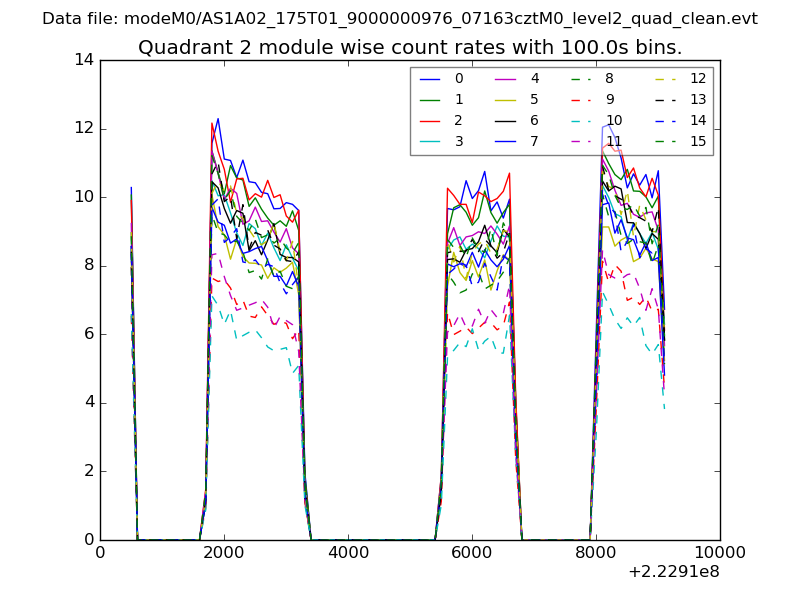
| Module-wise count rates for Quadrant B Data is divided into 100 sec bins |
 |
 |
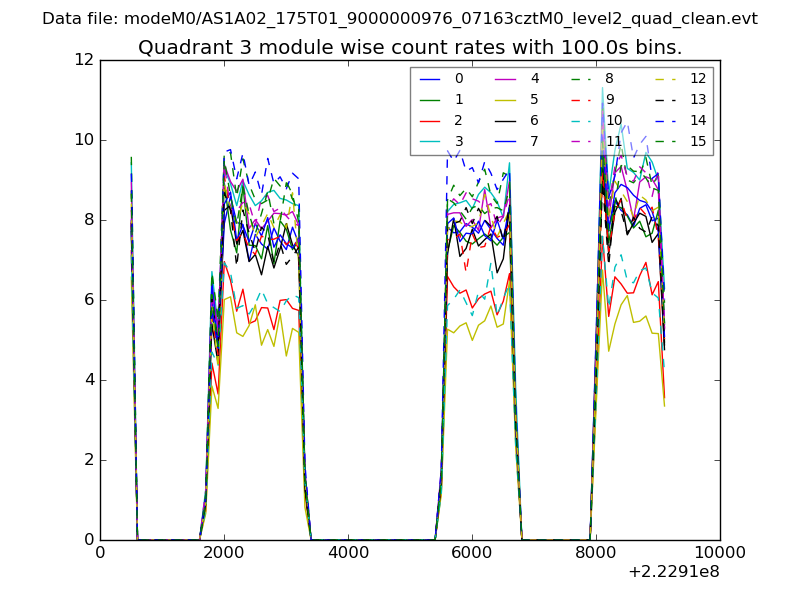
| Module-wise count rates for Quadrant C Data is divided into 100 sec bins |
 |
 |
| Module-wise count rates for Quadrant D Data is divided into 100 sec bins |
 |
 |
| Parameter | Plot |
|---|---|
| CZT HV Monitor | 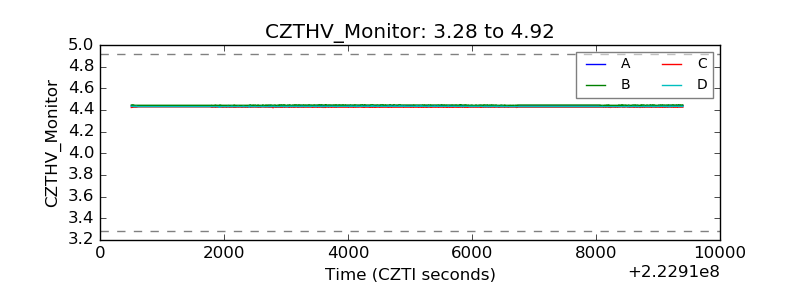 |
| D_VDD | 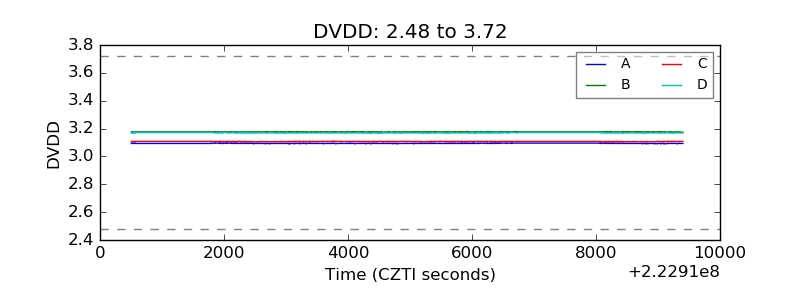 |
| Temperature 1 | 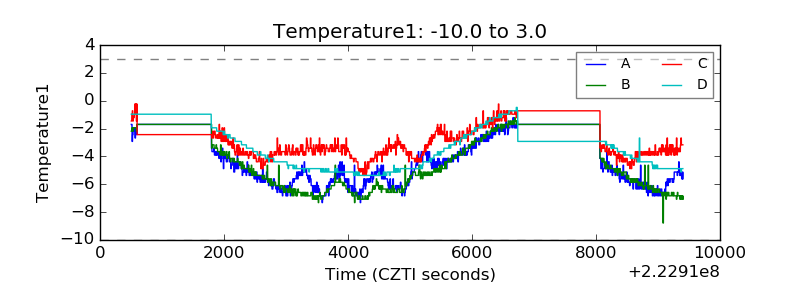 |
| Veto HV Monitor | 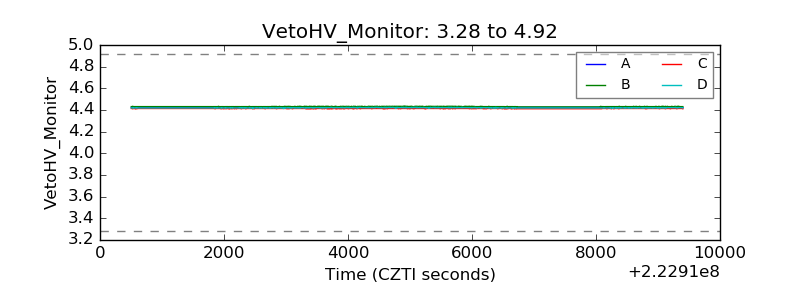 |
| Veto LLD | 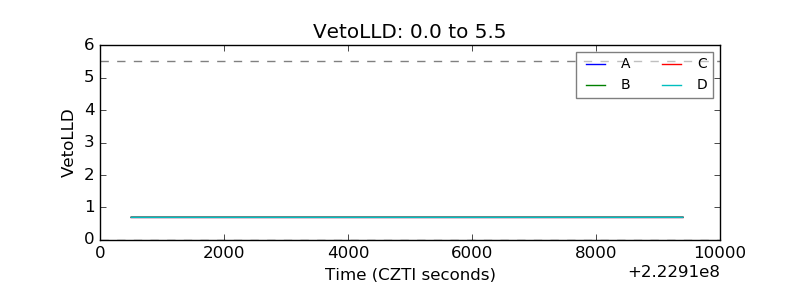 |
| Alpha Counter | 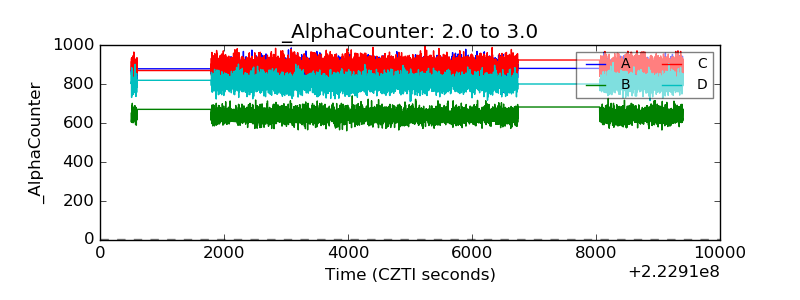 |
| _CPM_Rate | 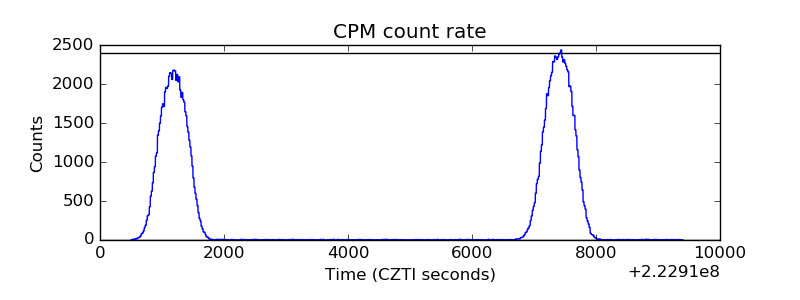 |
| CZT Counter | 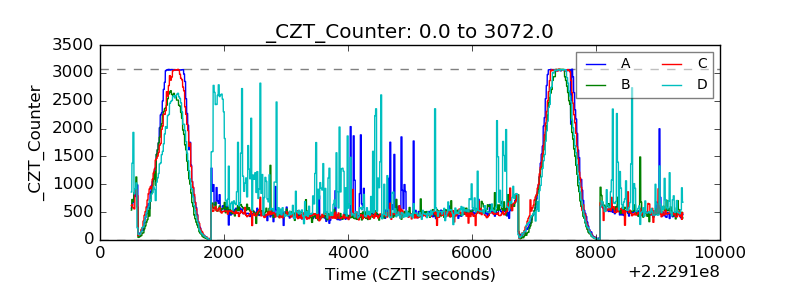 |
| +2.5 Volts monitor |  |
| +5 Volts monitor |  |
| _ROLL_ROT | 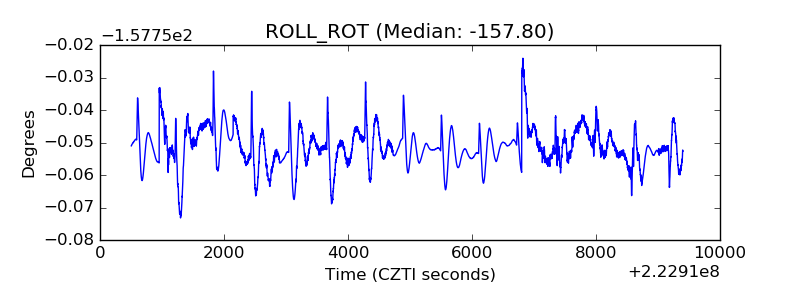 |
| _Roll_DEC | 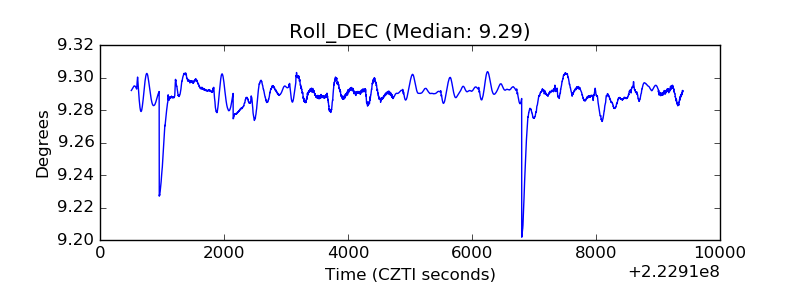 |
| _Roll_RA | 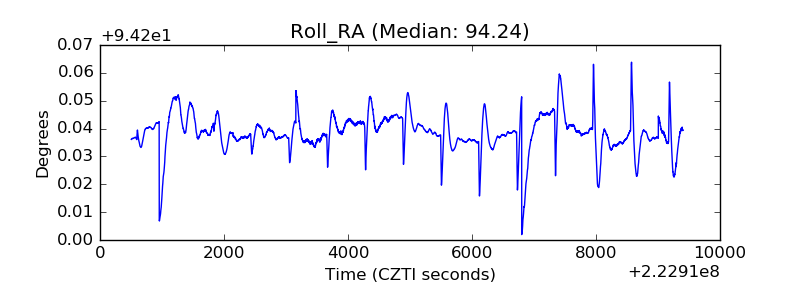 |
| Veto Counter | 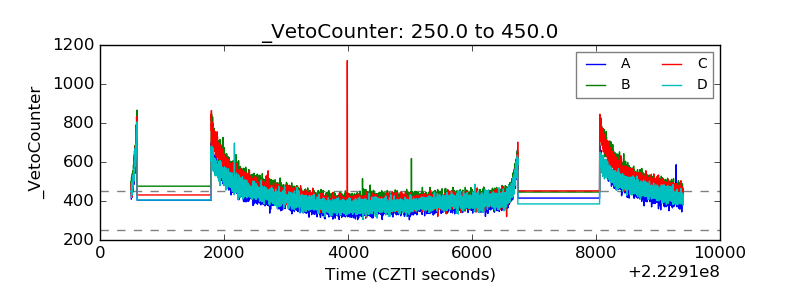 |