| Param | Original file | Final file |
|---|---|---|
| Filename | modeM0/AS1A02_175T01_9000000976_07164cztM0_level2.evt | modeM0/AS1A02_175T01_9000000976_07164cztM0_level2_quad_clean.evt |
| Size (bytes) | 526,530,240 | 76,576,320 |
| Size | 502.1 MB | 73.0 MB |
| Events in quadrant A | 3,483,196 | 466,376 |
| Events in quadrant B | 3,326,830 | 487,263 |
| Events in quadrant C | 3,781,758 | 470,344 |
| Events in quadrant D | 4,912,238 | 439,992 |
| Mode M0 | |||
|---|---|---|---|
| Quadrant | BADHDUFLAG | Total packets | Discarded packets |
| A | 0 | 14473 | 3 |
| B | 0 | 13883 | 2 |
| C | 0 | 15432 | 2 |
| D | 0 | 18738 | 2 |
| Mode SS | |||
|---|---|---|---|
| Quadrant | BADHDUFLAG | Total packets | Discarded packets |
| A | 0 | 134 | 0 |
| B | 0 | 134 | 0 |
| C | 0 | 134 | 0 |
| D | 0 | 134 | 0 |
| Mode M9 | |||
|---|---|---|---|
| Quadrant | BADHDUFLAG | Total packets | Discarded packets |
| A | 0 | 20 | 0 |
| B | 0 | 20 | 0 |
| C | 0 | 20 | 0 |
| D | 0 | 21 | 0 |
| Quadrant | Total seconds | Saturated seconds | Saturation percentage |
|---|---|---|---|
| A | 6514 | 71 | 1.089960% |
| B | 6514 | 27 | 0.414492% |
| C | 6514 | 104 | 1.596561% |
| D | 6514 | 395 | 6.063862% |
Noise dominated data is calculated using 1-second bins in cleaned event files. If a bin has >2000 counts, and if more than 50% of those come from <1% of pixels, then it is considered to be noise-dominated and hence unusable.
| Quadrant | # 1 sec bins | Bins with >0 counts | Bins with >2000 counts | High rate bins dominated by noise | Noise dominated (total time) | Noise dominated (detector-on time) | Marked lightcurve |
|---|---|---|---|---|---|---|---|
| A | 7844 | 6515 | 45 | 45 | 0.57% | 0.69% | 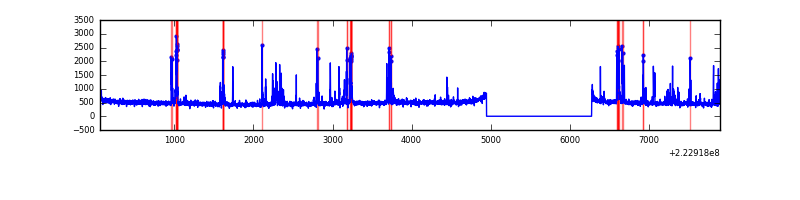 |
| B | 7844 | 6514 | 7 | 7 | 0.09% | 0.11% | 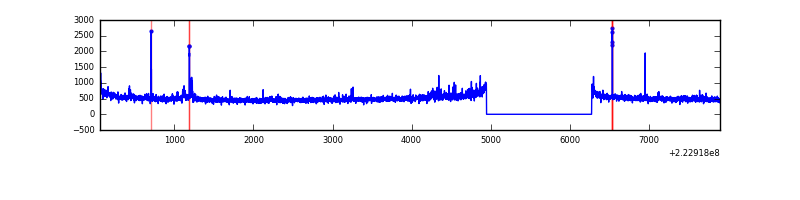 |
| C | 7844 | 6515 | 76 | 76 | 0.97% | 1.17% | 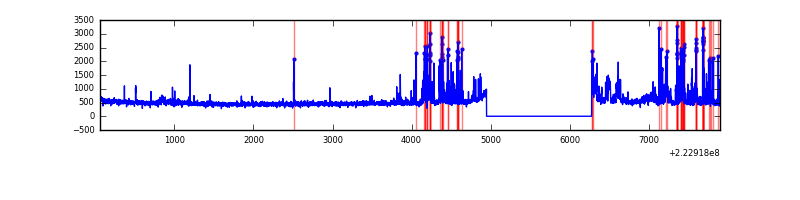 |
| D | 7844 | 6515 | 359 | 359 | 4.58% | 5.51% | 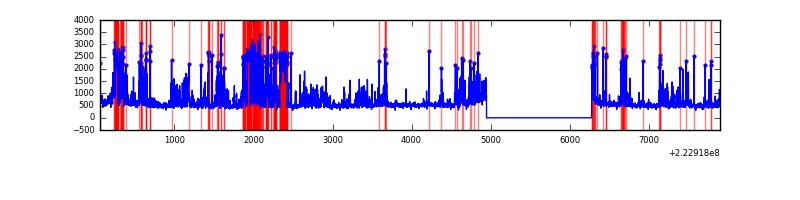 |
Top three noisy pixels from each quadrant. If the there are fewer than three noisy pixels in the level2.evt file, extra rows are filled as -1
| Pixel properties | Quadrant properties | ||||||
|---|---|---|---|---|---|---|---|
| Quadrant | DetID | PixID | Counts | Sigma | Mean | Median | Sigma |
| A | 14 | 238 | 384995 | 2392.77 | 795 | 779 | 160.6 |
| A | 3 | 1 | 14445 | 85.11 | 795 | 779 | 160.6 |
| A | 8 | 15 | 13605 | 79.88 | 795 | 779 | 160.6 |
| B | 4 | 81 | 67976 | 440.47 | 813 | 793 | 152.5 |
| B | 0 | 214 | 58405 | 377.72 | 813 | 793 | 152.5 |
| B | 0 | 219 | 36405 | 233.48 | 813 | 793 | 152.5 |
| C | 4 | 254 | 597642 | 3252.95 | 783 | 791 | 183.5 |
| C | 9 | 68 | 122861 | 665.3 | 783 | 791 | 183.5 |
| C | 13 | 61 | 6019 | 28.49 | 783 | 791 | 183.5 |
| D | 2 | 216 | 743288 | 4007.99 | 756 | 735 | 185.3 |
| D | 2 | 14 | 648037 | 3493.86 | 756 | 735 | 185.3 |
| D | 14 | 34 | 367133 | 1977.66 | 756 | 735 | 185.3 |
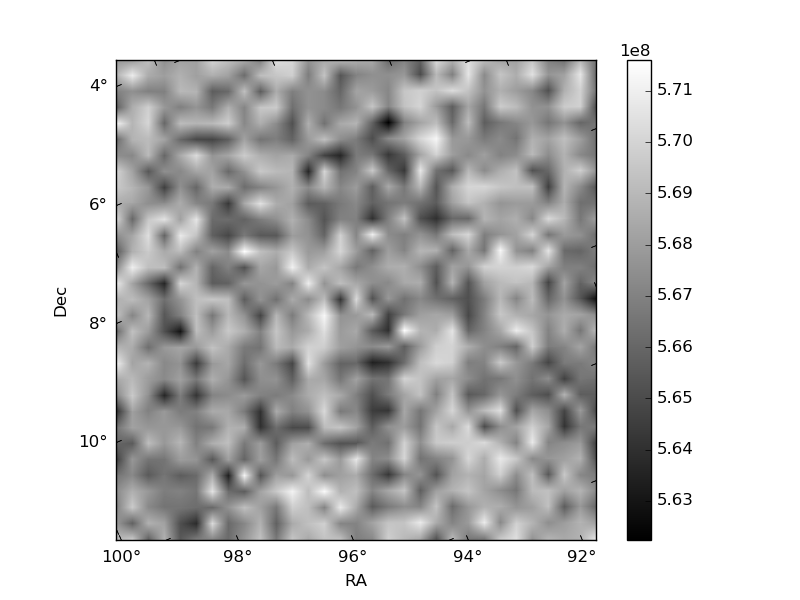
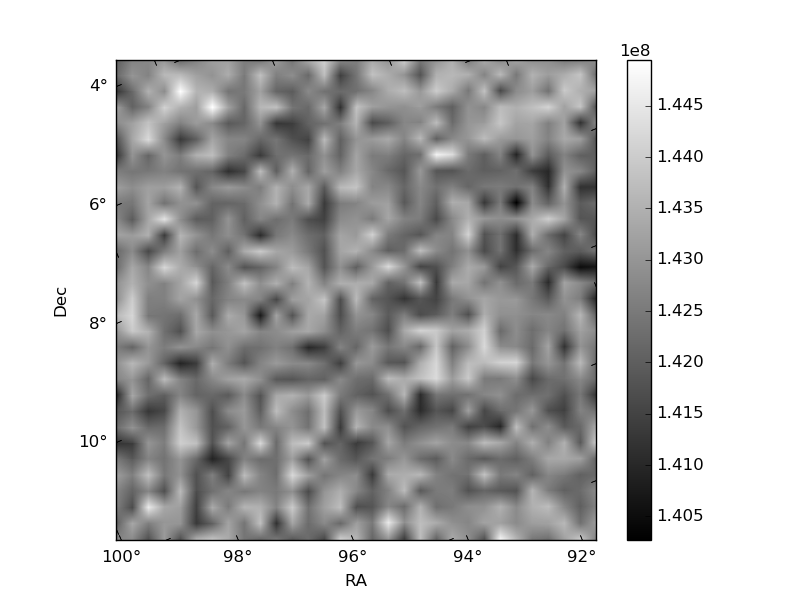
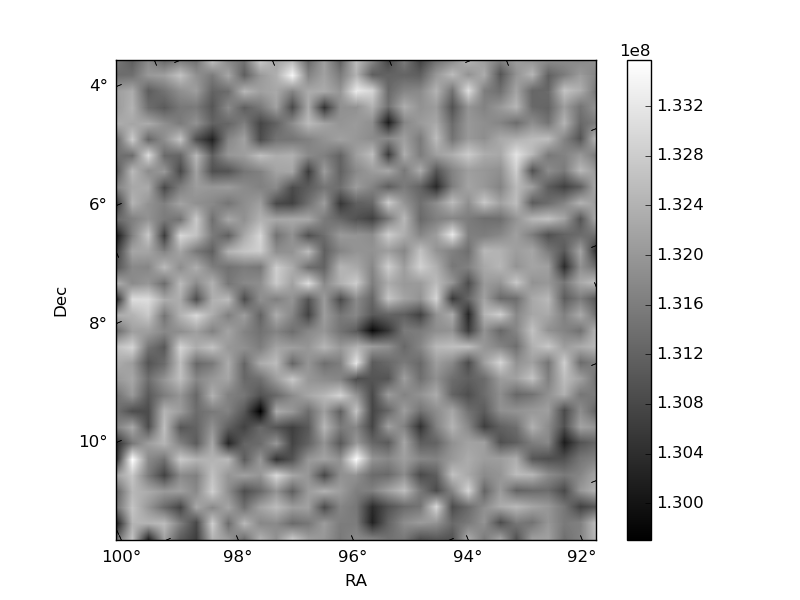
Histogram calculated using DETX and DETY for each event in the final _common_clean file
| Quadrant A | 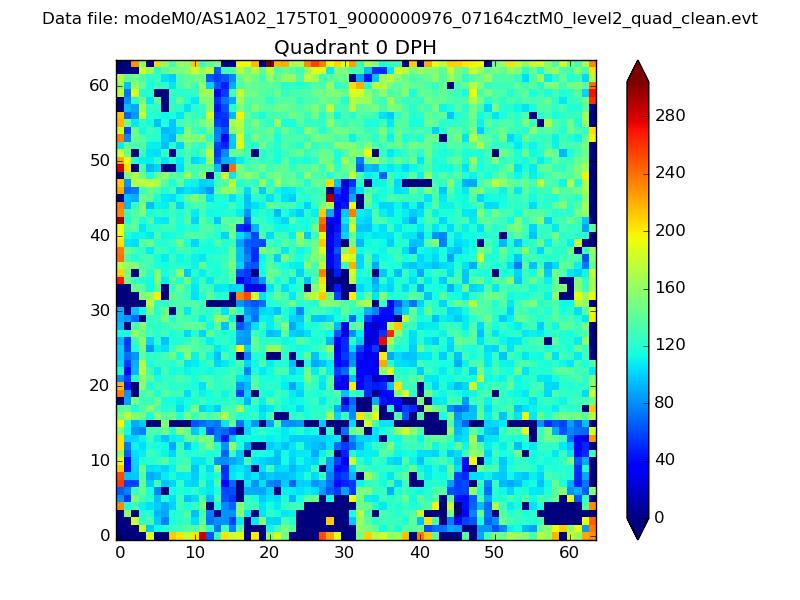 |
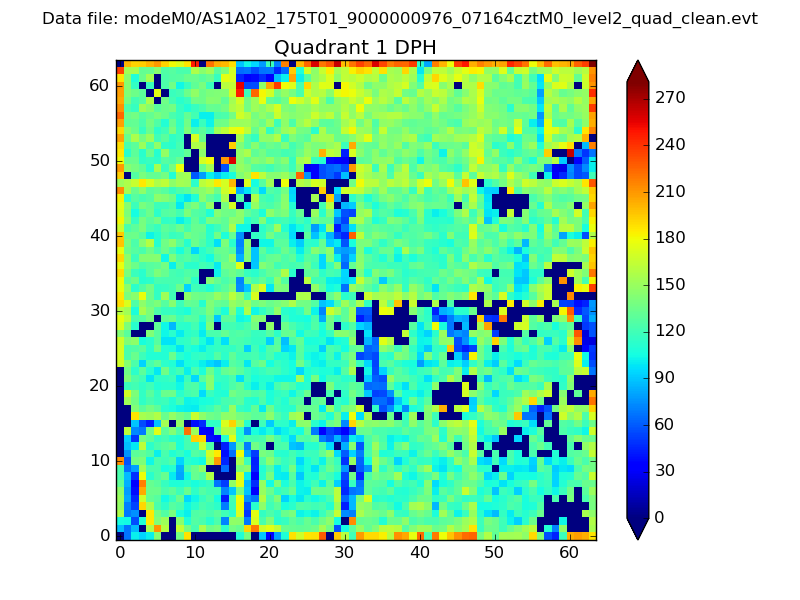 |
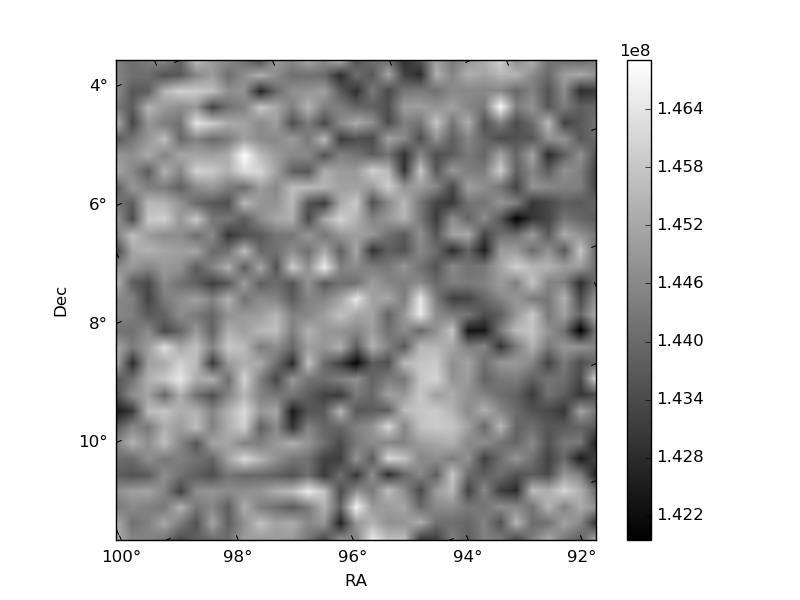
Quadrant B |
|---|---|---|---|
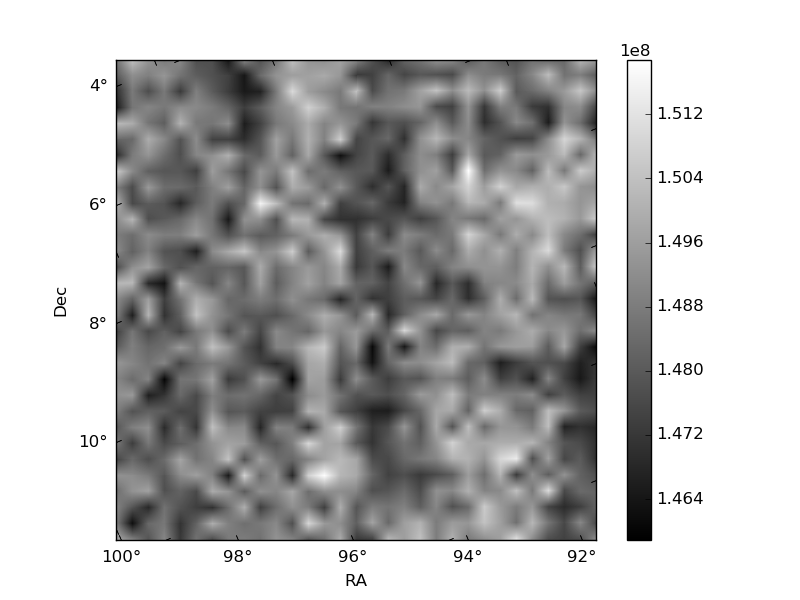
| Quadrant D | 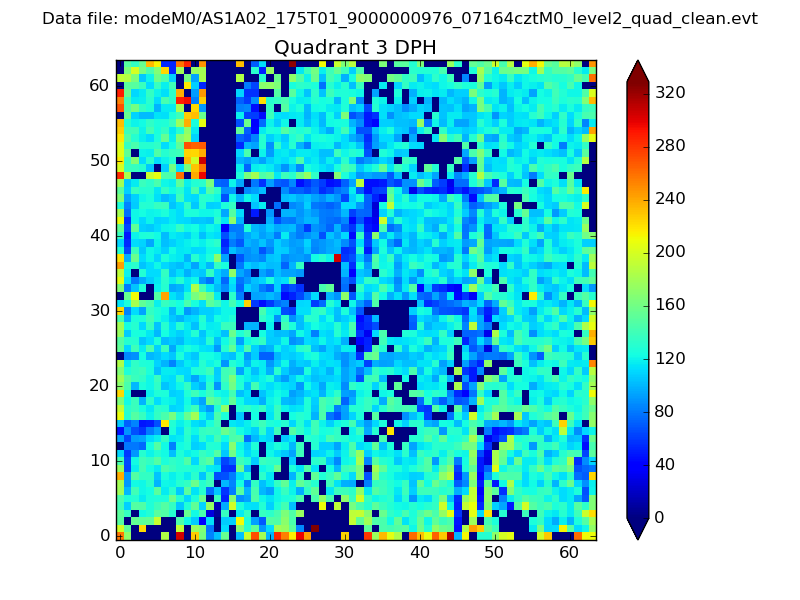 |
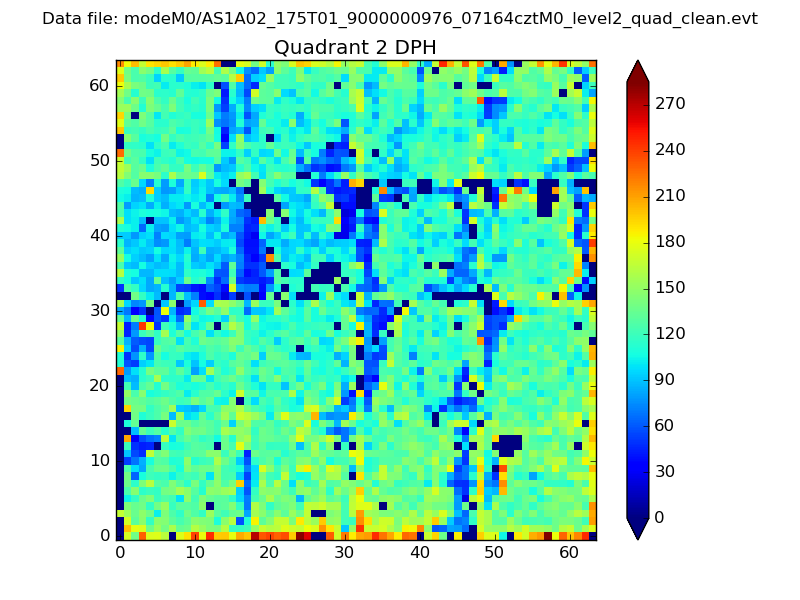 |
Quadrant C |
| Plot type | Count rate plots | Images |
|---|---|---|
| Comparison with Poisson distribution Blue bars denote a histogram of data divided into 1 sec bins. Red curve is a Poisson curve with rate = median count rate of data. |
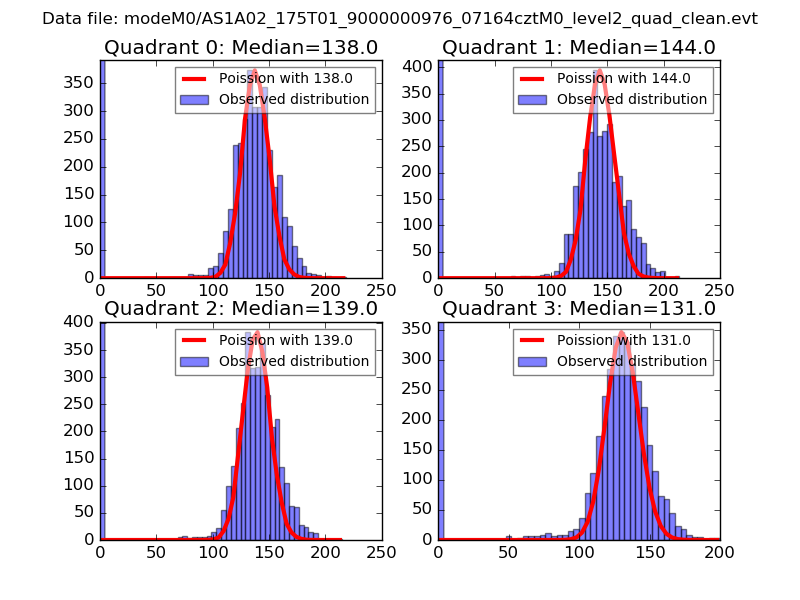 |
 |
| Quadrant-wise count rates Data is divided into 100 sec bins |
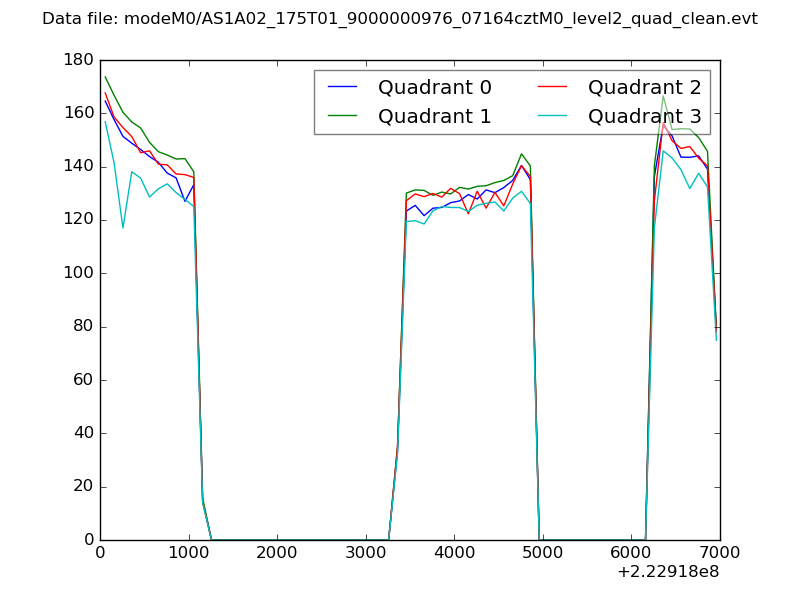 |
|
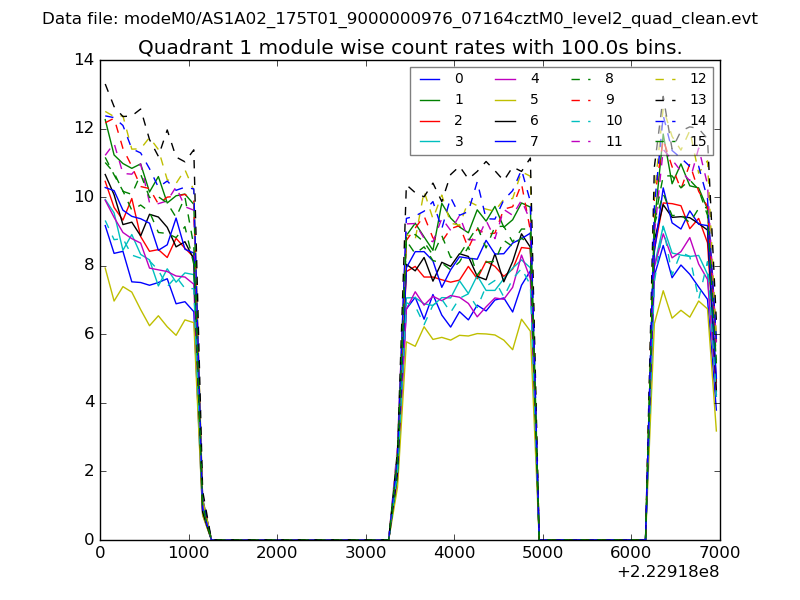
| Module-wise count rates for Quadrant A Data is divided into 100 sec bins |
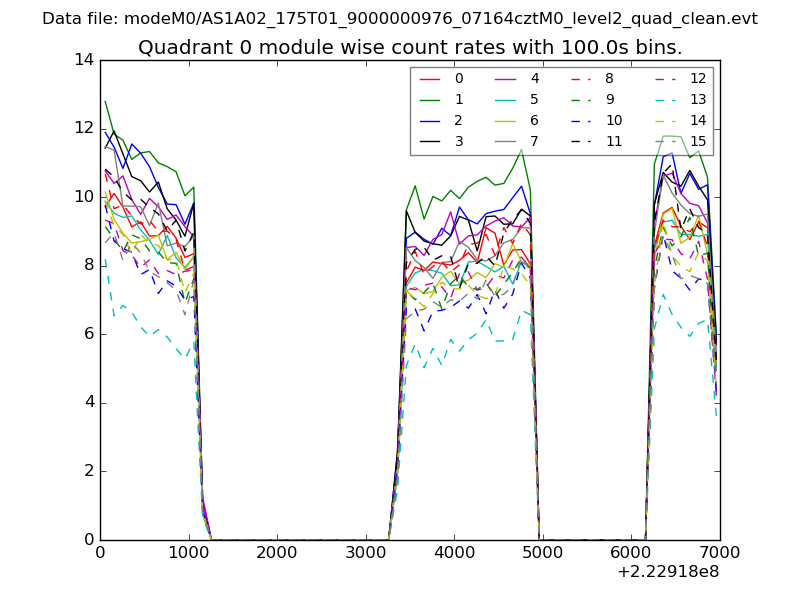 |
 |
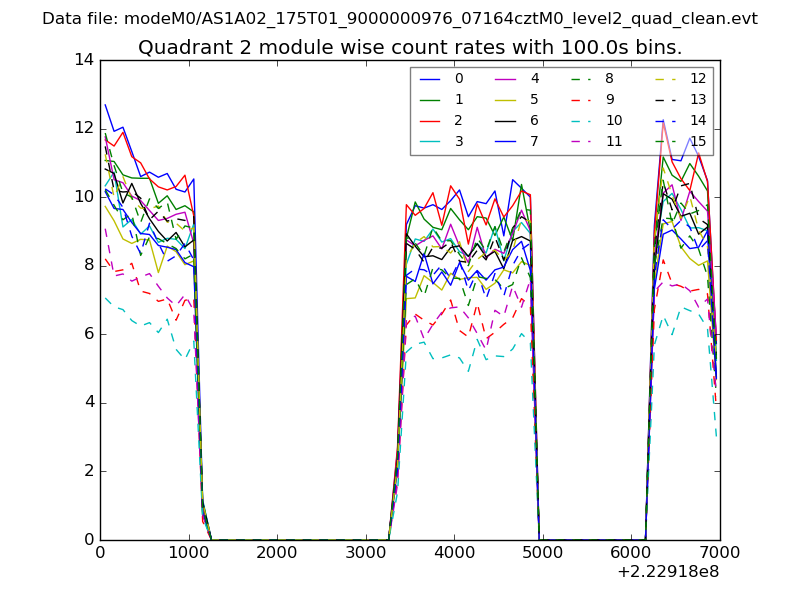
| Module-wise count rates for Quadrant B Data is divided into 100 sec bins |
 |
 |
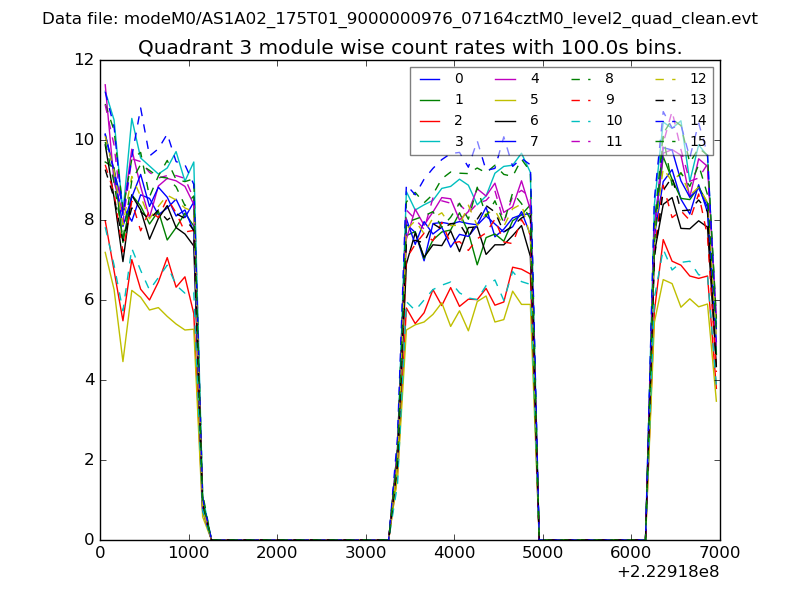
| Module-wise count rates for Quadrant C Data is divided into 100 sec bins |
 |
 |
| Module-wise count rates for Quadrant D Data is divided into 100 sec bins |
 |
 |
| Parameter | Plot |
|---|---|
| CZT HV Monitor | 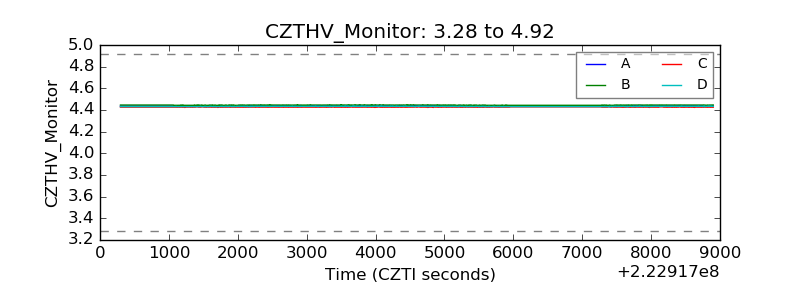 |
| D_VDD | 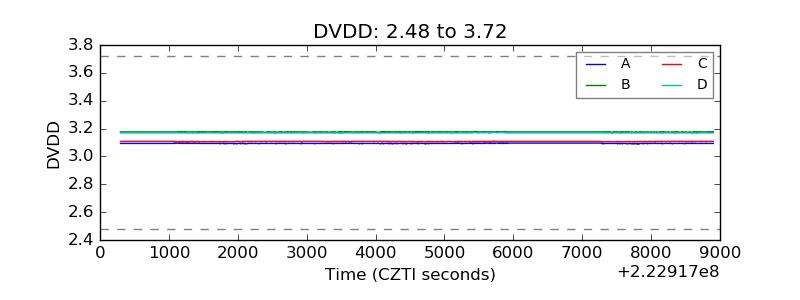 |
| Temperature 1 | 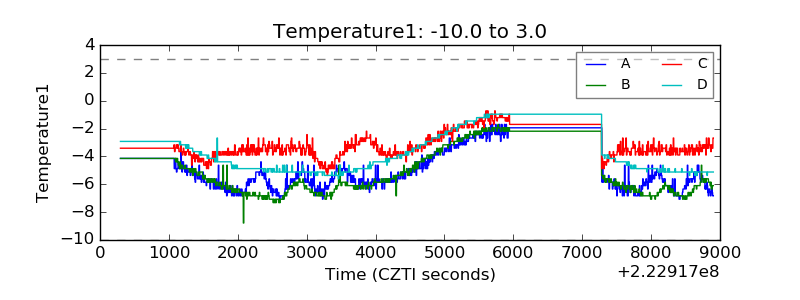 |
| Veto HV Monitor | 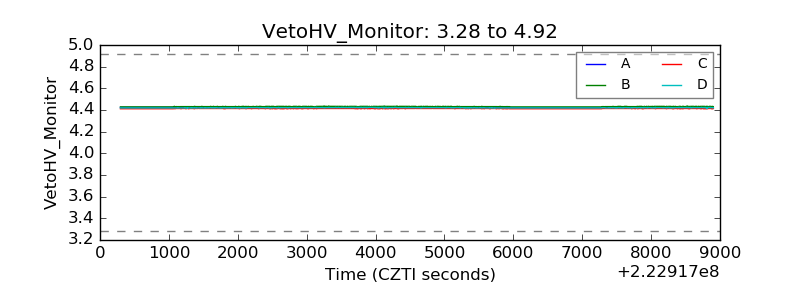 |
| Veto LLD | 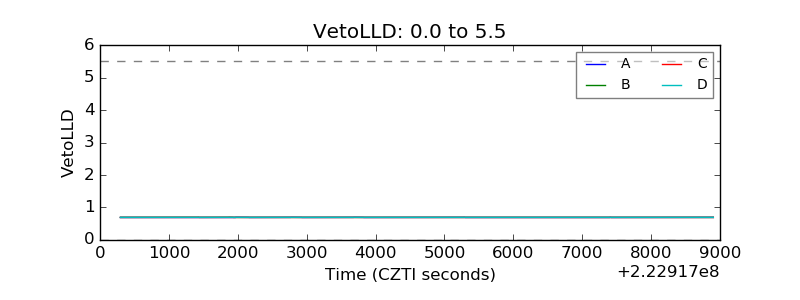 |
| Alpha Counter | 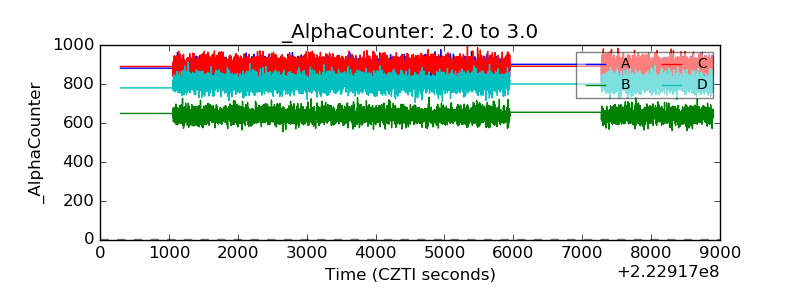 |
| _CPM_Rate | 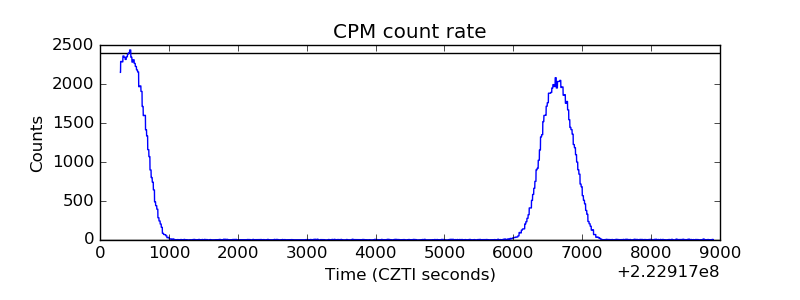 |
| CZT Counter | 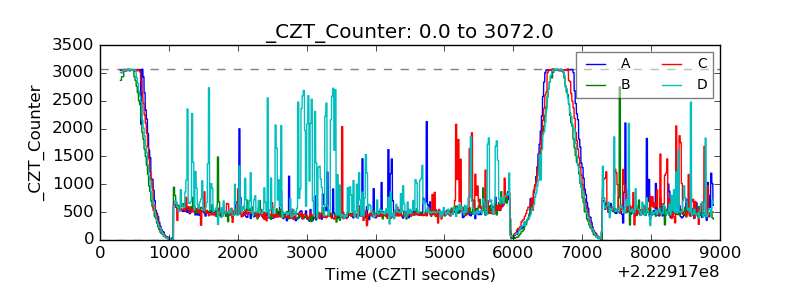 |
| +2.5 Volts monitor |  |
| +5 Volts monitor | 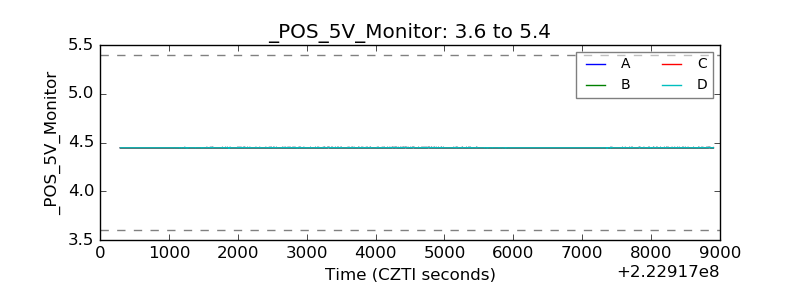 |
| _ROLL_ROT | 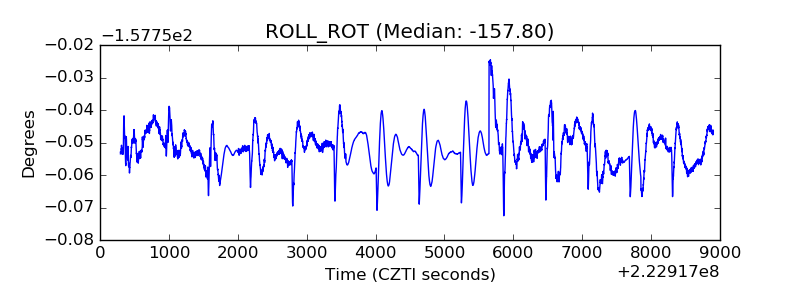 |
| _Roll_DEC | 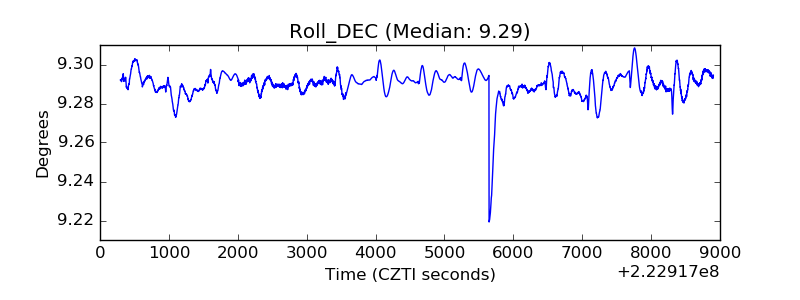 |
| _Roll_RA | 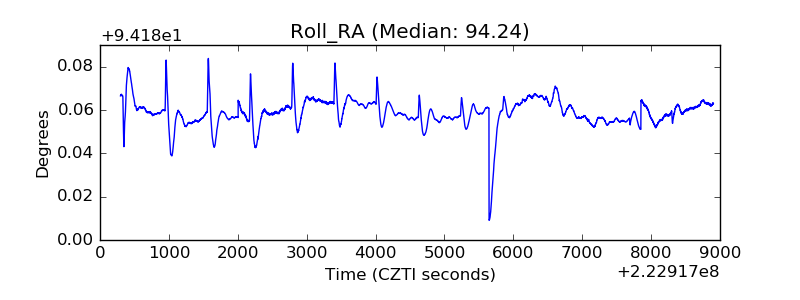 |
| Veto Counter | 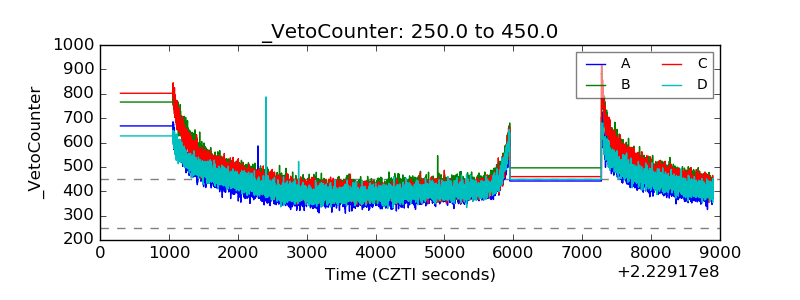 |