| Param | Original file | Final file |
|---|---|---|
| Filename | modeM0/AS1A02_175T01_9000000976_07166cztM0_level2.evt | modeM0/AS1A02_175T01_9000000976_07166cztM0_level2_quad_clean.evt |
| Size (bytes) | 394,122,240 | 61,035,840 |
| Size | 375.9 MB | 58.2 MB |
| Events in quadrant A | 2,877,154 | 369,830 |
| Events in quadrant B | 2,575,909 | 384,017 |
| Events in quadrant C | 2,847,167 | 375,951 |
| Events in quadrant D | 3,284,698 | 356,381 |
| Mode M0 | |||
|---|---|---|---|
| Quadrant | BADHDUFLAG | Total packets | Discarded packets |
| A | 0 | 11865 | 1 |
| B | 0 | 10862 | 1 |
| C | 0 | 11677 | 1 |
| D | 0 | 13071 | 1 |
| Mode SS | |||
|---|---|---|---|
| Quadrant | BADHDUFLAG | Total packets | Discarded packets |
| A | 0 | 108 | 0 |
| B | 0 | 108 | 0 |
| C | 0 | 108 | 0 |
| D | 0 | 108 | 0 |
| Mode M9 | |||
|---|---|---|---|
| Quadrant | BADHDUFLAG | Total packets | Discarded packets |
| A | 0 | 24 | 0 |
| B | 0 | 24 | 0 |
| C | 0 | 24 | 0 |
| D | 0 | 24 | 0 |
| Quadrant | Total seconds | Saturated seconds | Saturation percentage |
|---|---|---|---|
| A | 5160 | 119 | 2.306202% |
| B | 5160 | 81 | 1.569767% |
| C | 5160 | 118 | 2.286822% |
| D | 5160 | 166 | 3.217054% |
Noise dominated data is calculated using 1-second bins in cleaned event files. If a bin has >2000 counts, and if more than 50% of those come from <1% of pixels, then it is considered to be noise-dominated and hence unusable.
| Quadrant | # 1 sec bins | Bins with >0 counts | Bins with >2000 counts | High rate bins dominated by noise | Noise dominated (total time) | Noise dominated (detector-on time) | Marked lightcurve |
|---|---|---|---|---|---|---|---|
| A | 6434 | 5159 | 42 | 42 | 0.65% | 0.81% | 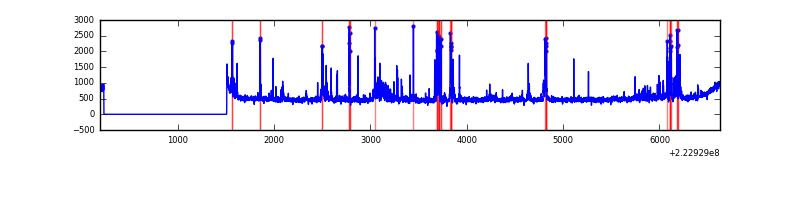 |
| B | 6434 | 5159 | 0 | 0 | 0.00% | 0.00% | 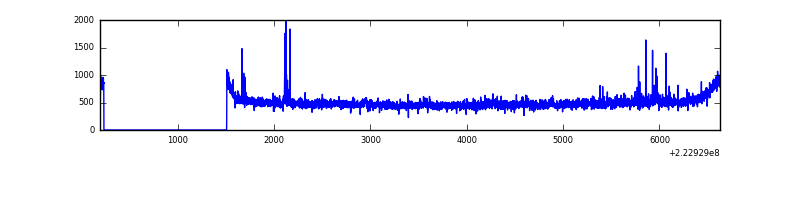 |
| C | 6434 | 5159 | 44 | 44 | 0.68% | 0.85% | 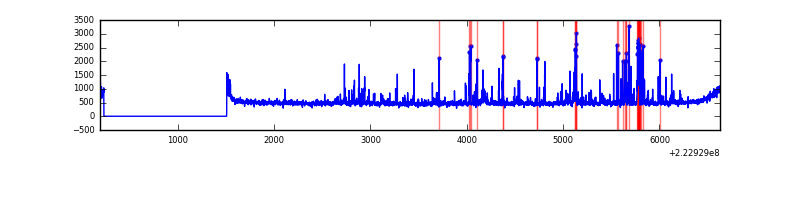 |
| D | 6434 | 5159 | 64 | 64 | 0.99% | 1.24% | 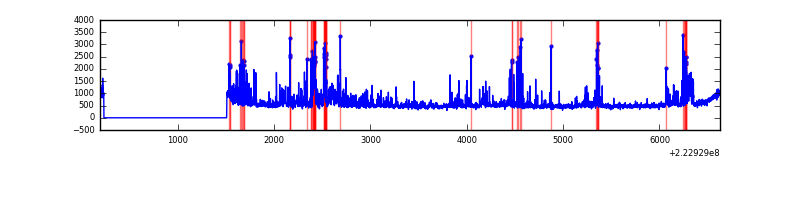 |
Top three noisy pixels from each quadrant. If the there are fewer than three noisy pixels in the level2.evt file, extra rows are filled as -1
| Pixel properties | Quadrant properties | ||||||
|---|---|---|---|---|---|---|---|
| Quadrant | DetID | PixID | Counts | Sigma | Mean | Median | Sigma |
| A | 14 | 238 | 249783 | 1936.12 | 628 | 615 | 128.7 |
| A | 8 | 15 | 183917 | 1424.32 | 628 | 615 | 128.7 |
| A | 3 | 1 | 14192 | 105.5 | 628 | 615 | 128.7 |
| B | 0 | 214 | 42877 | 341.75 | 639 | 624 | 123.6 |
| B | 15 | 204 | 33927 | 269.36 | 639 | 624 | 123.6 |
| B | 4 | 239 | 13260 | 102.2 | 639 | 624 | 123.6 |
| C | 4 | 254 | 285143 | 1965.63 | 614 | 618 | 144.7 |
| C | 7 | 247 | 89895 | 616.77 | 614 | 618 | 144.7 |
| C | 9 | 68 | 42497 | 289.32 | 614 | 618 | 144.7 |
| D | 2 | 216 | 327681 | 2180.48 | 610 | 591 | 150.0 |
| D | 2 | 14 | 221669 | 1473.77 | 610 | 591 | 150.0 |
| D | 8 | 195 | 207067 | 1376.43 | 610 | 591 | 150.0 |
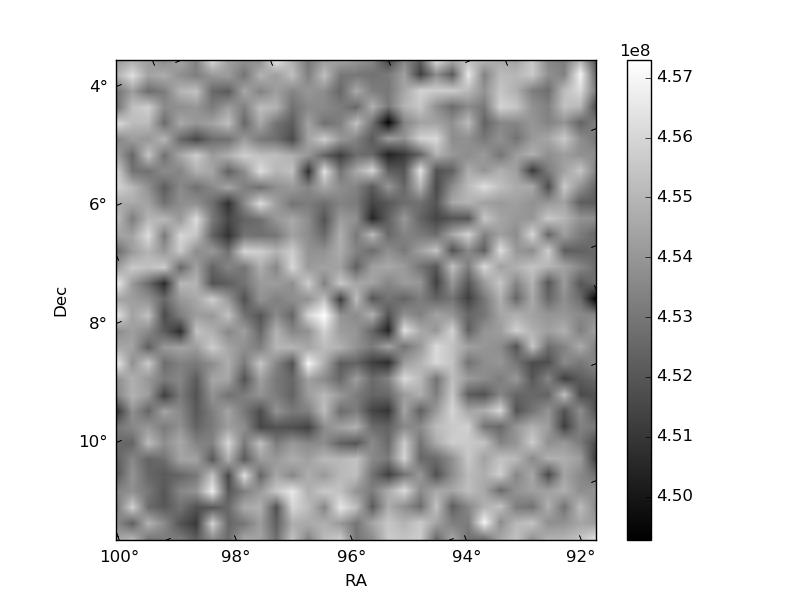
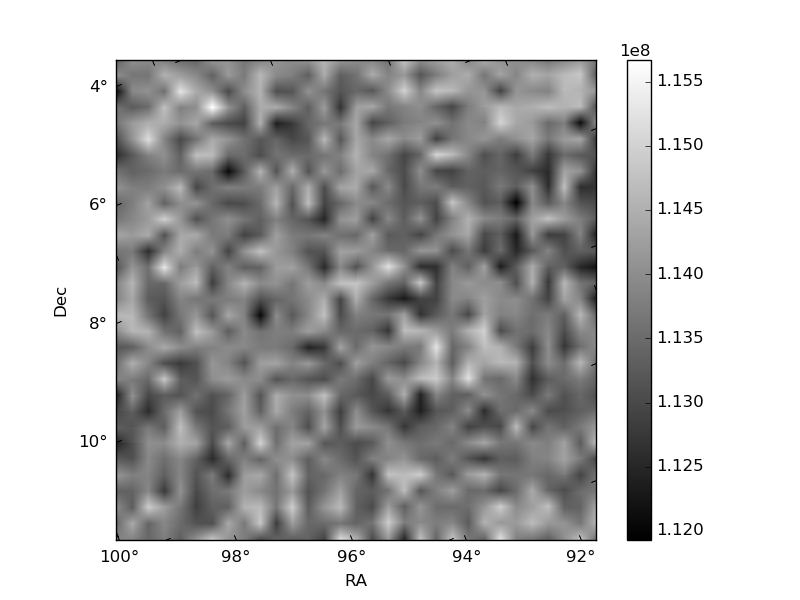
Histogram calculated using DETX and DETY for each event in the final _common_clean file
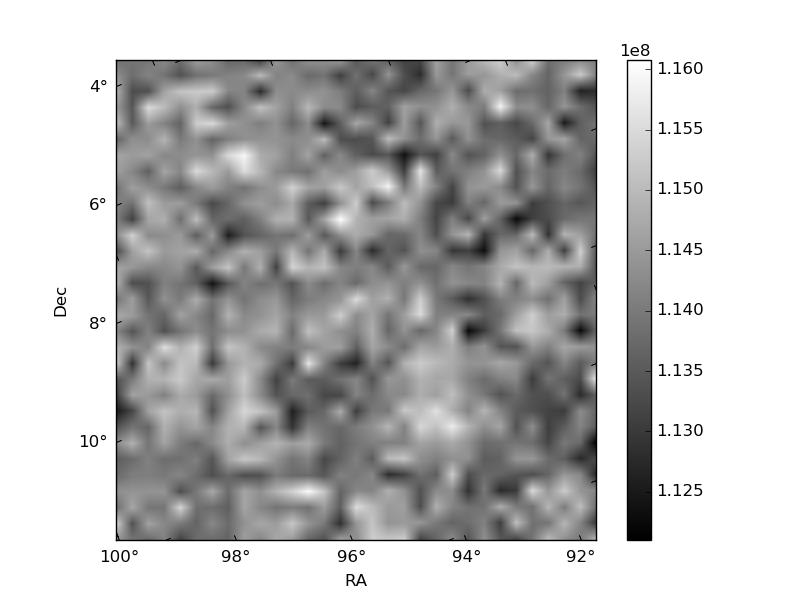
| Quadrant A | 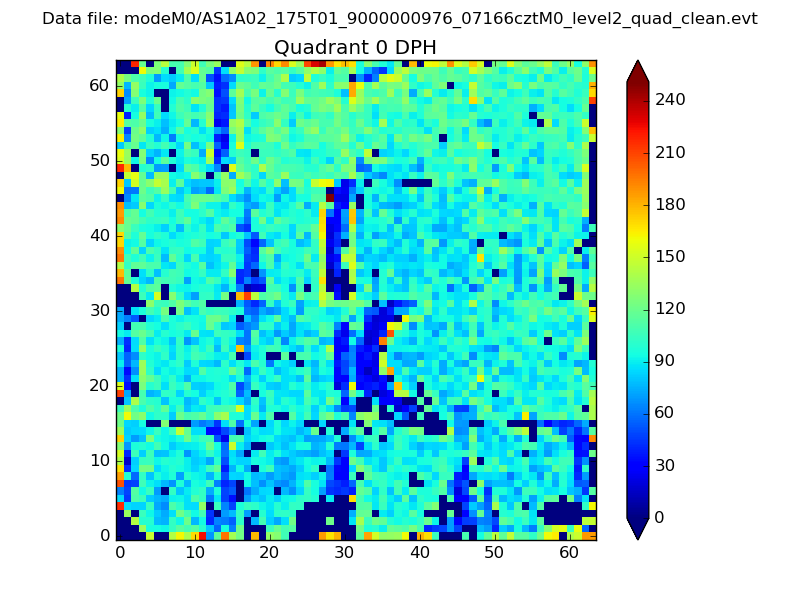 |
 |
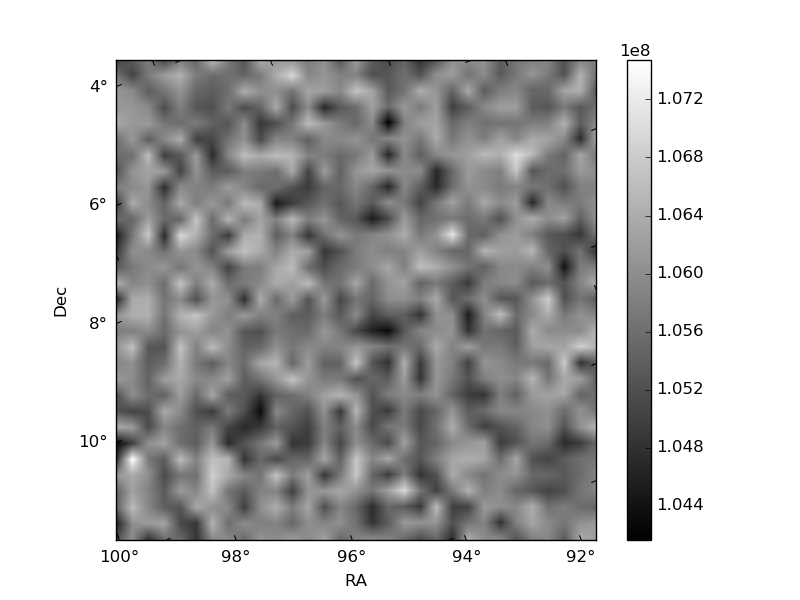
Quadrant B |
|---|---|---|---|
| Quadrant D | 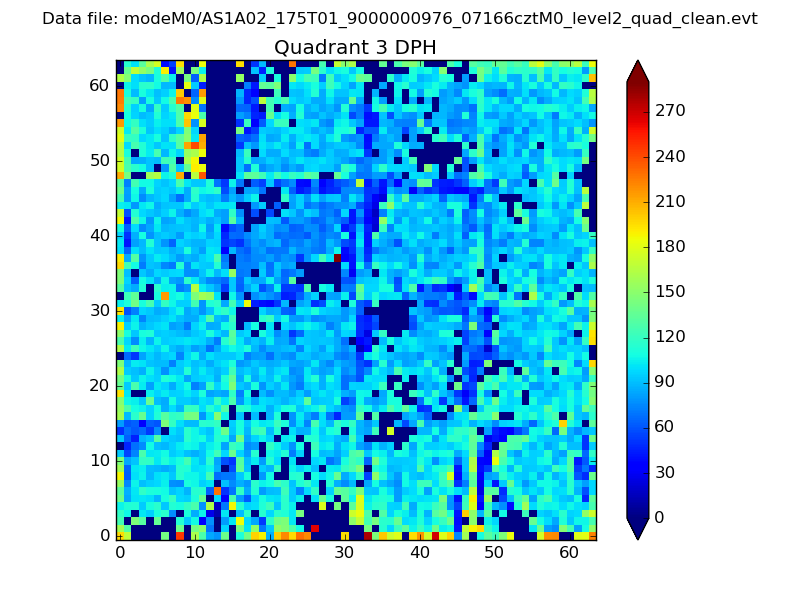 |
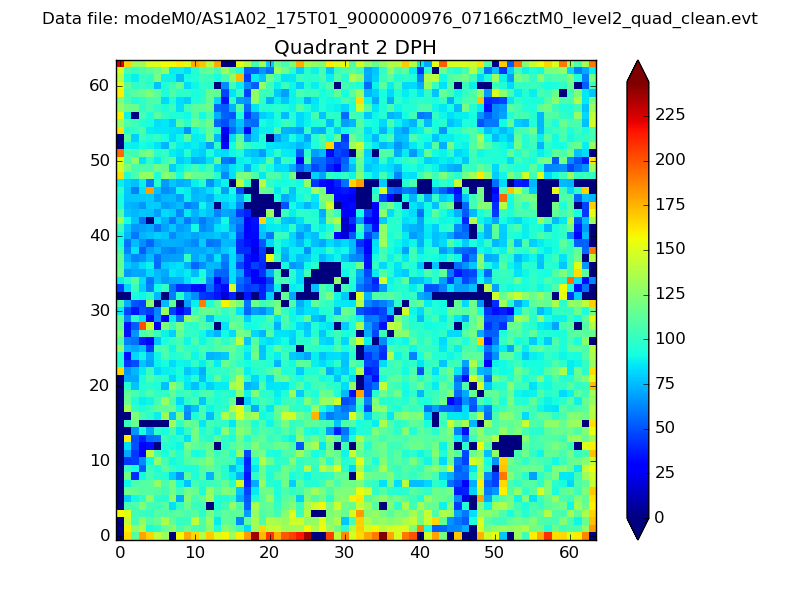 |
Quadrant C |
| Plot type | Count rate plots | Images |
|---|---|---|
| Comparison with Poisson distribution Blue bars denote a histogram of data divided into 1 sec bins. Red curve is a Poisson curve with rate = median count rate of data. |
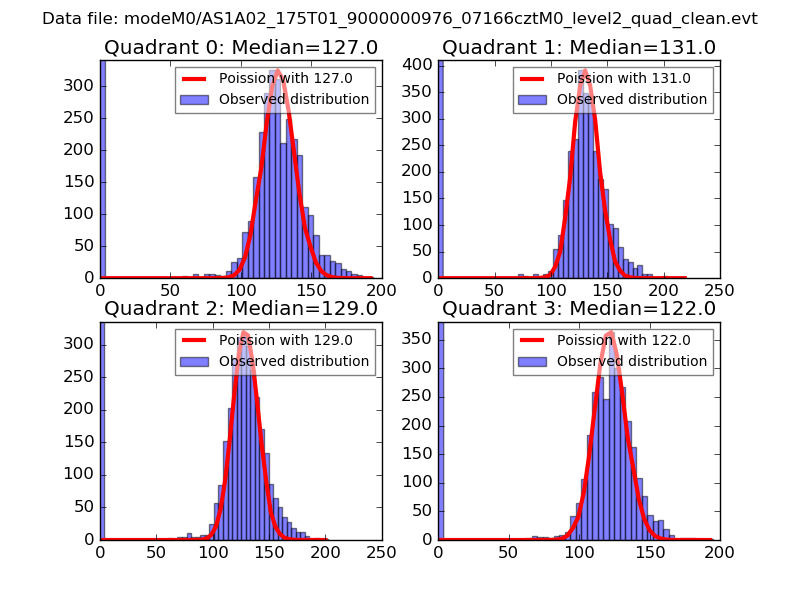 |
 |
| Quadrant-wise count rates Data is divided into 100 sec bins |
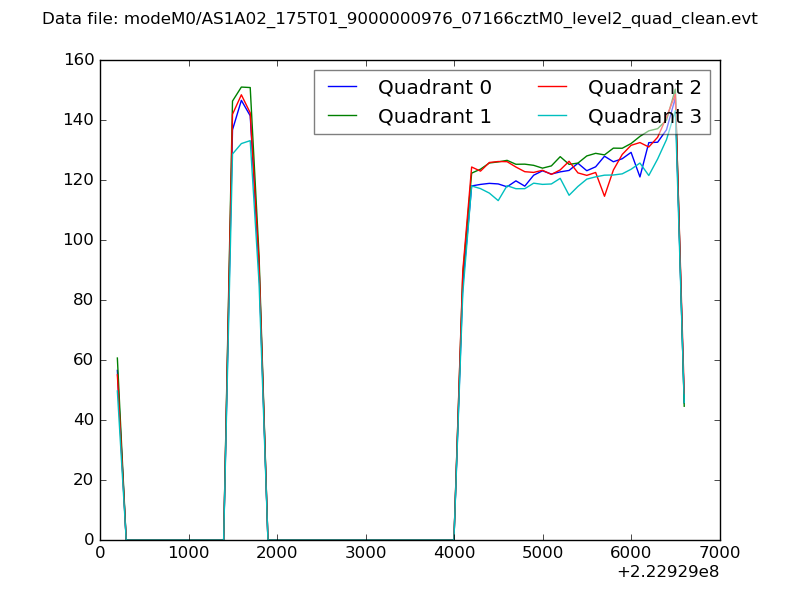 |
|
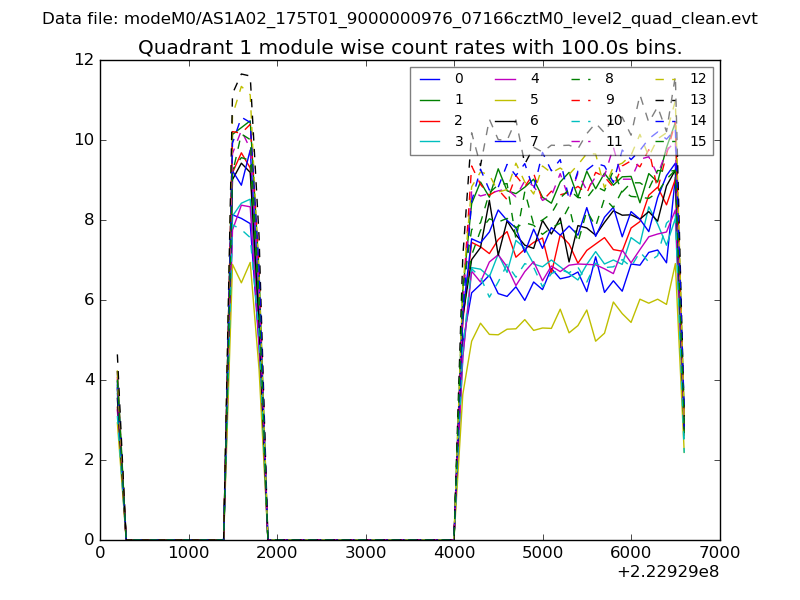
| Module-wise count rates for Quadrant A Data is divided into 100 sec bins |
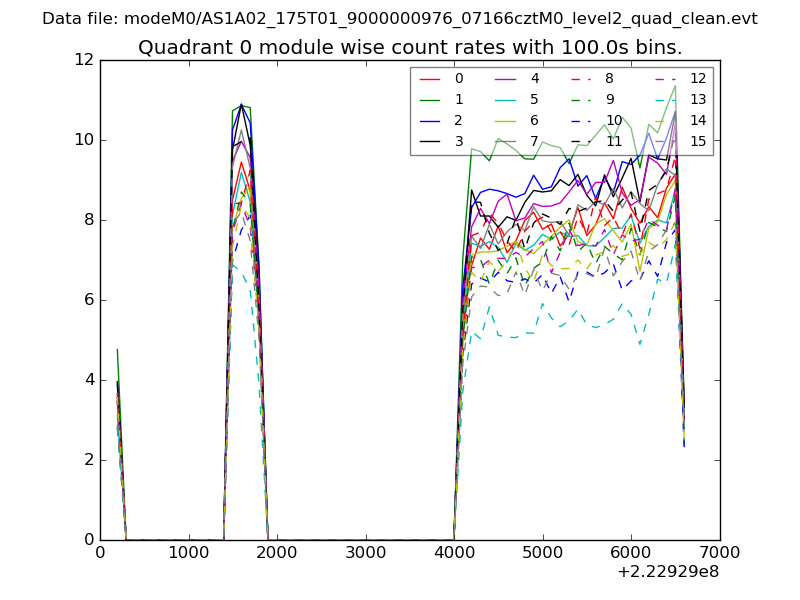 |
 |
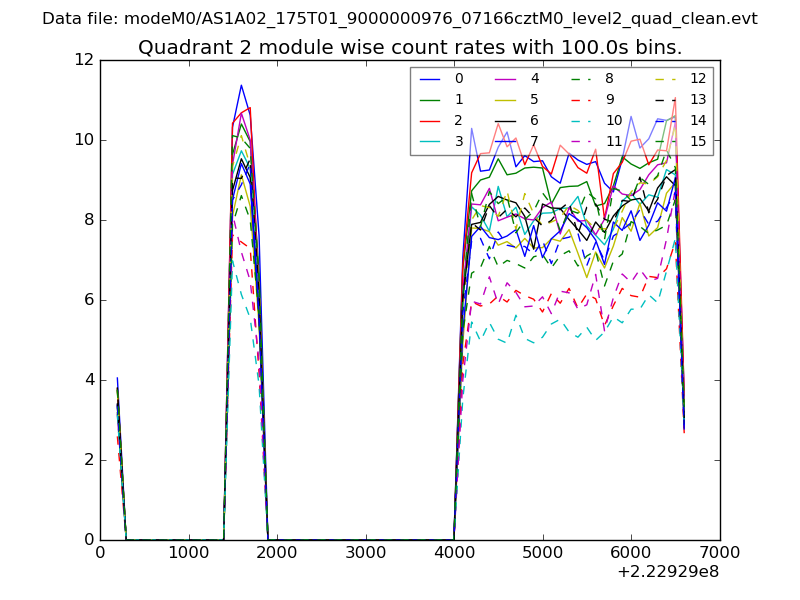
| Module-wise count rates for Quadrant B Data is divided into 100 sec bins |
 |
 |
| Module-wise count rates for Quadrant C Data is divided into 100 sec bins |
 |
 |
| Module-wise count rates for Quadrant D Data is divided into 100 sec bins |
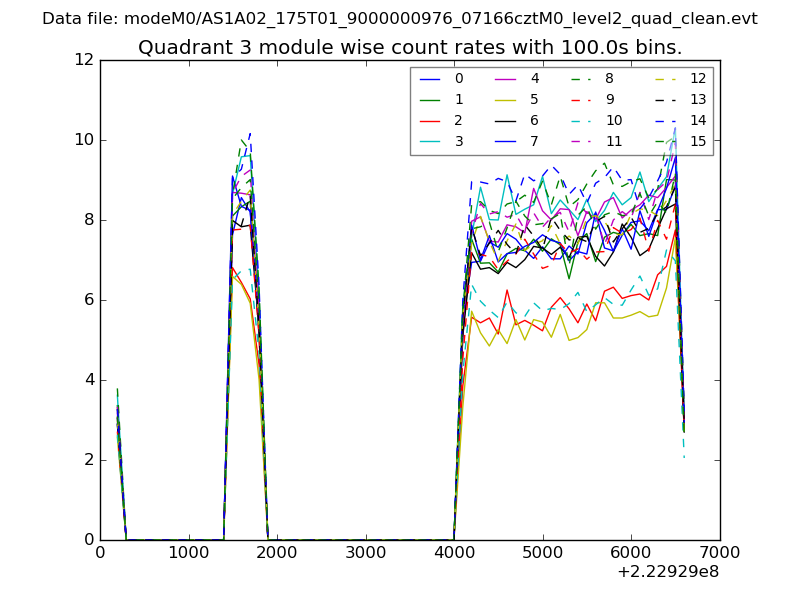 |
 |
| Parameter | Plot |
|---|---|
| CZT HV Monitor | 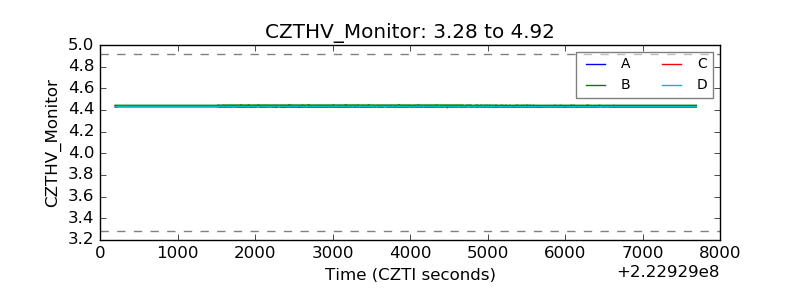 |
| D_VDD | 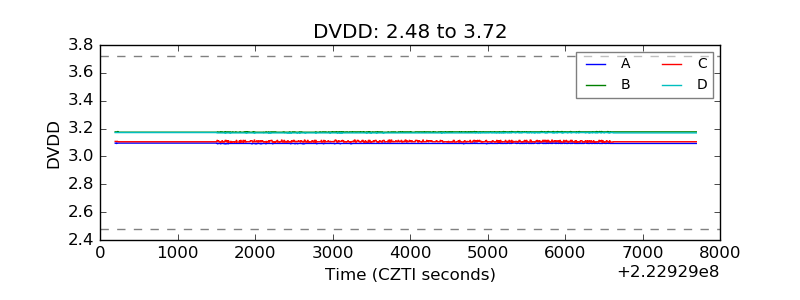 |
| Temperature 1 | 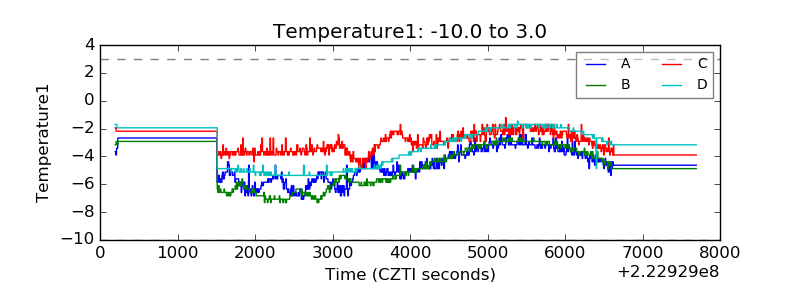 |
| Veto HV Monitor | 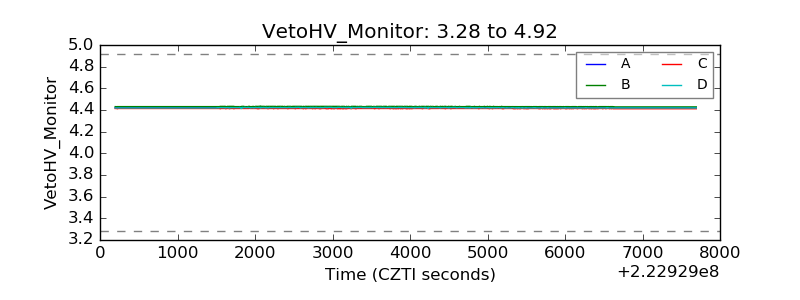 |
| Veto LLD | 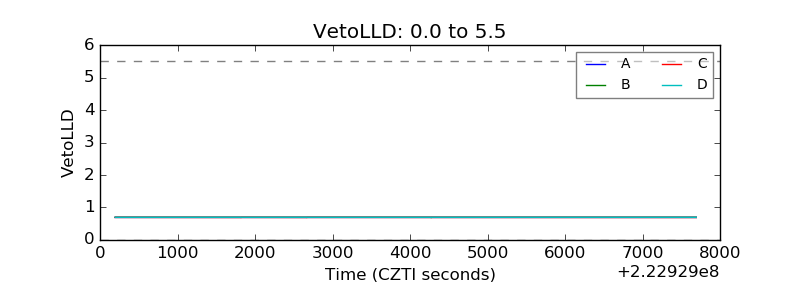 |
| Alpha Counter | 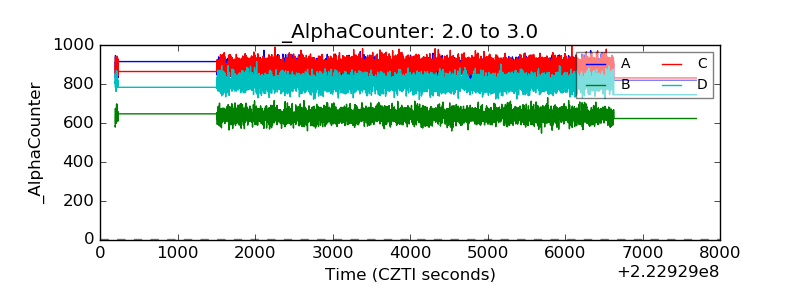 |
| _CPM_Rate | 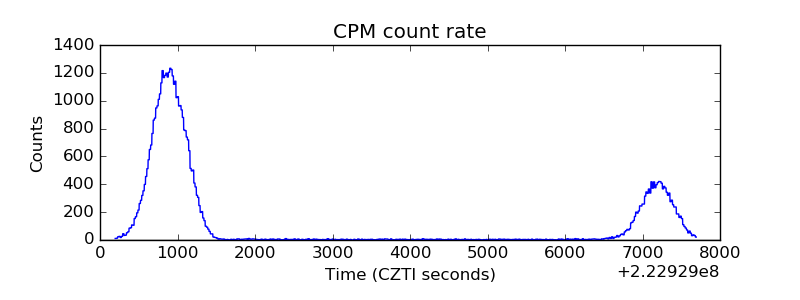 |
| CZT Counter | 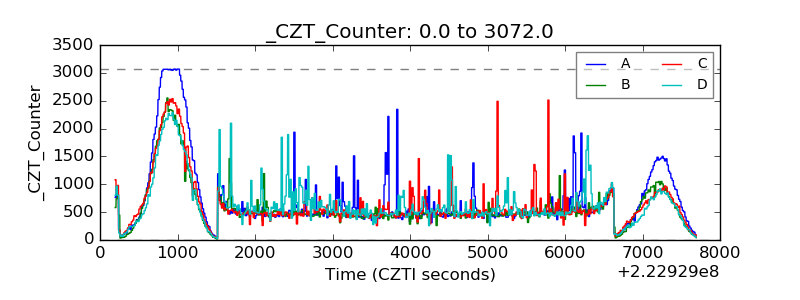 |
| +2.5 Volts monitor | 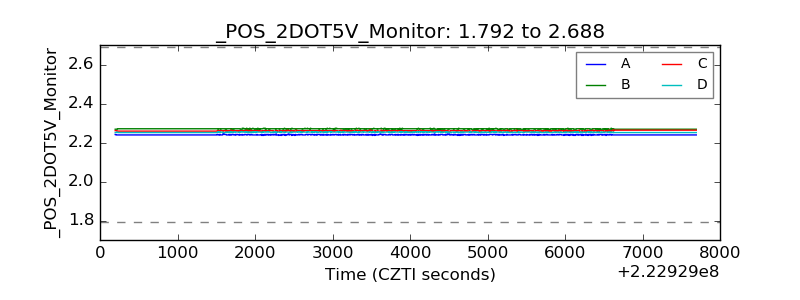 |
| +5 Volts monitor |  |
| _ROLL_ROT | 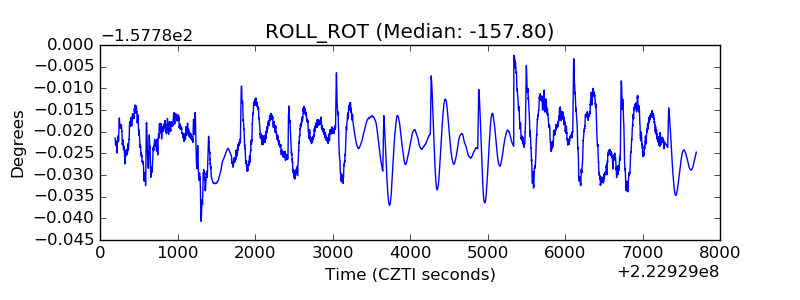 |
| _Roll_DEC | 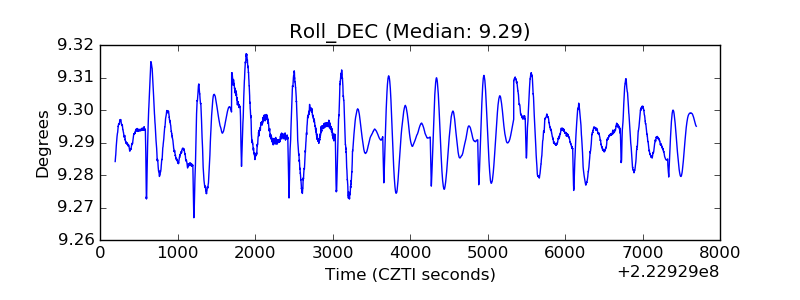 |
| _Roll_RA | 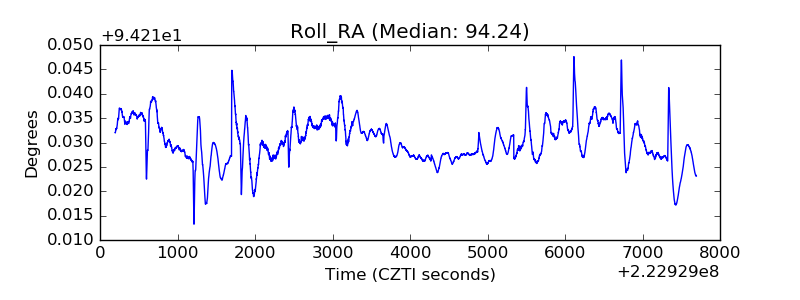 |
| Veto Counter | 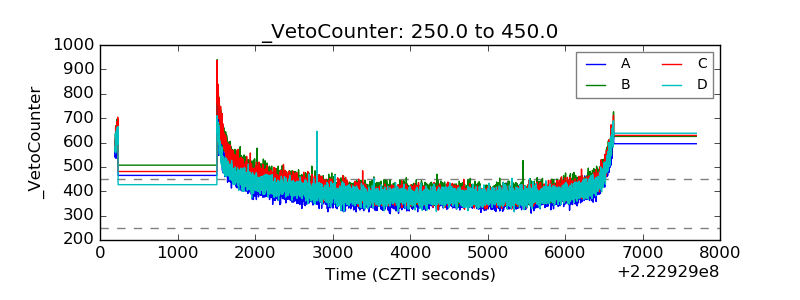 |