| Param | Original file | Final file |
|---|---|---|
| Filename | modeM0/AS1G06_102T01_9000000978cztM0_level2.fits | modeM0/AS1G06_102T01_9000000978cztM0_level2_quad_clean.evt |
| Size (bytes) | 415,915,200 | 380,931,840 |
| Size | 396.6 MB | 363.3 MB |
| Events in quadrant A | 2,494,612 | 2,191,102 |
| Events in quadrant B | 2,437,780 | 2,227,614 |
| Events in quadrant C | 2,480,632 | 2,135,987 |
| Events in quadrant D | 2,081,554 | 1,880,406 |
| Mode M0 | |||
|---|---|---|---|
| Quadrant | BADHDUFLAG | Total packets | Discarded packets |
| A | 0 | 97443 | 0 |
| B | 0 | 96673 | 0 |
| C | 0 | 94102 | 0 |
| D | 0 | 124674 | 0 |
| Mode SS | |||
|---|---|---|---|
| Quadrant | BADHDUFLAG | Total packets | Discarded packets |
| A | 0 | 926 | 0 |
| B | 0 | 924 | 0 |
| C | 0 | 924 | 0 |
| D | 0 | 926 | 0 |
| Mode M9 | |||
|---|---|---|---|
| Quadrant | BADHDUFLAG | Total packets | Discarded packets |
| A | 0 | 88 | 0 |
| B | 0 | 88 | 0 |
| C | 0 | 88 | 0 |
| D | 0 | 88 | 0 |
| Quadrant | Total seconds | Saturated seconds | Saturation percentage |
|---|---|---|---|
| A | 45157 | 518 | 1.147109% |
| B | 45155 | 447 | 0.989924% |
| C | 45159 | 325 | 0.719679% |
| D | 45158 | 2317 | 5.130874% |
Noise dominated data is calculated using 1-second bins in cleaned event files. If a bin has >2000 counts, and if more than 50% of those come from <1% of pixels, then it is considered to be noise-dominated and hence unusable.
| Quadrant | # 1 sec bins | Bins with >0 counts | Bins with >2000 counts | High rate bins dominated by noise | Noise dominated (total time) | Noise dominated (detector-on time) | Marked lightcurve |
|---|---|---|---|---|---|---|---|
| A | 74180 | 45175 | 0 | 0 | 0.00% | 0.00% |  |
| B | 74181 | 45172 | 0 | 0 | 0.00% | 0.00% |  |
| C | 74181 | 45176 | 0 | 0 | 0.00% | 0.00% |  |
| D | 74181 | 45165 | 0 | 0 | 0.00% | 0.00% |  |
Top three noisy pixels from each quadrant. If the there are fewer than three noisy pixels in the level2.evt file, extra rows are filled as -1
| Pixel properties | Quadrant properties | ||||||
|---|---|---|---|---|---|---|---|
| Quadrant | DetID | PixID | Counts | Sigma | Mean | Median | Sigma |
| A | 0 | 29 | 2471 | 11.16 | 648 | 605 | 167.3 |
| A | 7 | 110 | 2043 | 8.6 | 648 | 605 | 167.3 |
| A | 0 | 30 | 1867 | 7.54 | 648 | 605 | 167.3 |
| B | 2 | 9 | 2093 | 11.53 | 642 | 610 | 128.6 |
| B | 12 | 226 | 1729 | 8.7 | 642 | 610 | 128.6 |
| B | 3 | 17 | 1633 | 7.95 | 642 | 610 | 128.6 |
| C | 1 | 80 | 1822 | 6.94 | 654 | 605 | 175.5 |
| C | 1 | 81 | 1799 | 6.8 | 654 | 605 | 175.5 |
| C | 12 | 241 | 1761 | 6.59 | 654 | 605 | 175.5 |
| D | 15 | 47 | 1534 | 6.2 | 592 | 536 | 161.0 |
| D | 3 | 14 | 1521 | 6.12 | 592 | 536 | 161.0 |
| D | 7 | 5 | 1505 | 6.02 | 592 | 536 | 161.0 |
Histogram calculated using DETX and DETY for each event in the final _common_clean file
| Quadrant A | 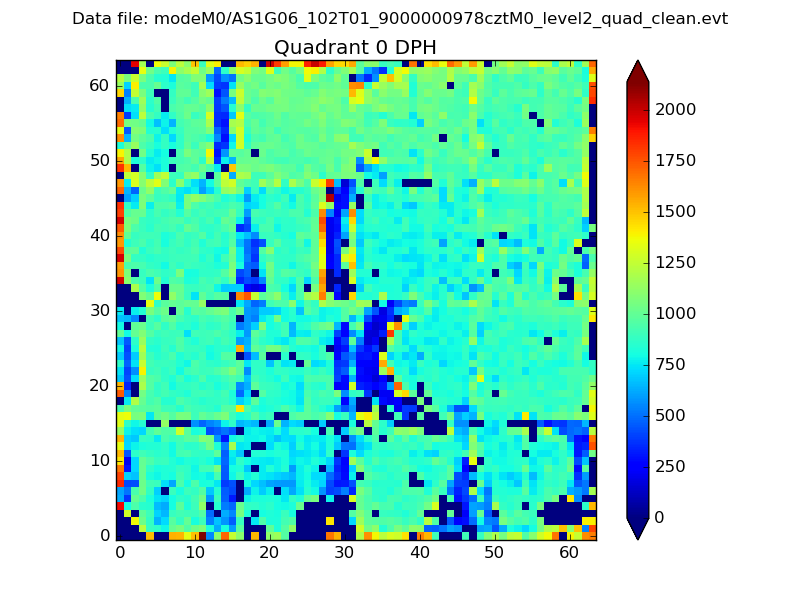 |
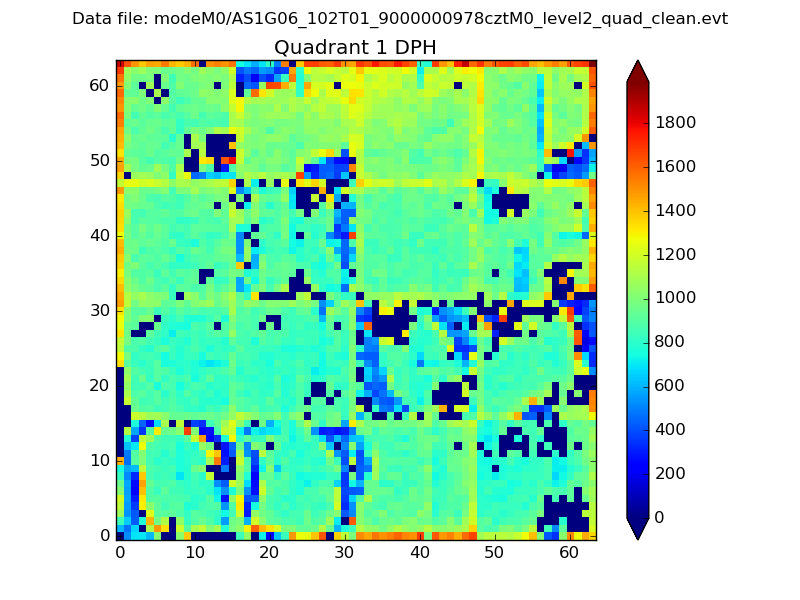 |
Quadrant B |
|---|---|---|---|
| Quadrant D | 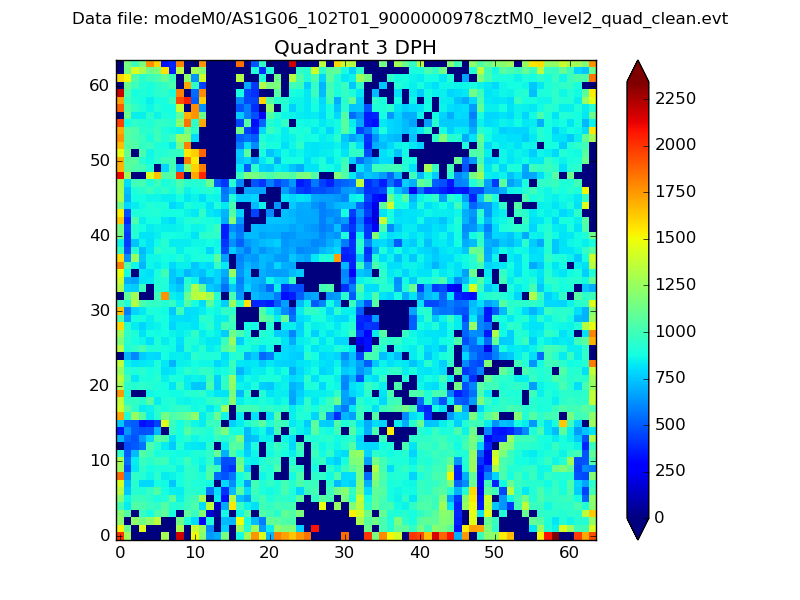 |
 |
Quadrant C |
| Plot type | Count rate plots | Images |
|---|---|---|
| Comparison with Poisson distribution Blue bars denote a histogram of data divided into 1 sec bins. Red curve is a Poisson curve with rate = median count rate of data. |
 |
 |
| Quadrant-wise count rates Data is divided into 100 sec bins |
 |
|
| Module-wise count rates for Quadrant A Data is divided into 100 sec bins |
 |
 |
| Module-wise count rates for Quadrant B Data is divided into 100 sec bins |
 |
 |
| Module-wise count rates for Quadrant C Data is divided into 100 sec bins |
 |
 |
| Module-wise count rates for Quadrant D Data is divided into 100 sec bins |
 |
 |
| Parameter | Plot |
|---|---|
| CZT HV Monitor |  |
| D_VDD | 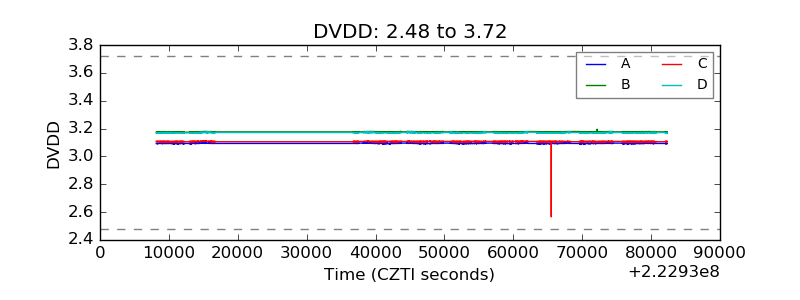 |
| Temperature 1 |  |
| Veto HV Monitor |  |
| Veto LLD |  |
| Alpha Counter |  |
| _CPM_Rate |  |
| CZT Counter |  |
| +2.5 Volts monitor |  |
| +5 Volts monitor |  |
| _ROLL_ROT |  |
| _Roll_DEC |  |
| _Roll_RA |  |
| Veto Counter | 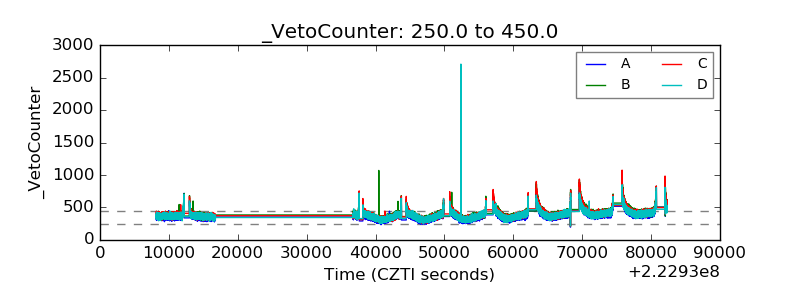 |