| Param | Original file | Final file |
|---|---|---|
| Filename | modeM0/AS1G06_102T01_9000000978_07167cztM0_level2.evt | modeM0/AS1G06_102T01_9000000978_07167cztM0_level2_quad_clean.evt |
| Size (bytes) | 396,578,880 | 60,160,320 |
| Size | 378.2 MB | 57.4 MB |
| Events in quadrant A | 2,980,566 | 358,238 |
| Events in quadrant B | 2,529,740 | 374,772 |
| Events in quadrant C | 2,828,080 | 364,230 |
| Events in quadrant D | 3,304,467 | 345,998 |
| Mode M0 | |||
|---|---|---|---|
| Quadrant | BADHDUFLAG | Total packets | Discarded packets |
| A | 0 | 12438 | 3 |
| B | 0 | 11088 | 1 |
| C | 0 | 12160 | 1 |
| D | 0 | 13265 | 1 |
| Mode SS | |||
|---|---|---|---|
| Quadrant | BADHDUFLAG | Total packets | Discarded packets |
| A | 0 | 112 | 0 |
| B | 0 | 112 | 0 |
| C | 0 | 112 | 0 |
| D | 0 | 112 | 0 |
| Mode M9 | |||
|---|---|---|---|
| Quadrant | BADHDUFLAG | Total packets | Discarded packets |
| A | 0 | 7 | 0 |
| B | 0 | 7 | 0 |
| C | 0 | 7 | 0 |
| D | 0 | 7 | 0 |
| Quadrant | Total seconds | Saturated seconds | Saturation percentage |
|---|---|---|---|
| A | 5391 | 207 | 3.839733% |
| B | 5392 | 88 | 1.632047% |
| C | 5392 | 127 | 2.355341% |
| D | 5392 | 199 | 3.690653% |
Noise dominated data is calculated using 1-second bins in cleaned event files. If a bin has >2000 counts, and if more than 50% of those come from <1% of pixels, then it is considered to be noise-dominated and hence unusable.
| Quadrant | # 1 sec bins | Bins with >0 counts | Bins with >2000 counts | High rate bins dominated by noise | Noise dominated (total time) | Noise dominated (detector-on time) | Marked lightcurve |
|---|---|---|---|---|---|---|---|
| A | 6162 | 5392 | 80 | 80 | 1.30% | 1.48% | 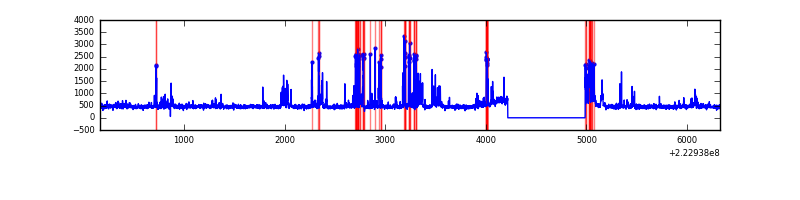 |
| B | 6163 | 5393 | 0 | 0 | 0.00% | 0.00% | 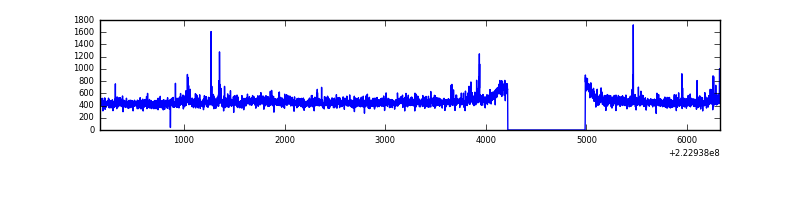 |
| C | 6163 | 5393 | 55 | 55 | 0.89% | 1.02% | 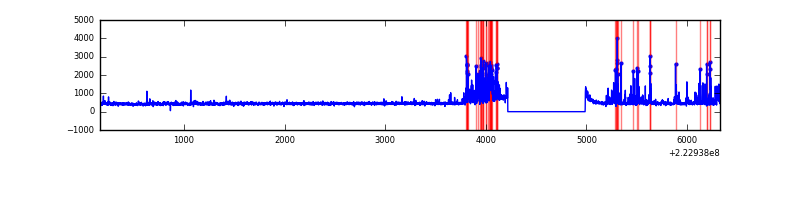 |
| D | 6163 | 5393 | 100 | 100 | 1.62% | 1.85% | 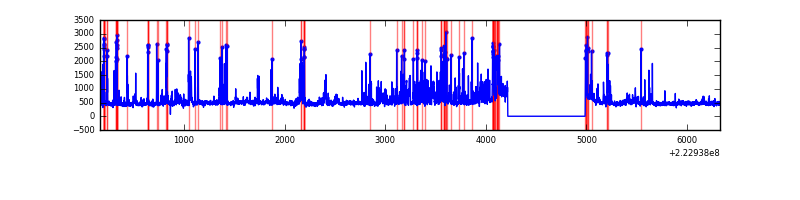 |
Top three noisy pixels from each quadrant. If the there are fewer than three noisy pixels in the level2.evt file, extra rows are filled as -1
| Pixel properties | Quadrant properties | ||||||
|---|---|---|---|---|---|---|---|
| Quadrant | DetID | PixID | Counts | Sigma | Mean | Median | Sigma |
| A | 14 | 238 | 508581 | 3963.28 | 623 | 609 | 128.2 |
| A | 8 | 15 | 53642 | 413.77 | 623 | 609 | 128.2 |
| A | 14 | 239 | 14710 | 110.02 | 623 | 609 | 128.2 |
| B | 4 | 81 | 30013 | 238.44 | 633 | 615 | 123.3 |
| B | 0 | 214 | 19289 | 151.46 | 633 | 615 | 123.3 |
| B | 12 | 111 | 12841 | 99.16 | 633 | 615 | 123.3 |
| C | 4 | 254 | 412743 | 2913.61 | 608 | 611 | 141.5 |
| C | 7 | 247 | 19373 | 132.64 | 608 | 611 | 141.5 |
| C | 9 | 68 | 18579 | 127.03 | 608 | 611 | 141.5 |
| D | 2 | 216 | 490824 | 3292.36 | 603 | 583 | 148.9 |
| D | 8 | 195 | 231271 | 1549.26 | 603 | 583 | 148.9 |
| D | 2 | 14 | 124990 | 835.49 | 603 | 583 | 148.9 |
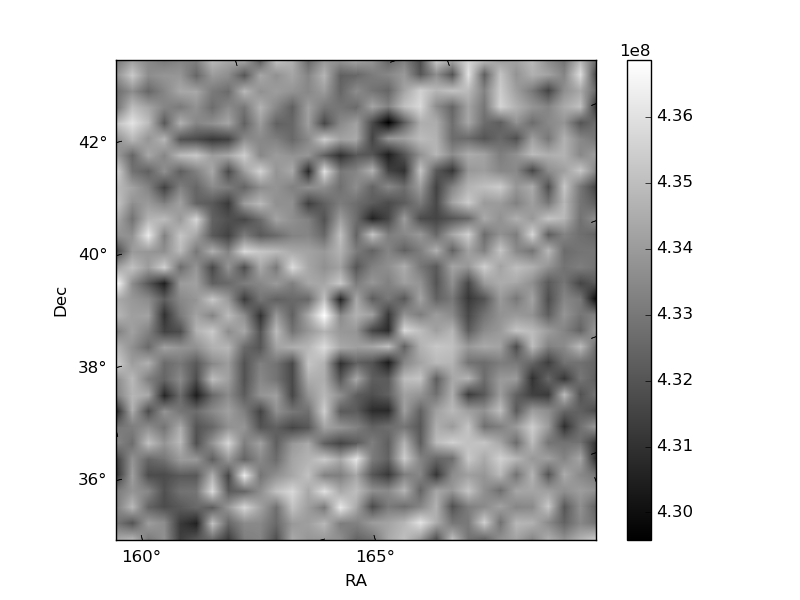
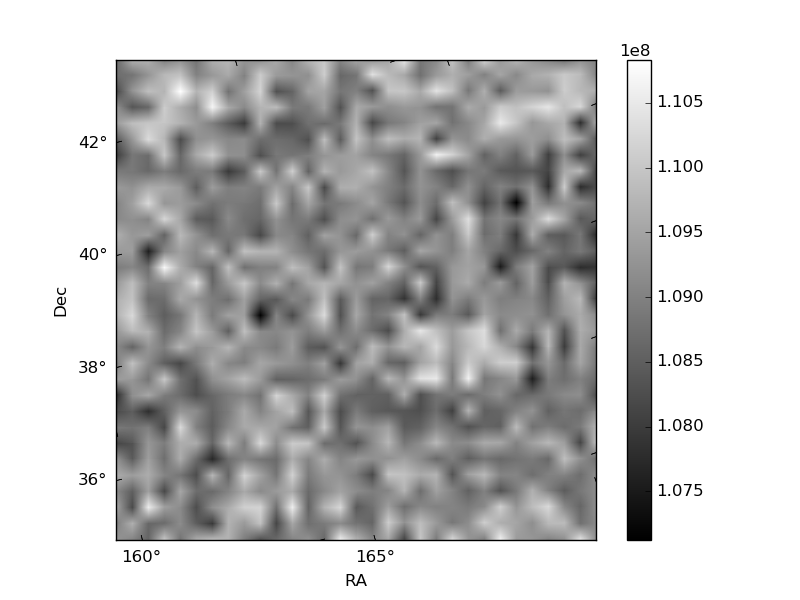
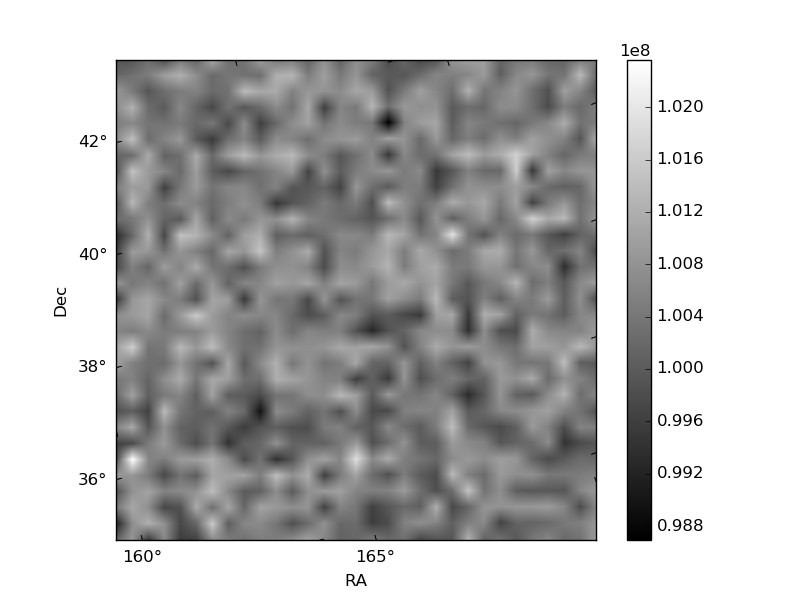
Histogram calculated using DETX and DETY for each event in the final _common_clean file
| Quadrant A | 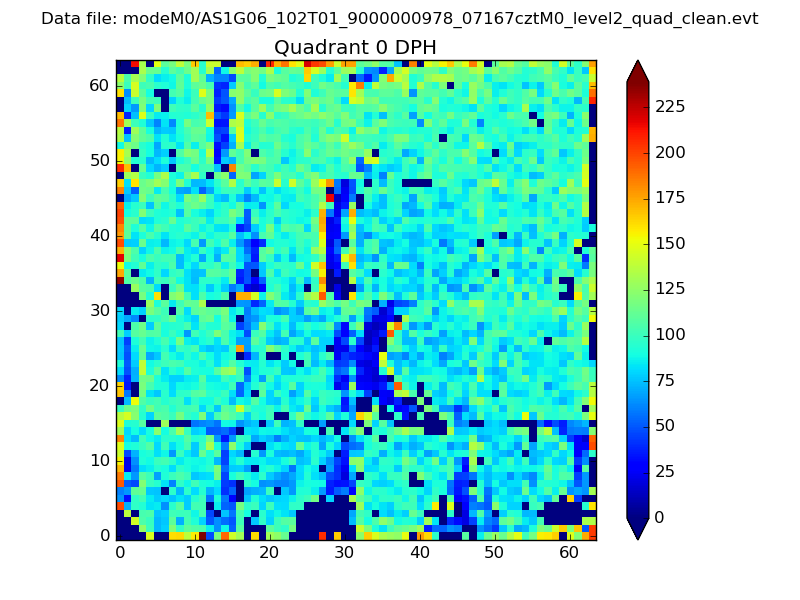 |
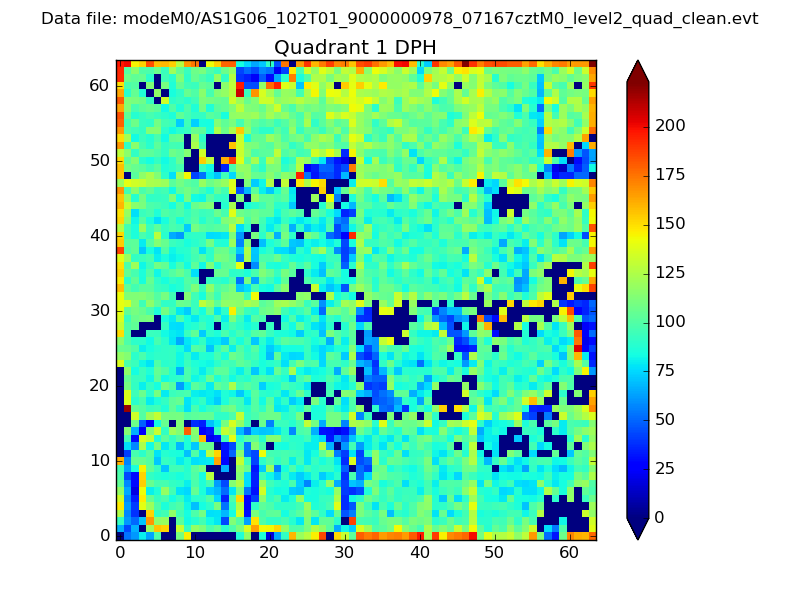 |
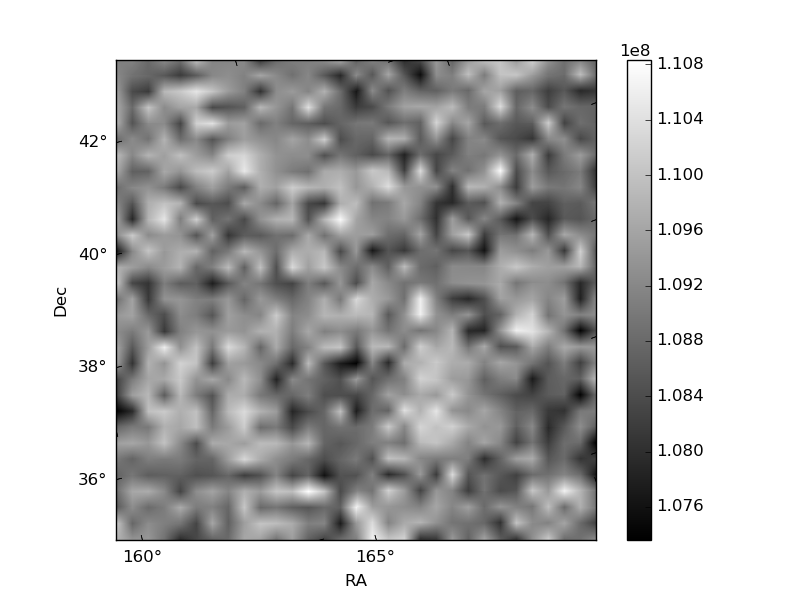
Quadrant B |
|---|---|---|---|
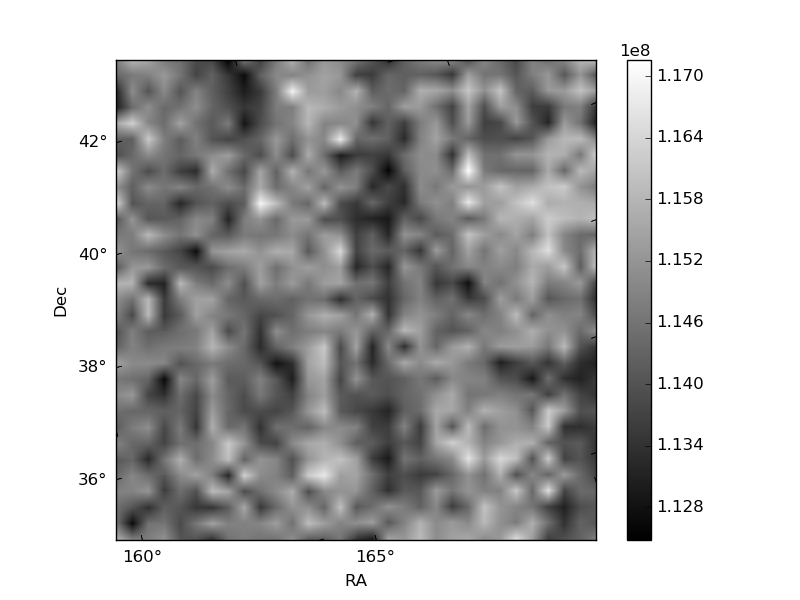
| Quadrant D | 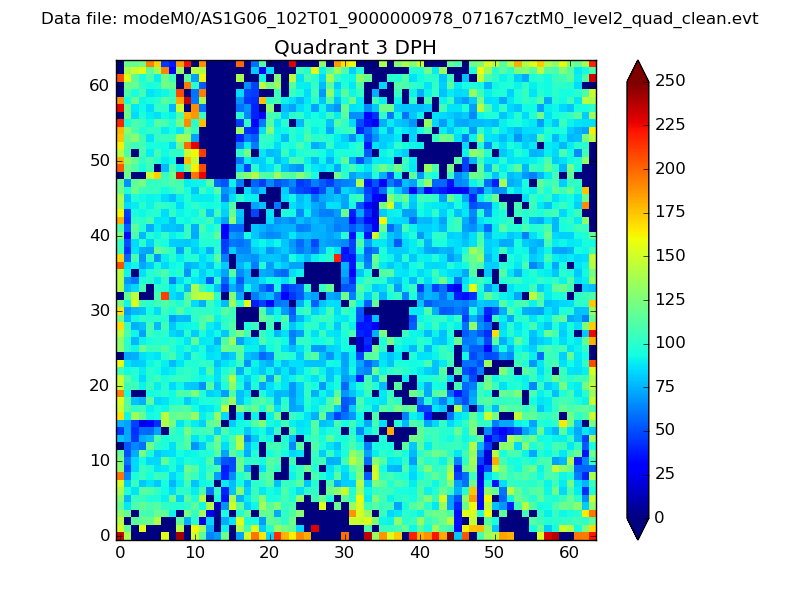 |
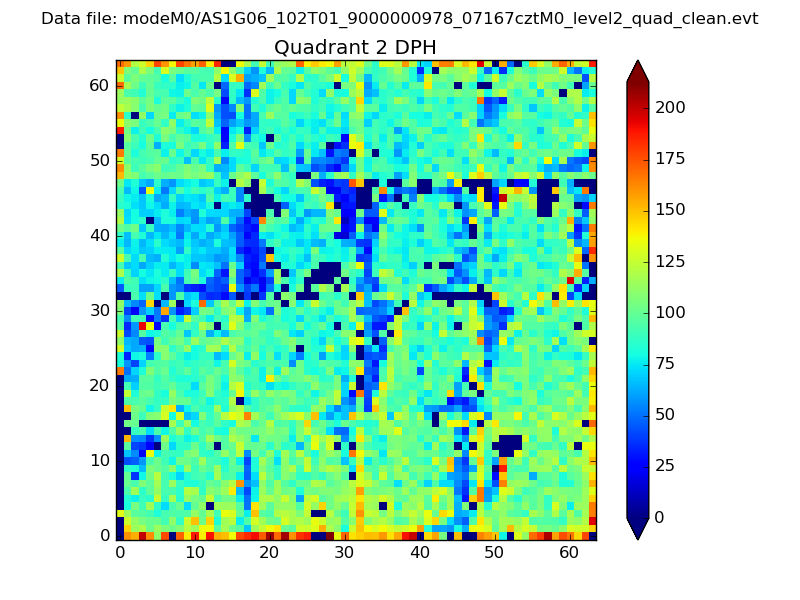 |
Quadrant C |
| Plot type | Count rate plots | Images |
|---|---|---|
| Comparison with Poisson distribution Blue bars denote a histogram of data divided into 1 sec bins. Red curve is a Poisson curve with rate = median count rate of data. |
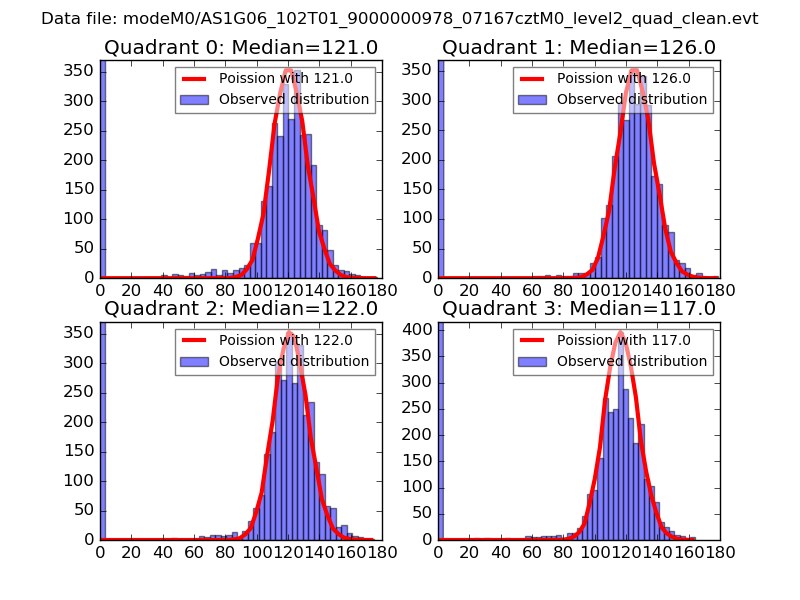 |
 |
| Quadrant-wise count rates Data is divided into 100 sec bins |
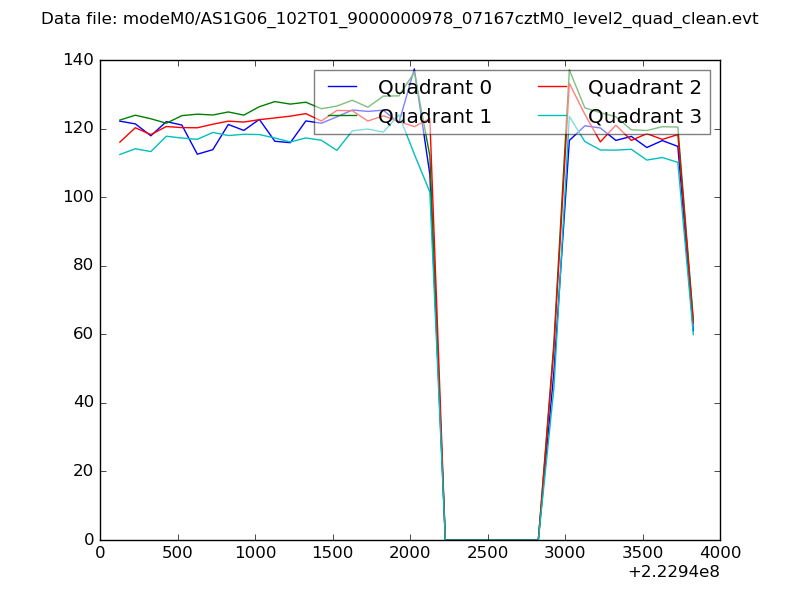 |
|
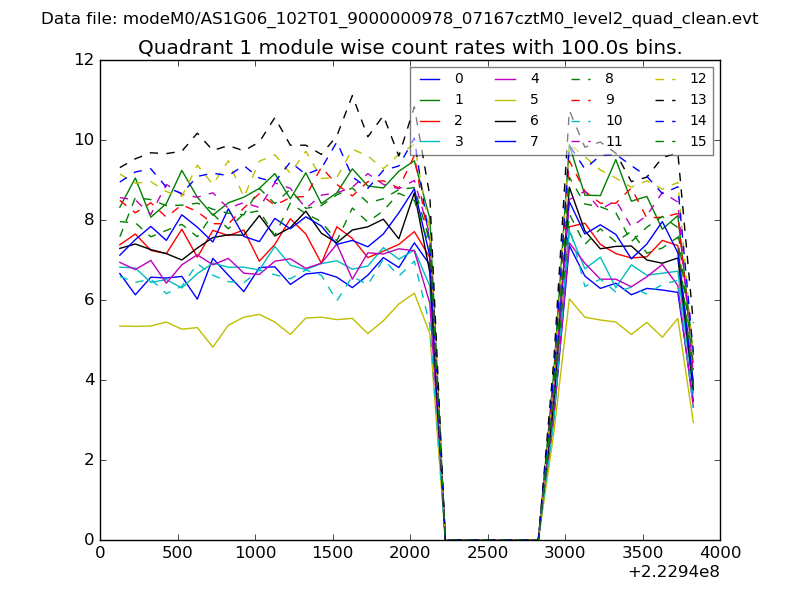
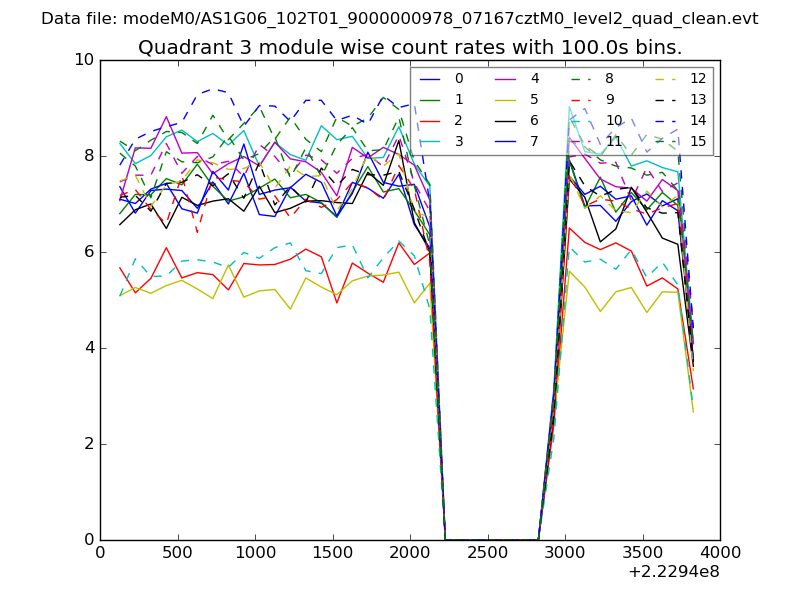
| Module-wise count rates for Quadrant A Data is divided into 100 sec bins |
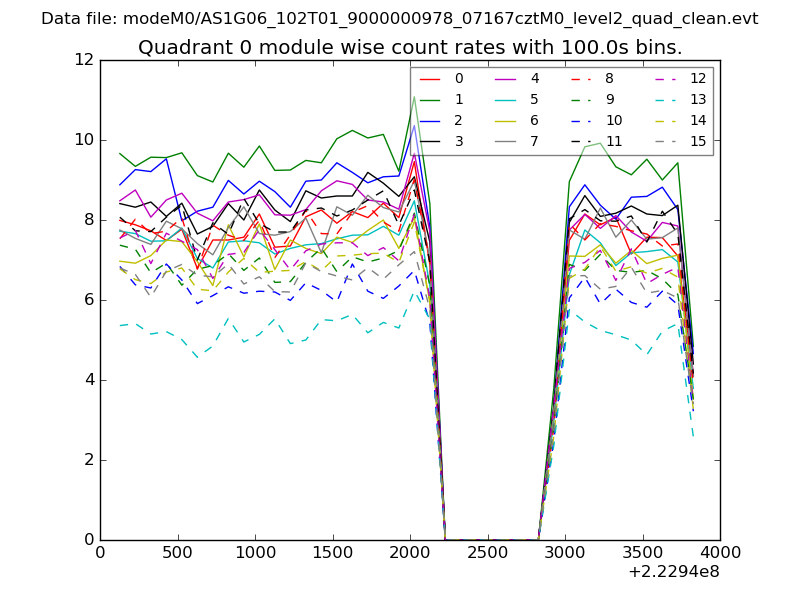 |
 |
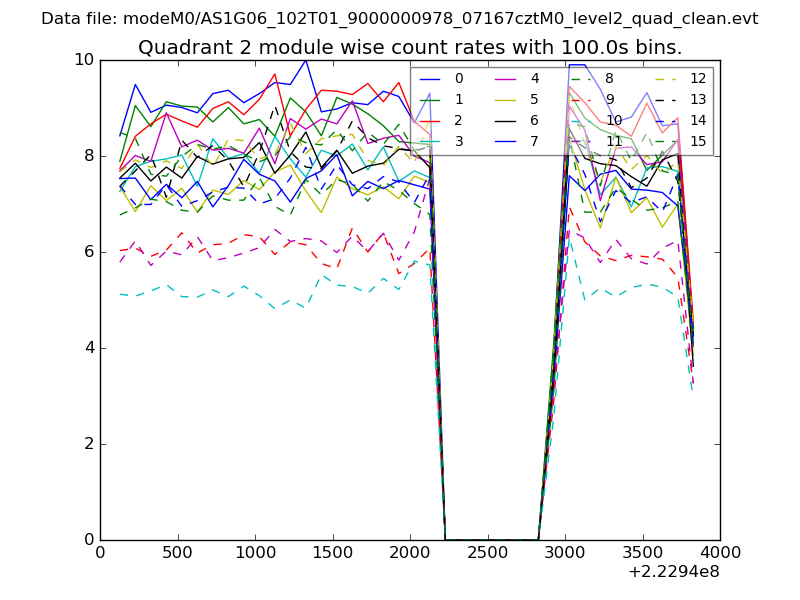
| Module-wise count rates for Quadrant B Data is divided into 100 sec bins |
 |
 |
| Module-wise count rates for Quadrant C Data is divided into 100 sec bins |
 |
 |
| Module-wise count rates for Quadrant D Data is divided into 100 sec bins |
 |
 |
| Parameter | Plot |
|---|---|
| CZT HV Monitor | 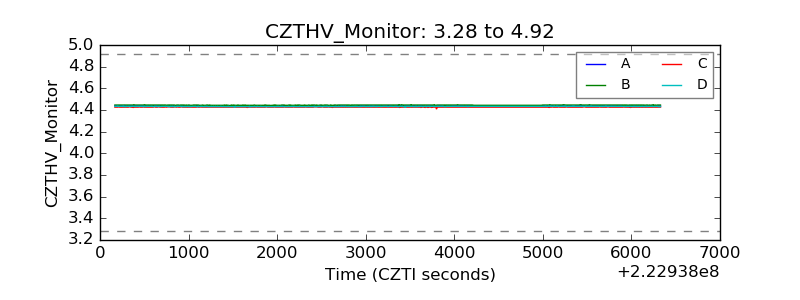 |
| D_VDD | 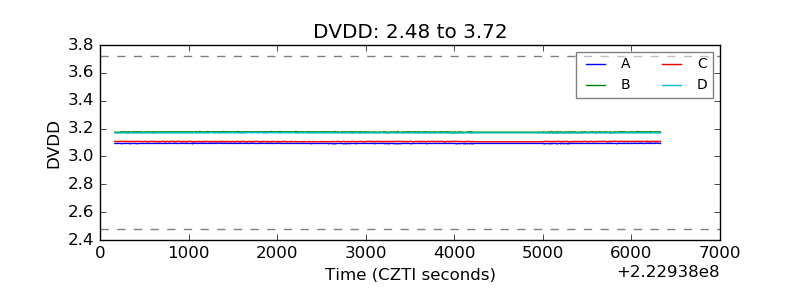 |
| Temperature 1 | 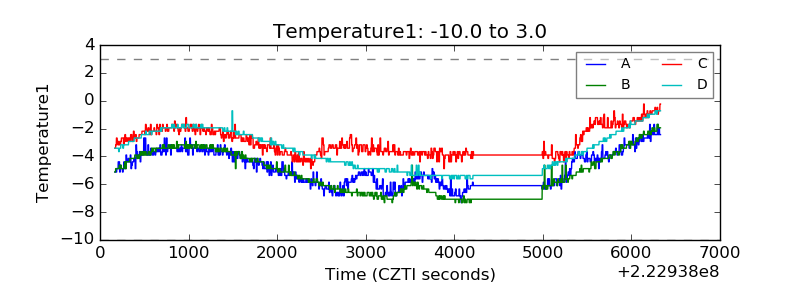 |
| Veto HV Monitor | 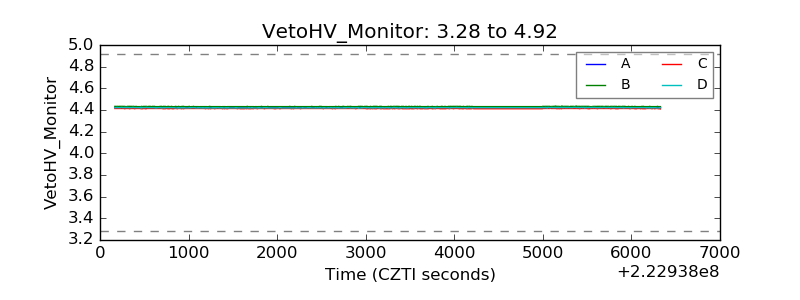 |
| Veto LLD | 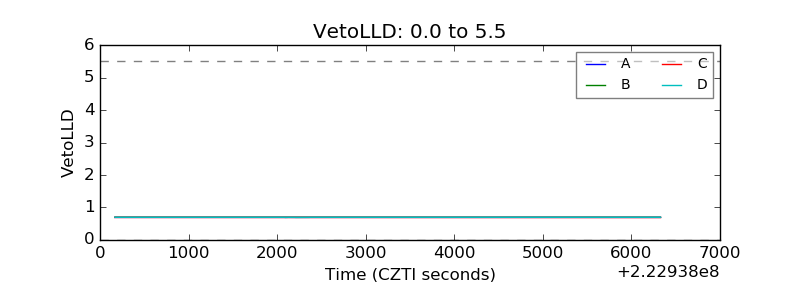 |
| Alpha Counter | 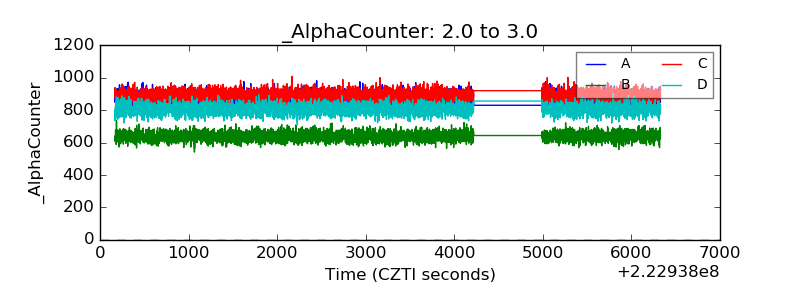 |
| _CPM_Rate | 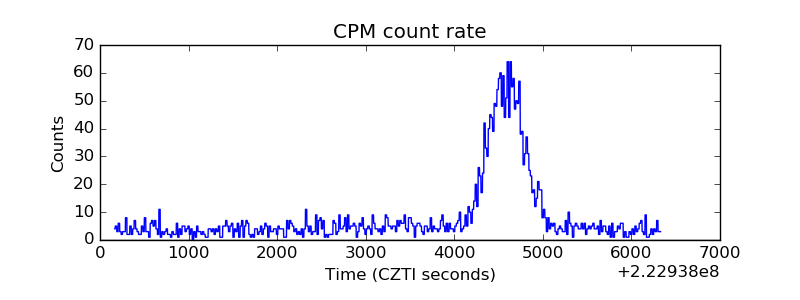 |
| CZT Counter | 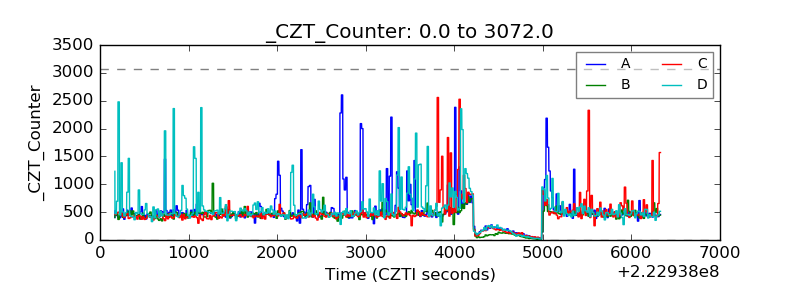 |
| +2.5 Volts monitor |  |
| +5 Volts monitor |  |
| _ROLL_ROT | 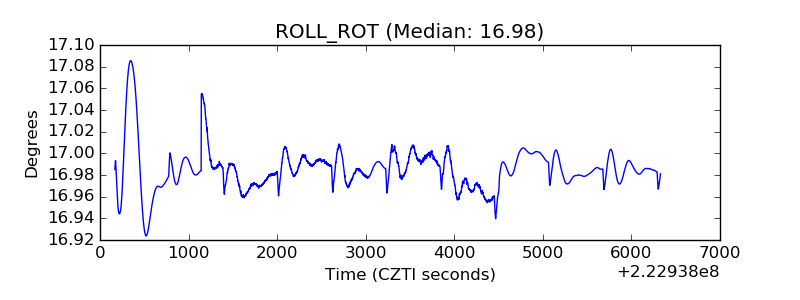 |
| _Roll_DEC | 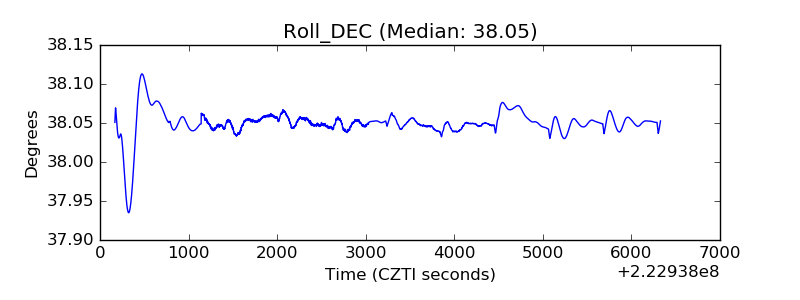 |
| _Roll_RA | 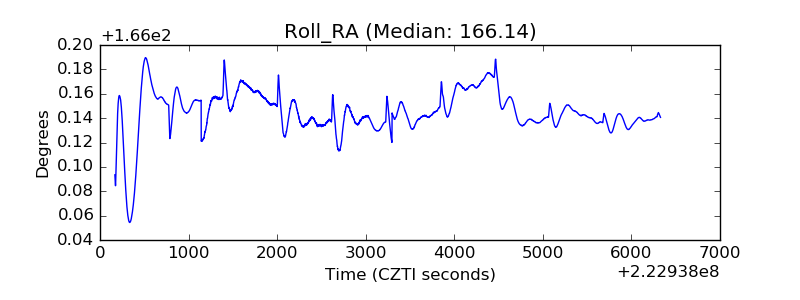 |
| Veto Counter | 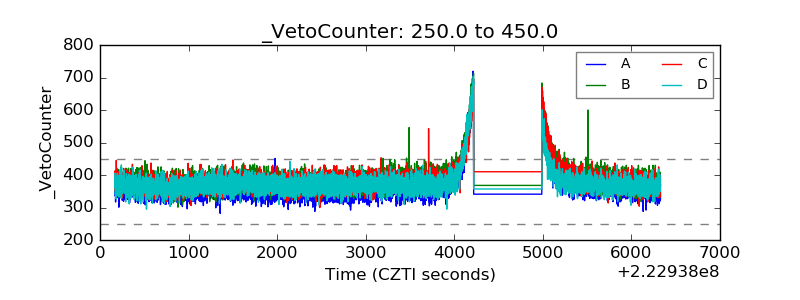 |