| Param | Original file | Final file |
|---|---|---|
| Filename | modeM0/AS1G06_102T01_9000000978_07169cztM0_level2.evt | modeM0/AS1G06_102T01_9000000978_07169cztM0_level2_quad_clean.evt |
| Size (bytes) | 86,826,240 | 22,233,600 |
| Size | 82.8 MB | 21.2 MB |
| Events in quadrant A | 599,557 | 145,363 |
| Events in quadrant B | 581,356 | 148,383 |
| Events in quadrant C | 570,888 | 144,663 |
| Events in quadrant D | 788,359 | 138,973 |
| Mode M0 | |||
|---|---|---|---|
| Quadrant | BADHDUFLAG | Total packets | Discarded packets |
| A | 0 | 2929 | 230 |
| B | 0 | 2876 | 233 |
| C | 0 | 2905 | 258 |
| D | 0 | 3606 | 408 |
| Mode SS | |||
|---|---|---|---|
| Quadrant | BADHDUFLAG | Total packets | Discarded packets |
| A | 0 | 28 | 2 |
| B | 0 | 28 | 2 |
| C | 0 | 28 | 2 |
| D | 0 | 28 | 2 |
| Quadrant | Total seconds | Saturated seconds | Saturation percentage |
|---|---|---|---|
| A | 1273 | 8 | 0.628437% |
| B | 1272 | 7 | 0.550314% |
| C | 1263 | 3 | 0.237530% |
| D | 1259 | 20 | 1.588562% |
Noise dominated data is calculated using 1-second bins in cleaned event files. If a bin has >2000 counts, and if more than 50% of those come from <1% of pixels, then it is considered to be noise-dominated and hence unusable.
| Quadrant | # 1 sec bins | Bins with >0 counts | Bins with >2000 counts | High rate bins dominated by noise | Noise dominated (total time) | Noise dominated (detector-on time) | Marked lightcurve |
|---|---|---|---|---|---|---|---|
| A | 2517 | 1291 | 0 | 0 | 0.00% | 0.00% | 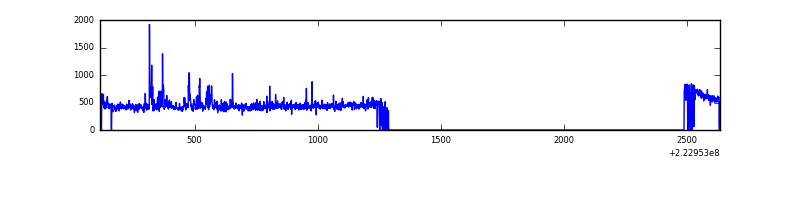 |
| B | 2513 | 1297 | 0 | 0 | 0.00% | 0.00% | 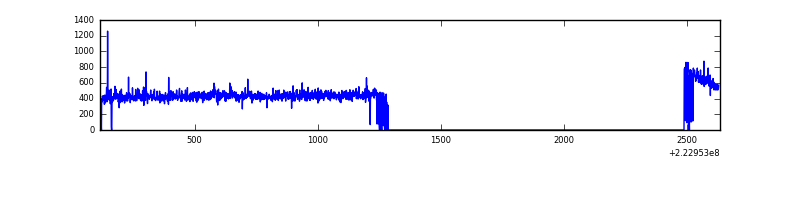 |
| C | 2513 | 1290 | 2 | 2 | 0.08% | 0.16% | 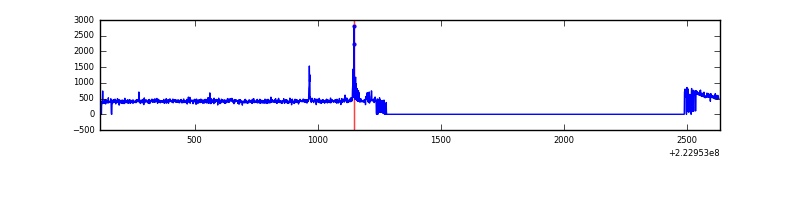 |
| D | 2512 | 1281 | 7 | 7 | 0.28% | 0.55% | 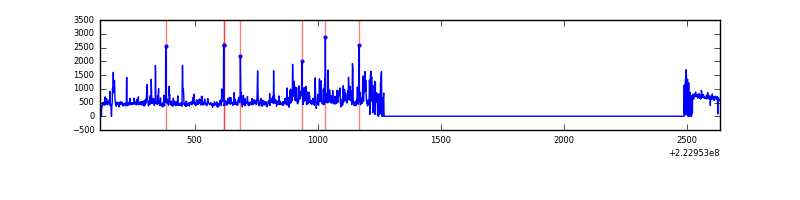 |
Top three noisy pixels from each quadrant. If the there are fewer than three noisy pixels in the level2.evt file, extra rows are filled as -1
| Pixel properties | Quadrant properties | ||||||
|---|---|---|---|---|---|---|---|
| Quadrant | DetID | PixID | Counts | Sigma | Mean | Median | Sigma |
| A | 14 | 238 | 30421 | 949.13 | 144 | 141 | 31.9 |
| A | 8 | 15 | 9807 | 302.98 | 144 | 141 | 31.9 |
| A | 0 | 226 | 1387 | 39.06 | 144 | 141 | 31.9 |
| B | 12 | 111 | 3041 | 93.91 | 148 | 144 | 30.8 |
| B | 11 | 111 | 2377 | 72.38 | 148 | 144 | 30.8 |
| B | 0 | 219 | 2299 | 69.85 | 148 | 144 | 30.8 |
| C | 4 | 254 | 18860 | 544.21 | 141 | 141 | 34.4 |
| C | 13 | 61 | 1136 | 28.93 | 141 | 141 | 34.4 |
| C | 14 | 67 | 824 | 19.86 | 141 | 141 | 34.4 |
| D | 2 | 216 | 132945 | 3706.36 | 137 | 132 | 35.8 |
| D | 12 | 221 | 55187 | 1536.4 | 137 | 132 | 35.8 |
| D | 8 | 195 | 43082 | 1198.59 | 137 | 132 | 35.8 |
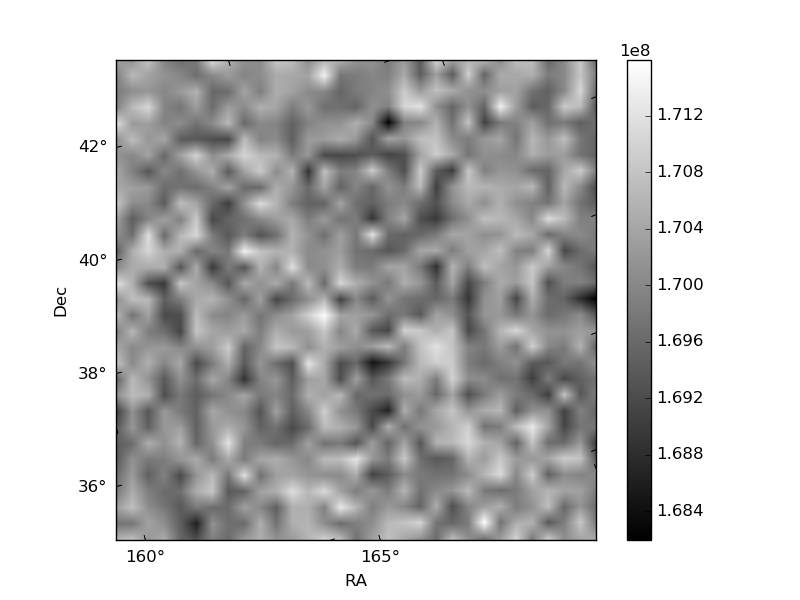
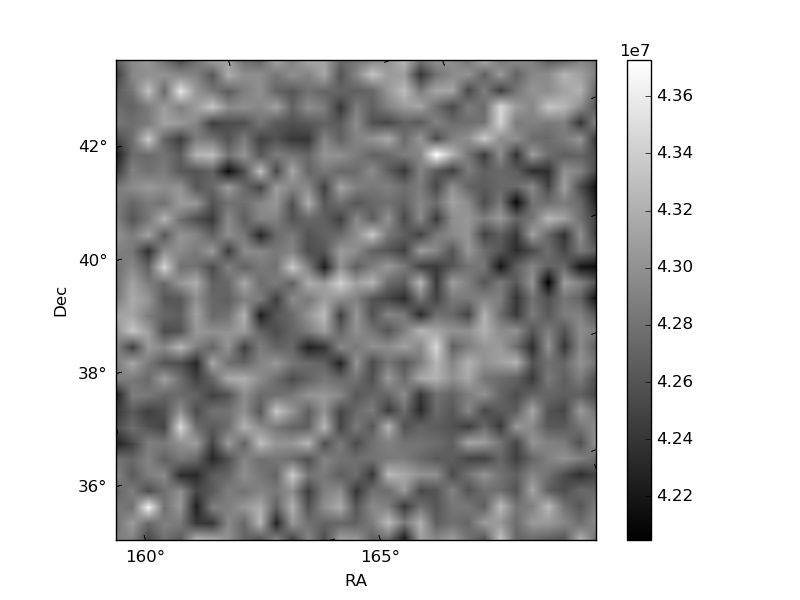
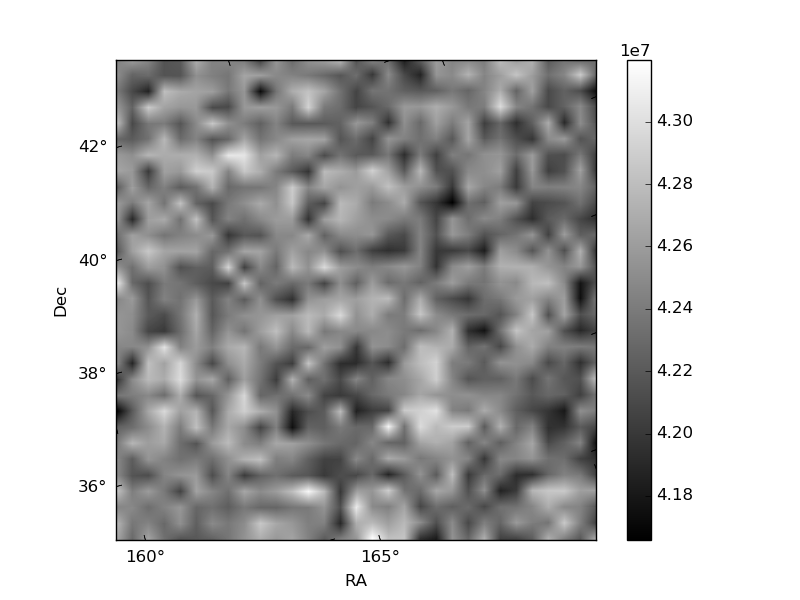
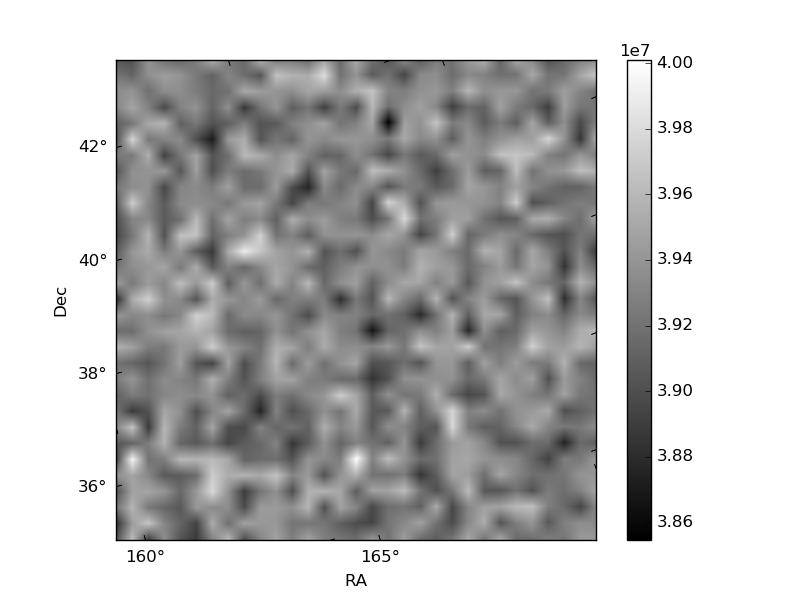
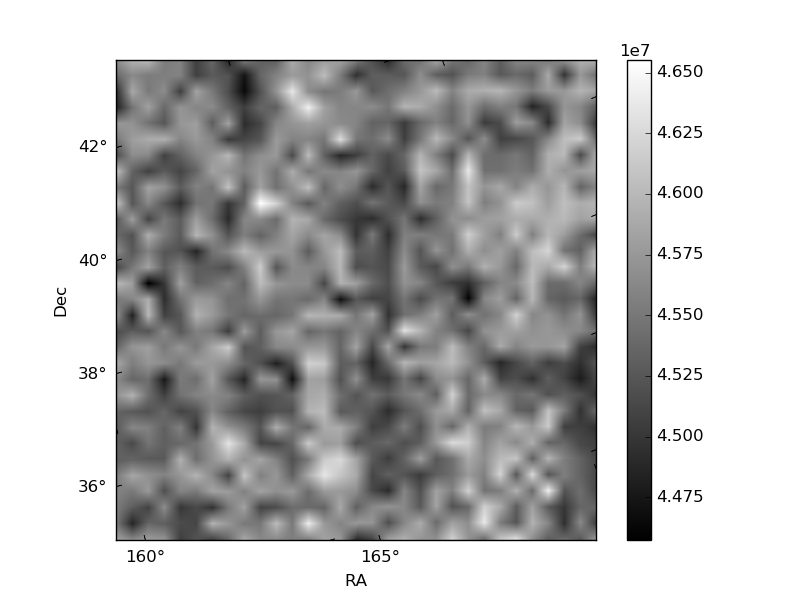
Histogram calculated using DETX and DETY for each event in the final _common_clean file
| Quadrant A | 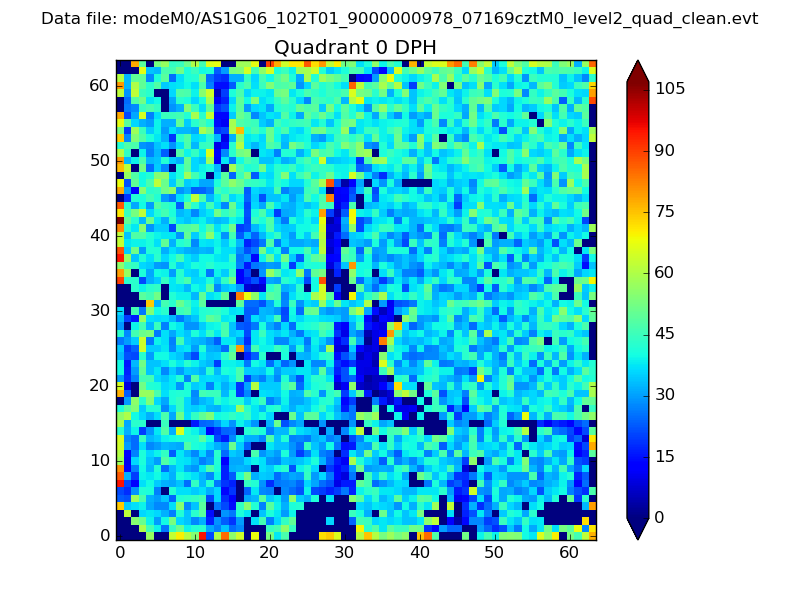 |
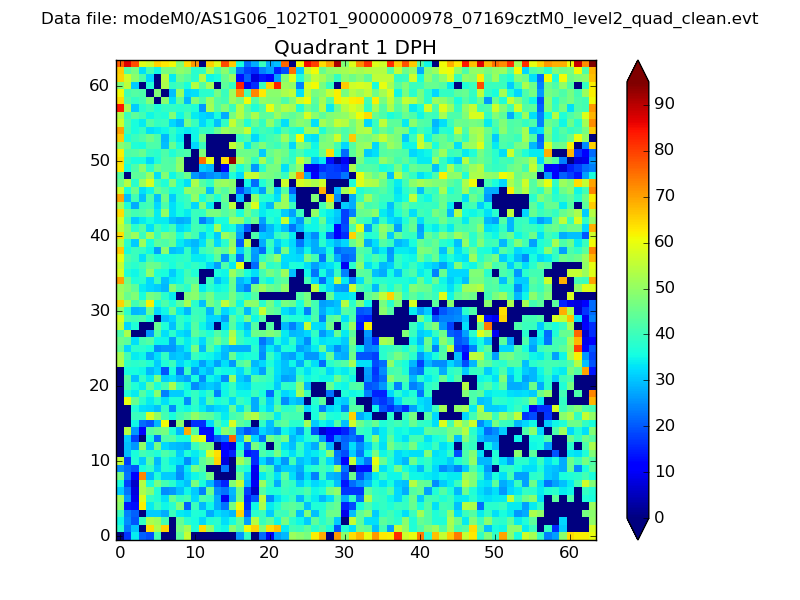 |
Quadrant B |
|---|---|---|---|
| Quadrant D | 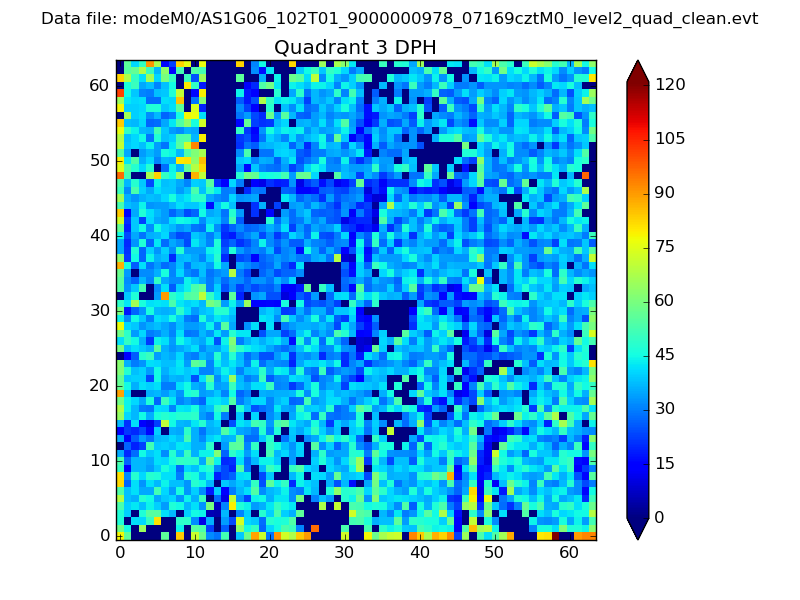 |
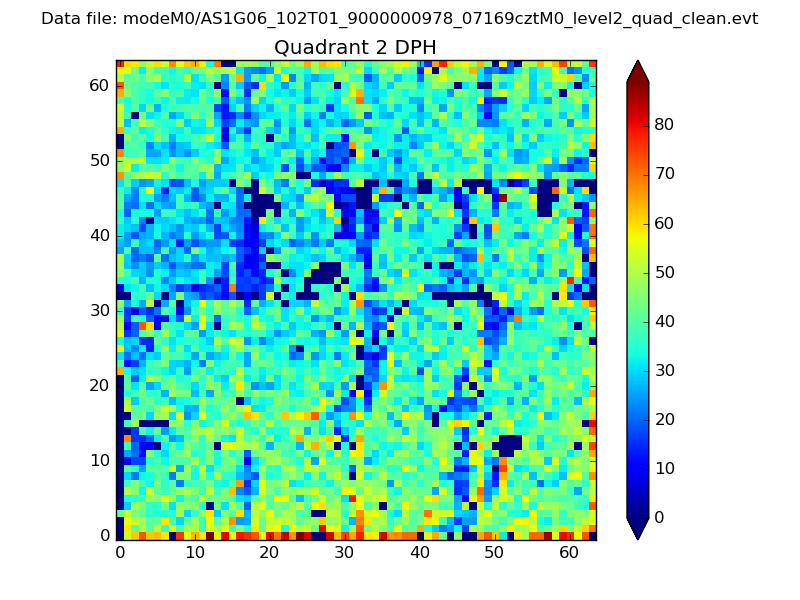 |
Quadrant C |
| Plot type | Count rate plots | Images |
|---|---|---|
| Comparison with Poisson distribution Blue bars denote a histogram of data divided into 1 sec bins. Red curve is a Poisson curve with rate = median count rate of data. |
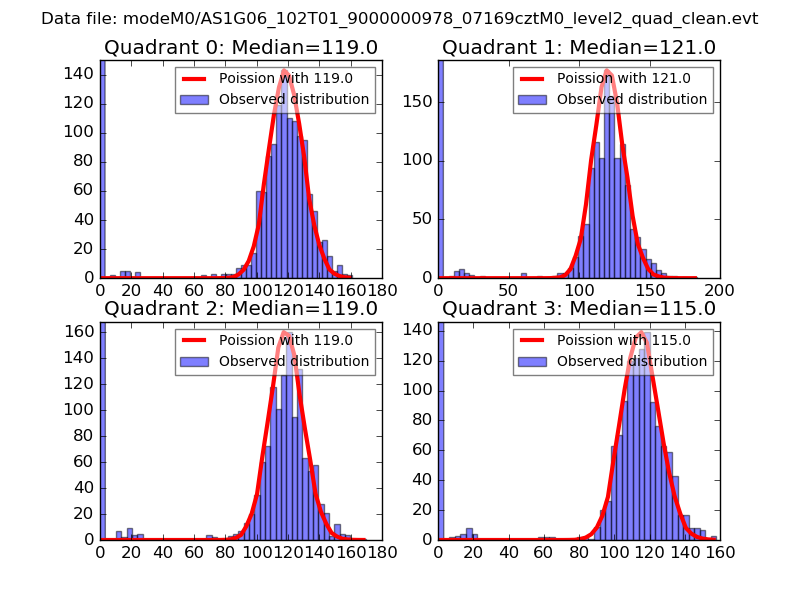 |
 |
| Quadrant-wise count rates Data is divided into 100 sec bins |
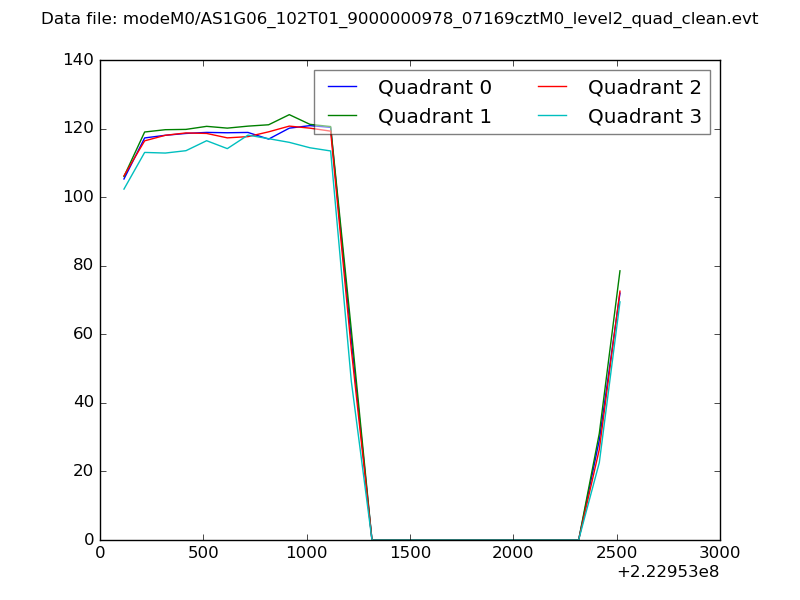 |
|
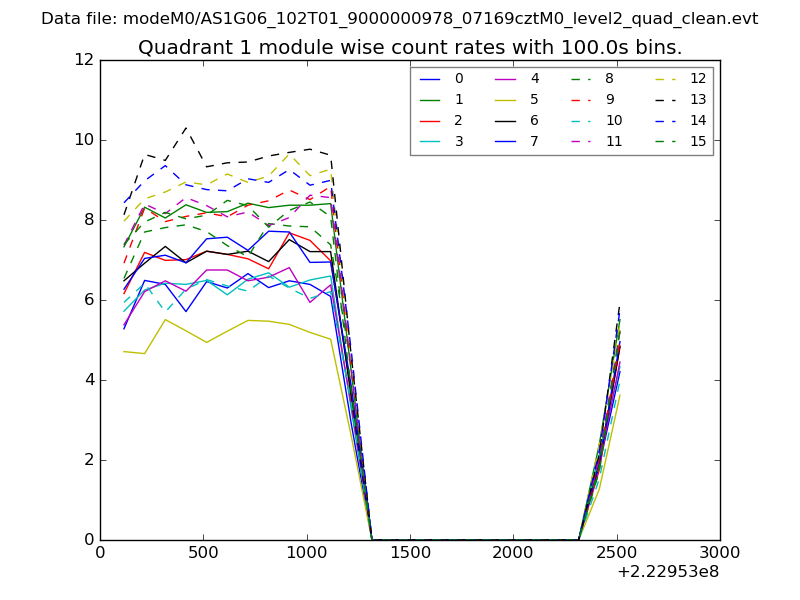
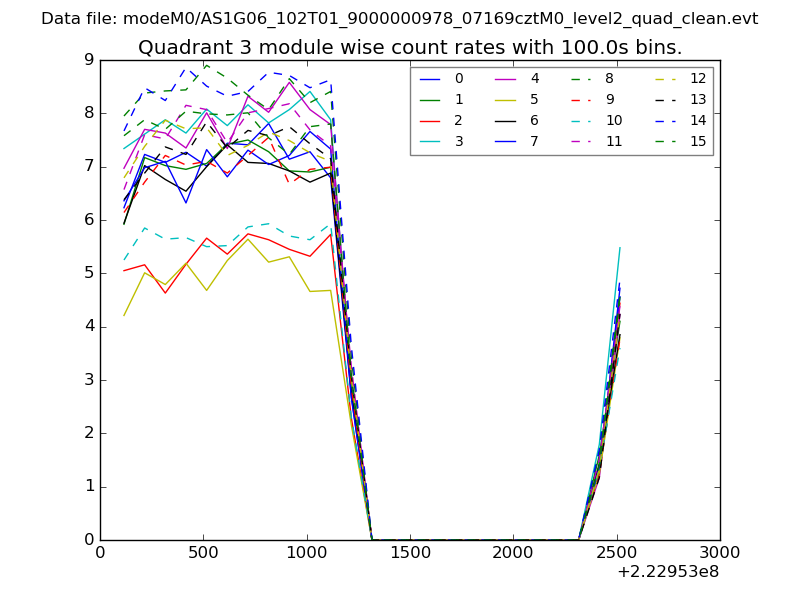
| Module-wise count rates for Quadrant A Data is divided into 100 sec bins |
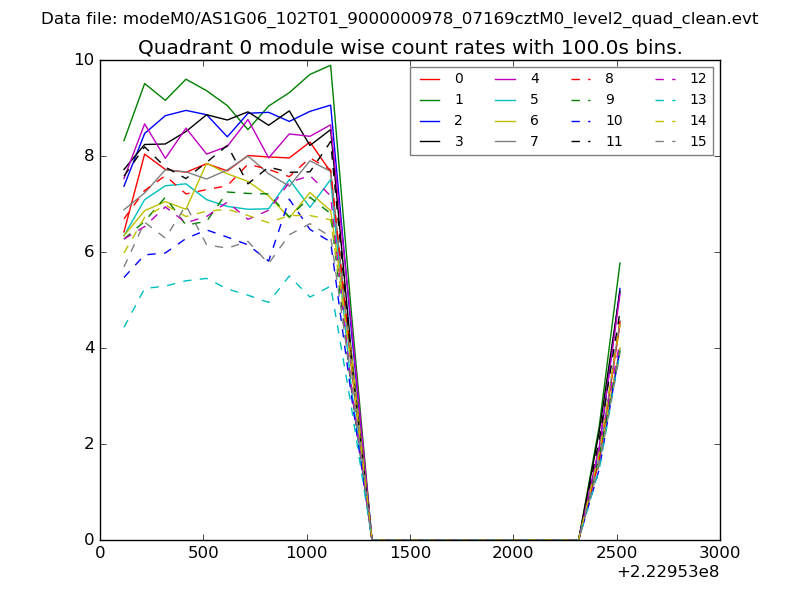 |
 |
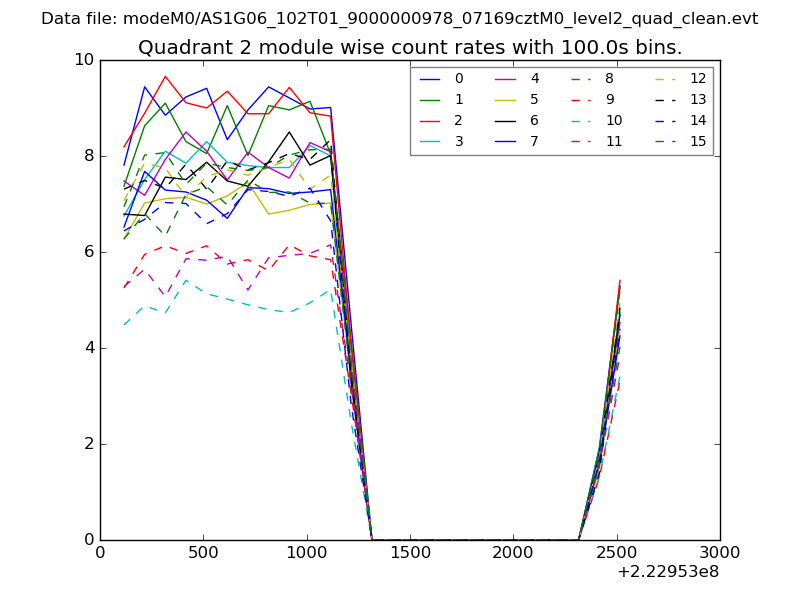
| Module-wise count rates for Quadrant B Data is divided into 100 sec bins |
 |
 |
| Module-wise count rates for Quadrant C Data is divided into 100 sec bins |
 |
 |
| Module-wise count rates for Quadrant D Data is divided into 100 sec bins |
 |
 |
| Parameter | Plot |
|---|---|
| CZT HV Monitor | 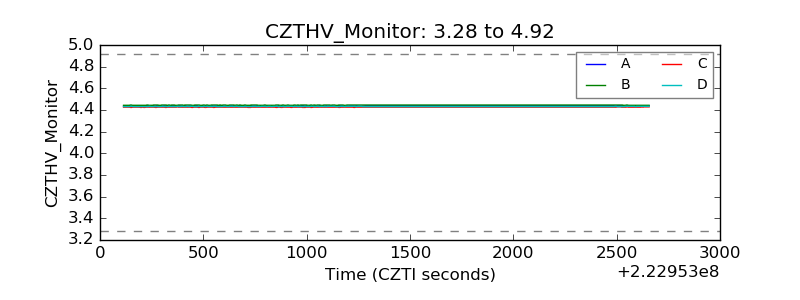 |
| D_VDD | 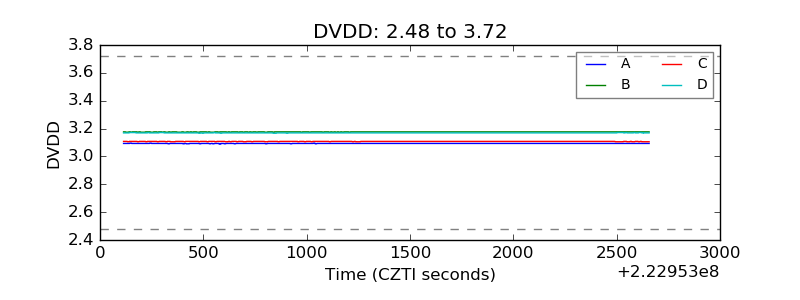 |
| Temperature 1 | 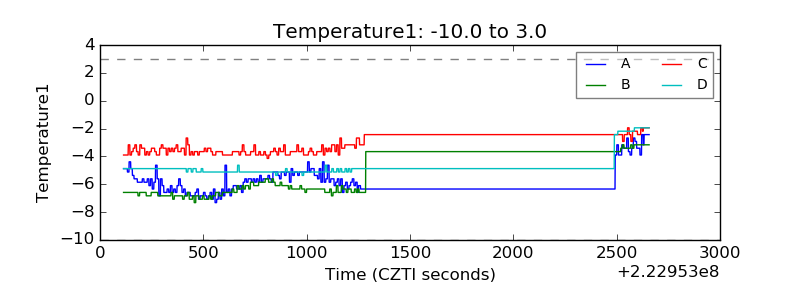 |
| Veto HV Monitor | 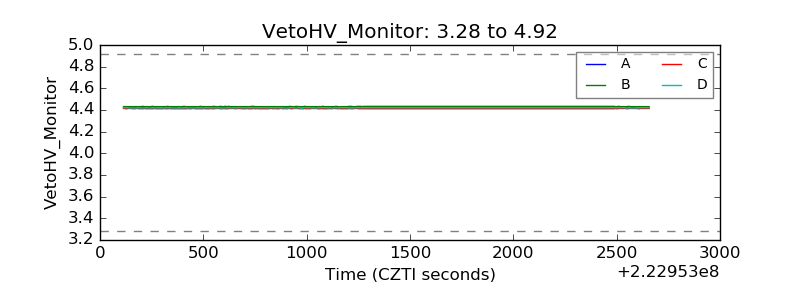 |
| Veto LLD | 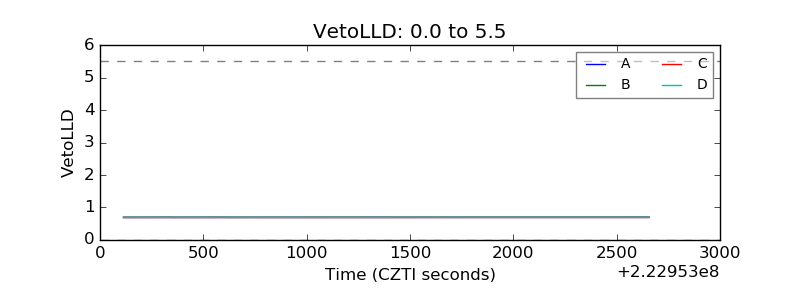 |
| Alpha Counter | 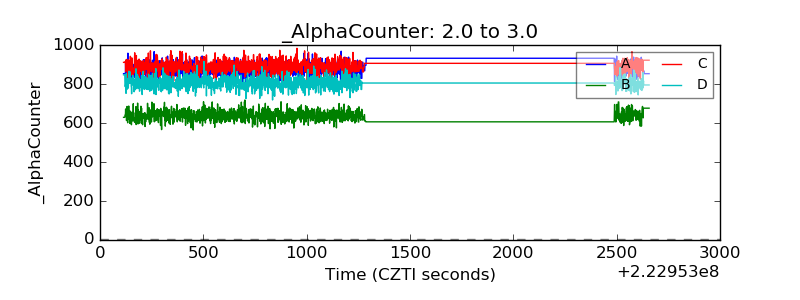 |
| _CPM_Rate | 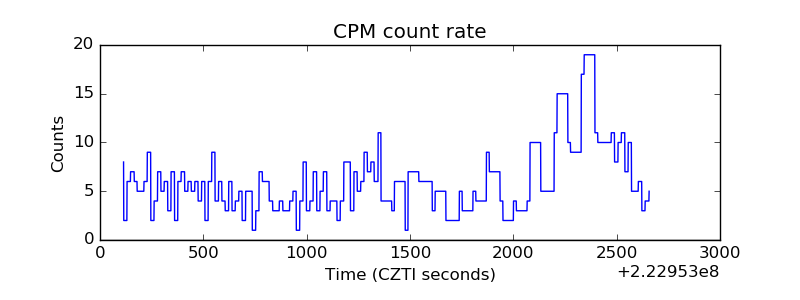 |
| CZT Counter | 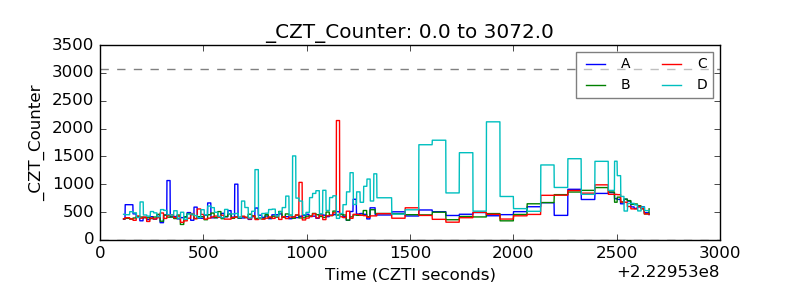 |
| +2.5 Volts monitor | 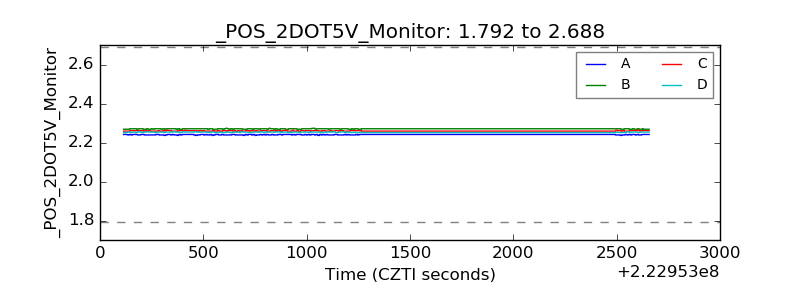 |
| +5 Volts monitor | 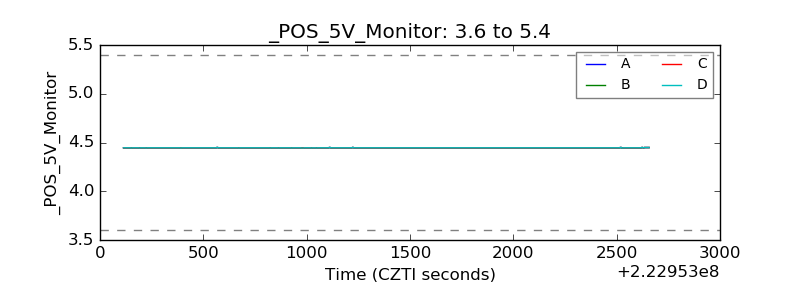 |
| _ROLL_ROT | 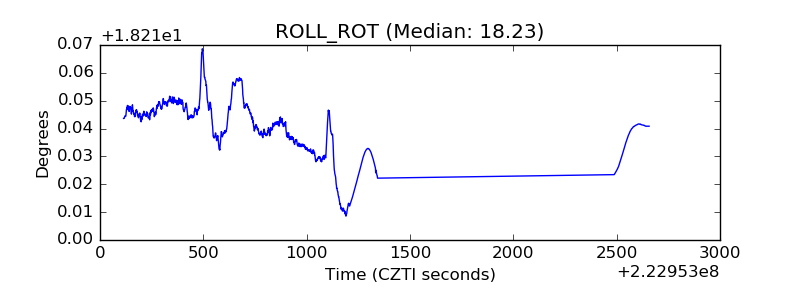 |
| _Roll_DEC | 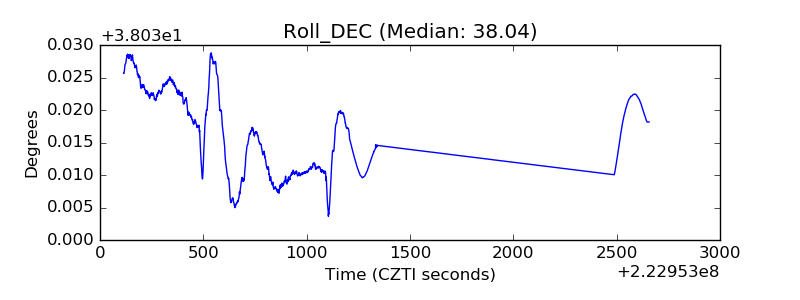 |
| _Roll_RA | 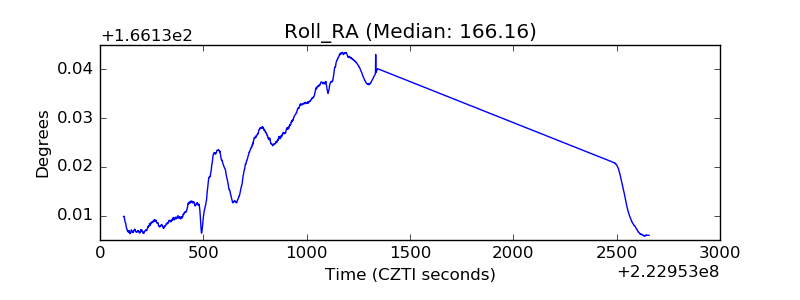 |
| Veto Counter | 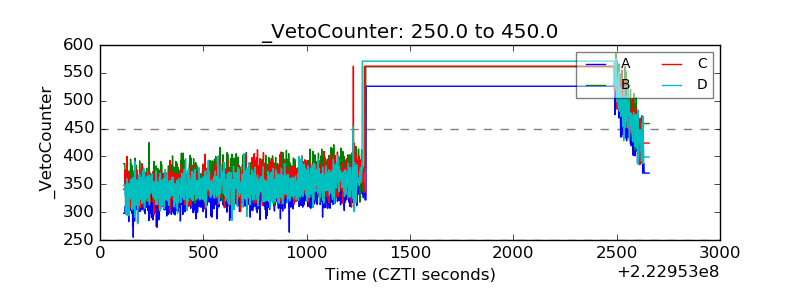 |