| Param | Original file | Final file |
|---|---|---|
| Filename | modeM0/AS1G06_102T01_9000000978_07170cztM0_level2.evt | modeM0/AS1G06_102T01_9000000978_07170cztM0_level2_quad_clean.evt |
| Size (bytes) | 170,029,440 | 16,274,880 |
| Size | 162.2 MB | 15.5 MB |
| Events in quadrant A | 1,085,838 | 81,274 |
| Events in quadrant B | 1,457,220 | 82,389 |
| Events in quadrant C | 1,236,012 | 81,731 |
| Events in quadrant D | 1,208,622 | 77,519 |
| Mode M0 | |||
|---|---|---|---|
| Quadrant | BADHDUFLAG | Total packets | Discarded packets |
| A | 0 | 5239 | 368 |
| B | 0 | 6175 | 337 |
| C | 0 | 5607 | 346 |
| D | 0 | 5411 | 330 |
| Mode SS | |||
|---|---|---|---|
| Quadrant | BADHDUFLAG | Total packets | Discarded packets |
| A | 0 | 49 | 1 |
| B | 0 | 50 | 4 |
| C | 0 | 50 | 4 |
| D | 0 | 50 | 2 |
| Quadrant | Total seconds | Saturated seconds | Saturation percentage |
|---|---|---|---|
| A | 2346 | 20 | 0.852515% |
| B | 2343 | 24 | 1.024328% |
| C | 2347 | 27 | 1.150405% |
| D | 2346 | 31 | 1.321398% |
Noise dominated data is calculated using 1-second bins in cleaned event files. If a bin has >2000 counts, and if more than 50% of those come from <1% of pixels, then it is considered to be noise-dominated and hence unusable.
| Quadrant | # 1 sec bins | Bins with >0 counts | Bins with >2000 counts | High rate bins dominated by noise | Noise dominated (total time) | Noise dominated (detector-on time) | Marked lightcurve |
|---|---|---|---|---|---|---|---|
| A | 2412 | 2367 | 18 | 18 | 0.75% | 0.76% |  |
| B | 2408 | 2365 | 12 | 12 | 0.50% | 0.51% |  |
| C | 2405 | 2366 | 27 | 27 | 1.12% | 1.14% |  |
| D | 2414 | 2368 | 29 | 29 | 1.20% | 1.22% |  |
Top three noisy pixels from each quadrant. If the there are fewer than three noisy pixels in the level2.evt file, extra rows are filled as -1
| Pixel properties | Quadrant properties | ||||||
|---|---|---|---|---|---|---|---|
| Quadrant | DetID | PixID | Counts | Sigma | Mean | Median | Sigma |
| A | 14 | 238 | 62357 | 1115.92 | 261 | 256 | 55.6 |
| A | 8 | 15 | 16404 | 290.17 | 261 | 256 | 55.6 |
| A | 0 | 226 | 2557 | 41.35 | 261 | 256 | 55.6 |
| B | 10 | 252 | 92254 | 1790.46 | 262 | 256 | 51.4 |
| B | 0 | 219 | 86380 | 1676.14 | 262 | 256 | 51.4 |
| B | 0 | 228 | 71402 | 1384.64 | 262 | 256 | 51.4 |
| C | 4 | 254 | 233967 | 3867.55 | 252 | 253 | 60.4 |
| C | 9 | 68 | 17115 | 279.04 | 252 | 253 | 60.4 |
| C | 13 | 61 | 1974 | 28.48 | 252 | 253 | 60.4 |
| D | 8 | 195 | 107907 | 1689.21 | 254 | 246 | 63.7 |
| D | 14 | 34 | 76143 | 1190.83 | 254 | 246 | 63.7 |
| D | 7 | 55 | 24578 | 381.77 | 254 | 246 | 63.7 |
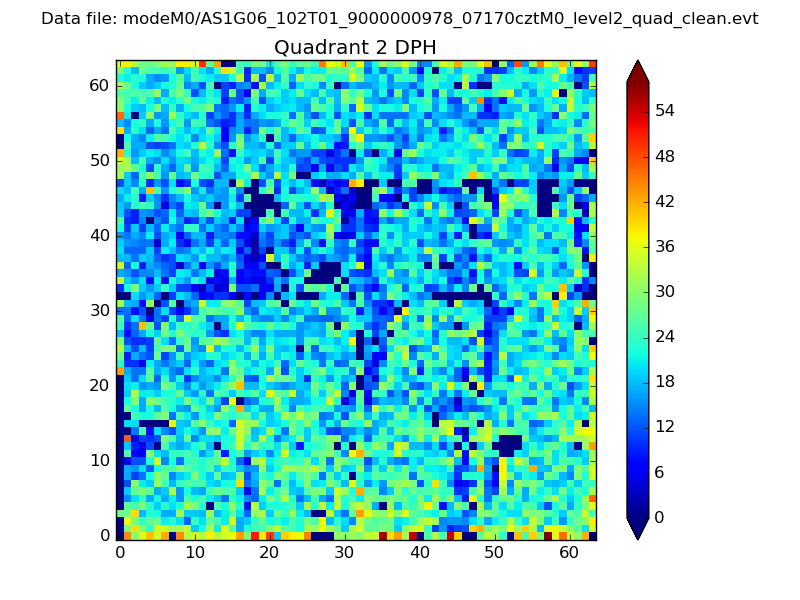
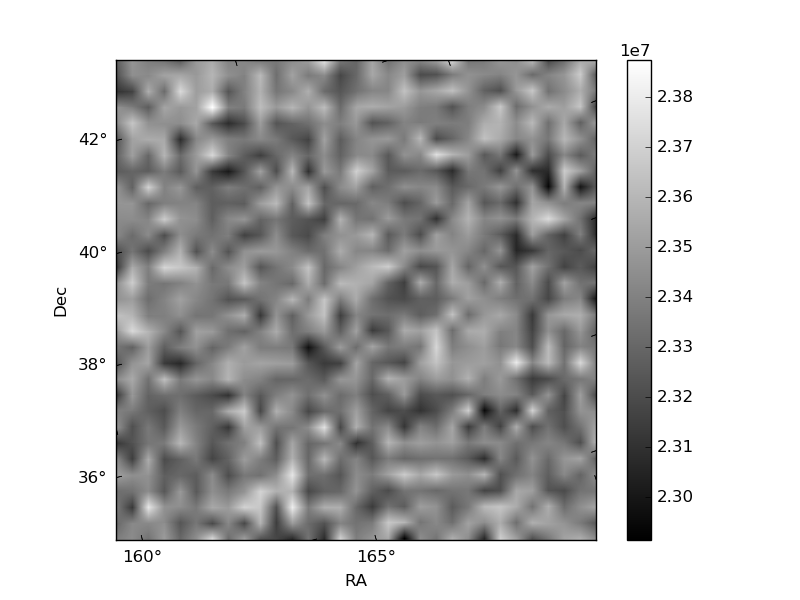
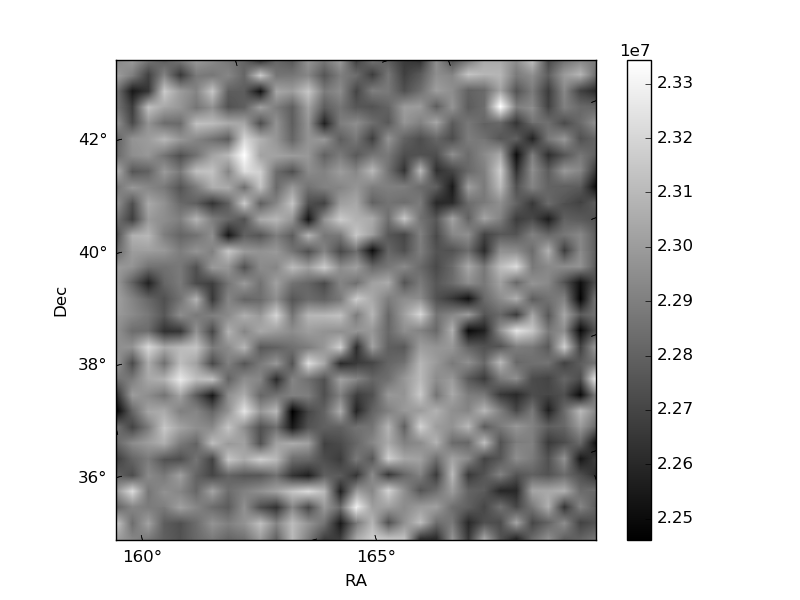
Histogram calculated using DETX and DETY for each event in the final _common_clean file
| Quadrant A | 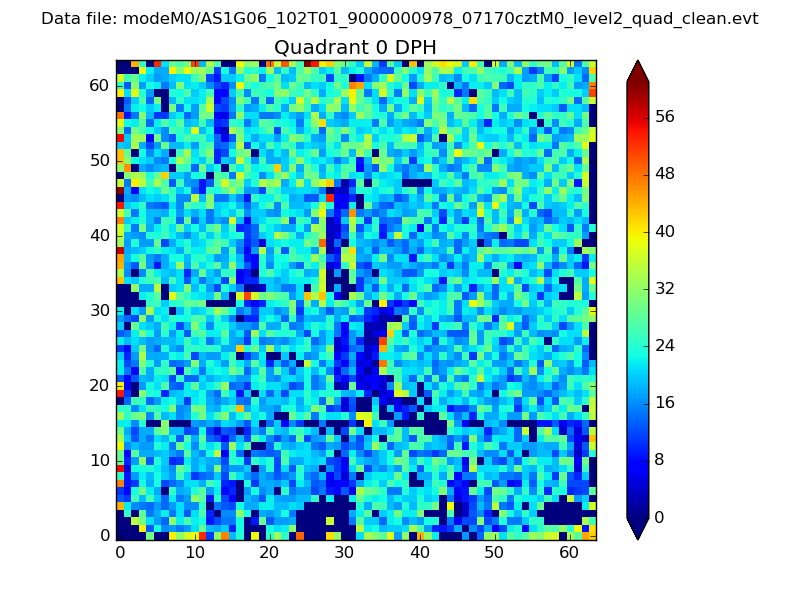 |
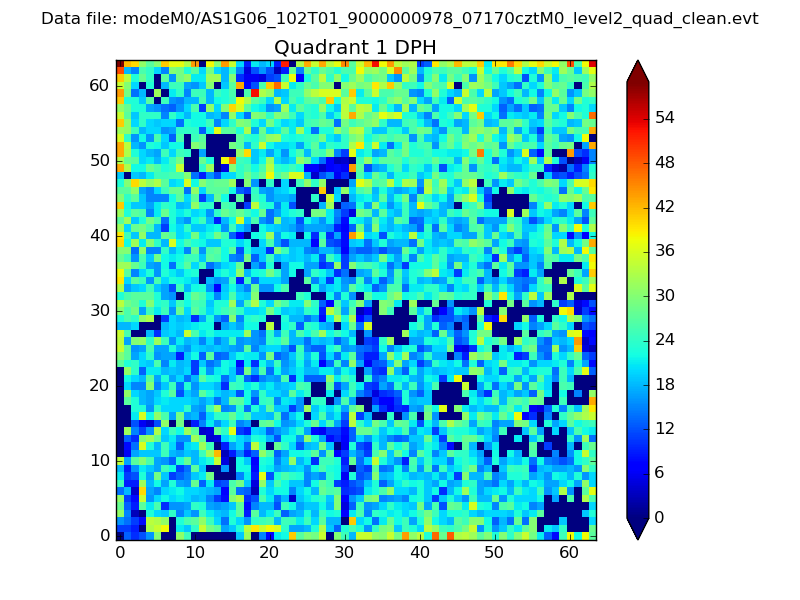 |
Quadrant B |
|---|---|---|---|
| Quadrant D | 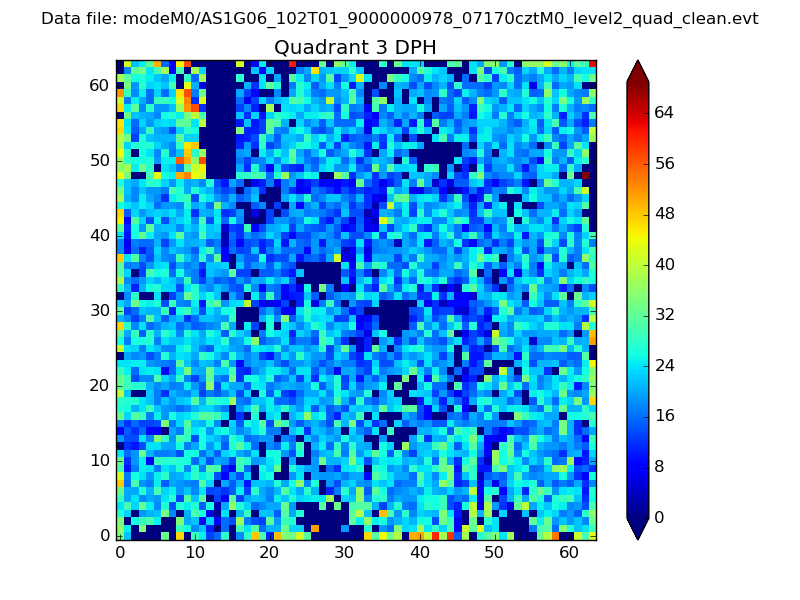 |
 |
Quadrant C |
| Plot type | Count rate plots | Images |
|---|---|---|
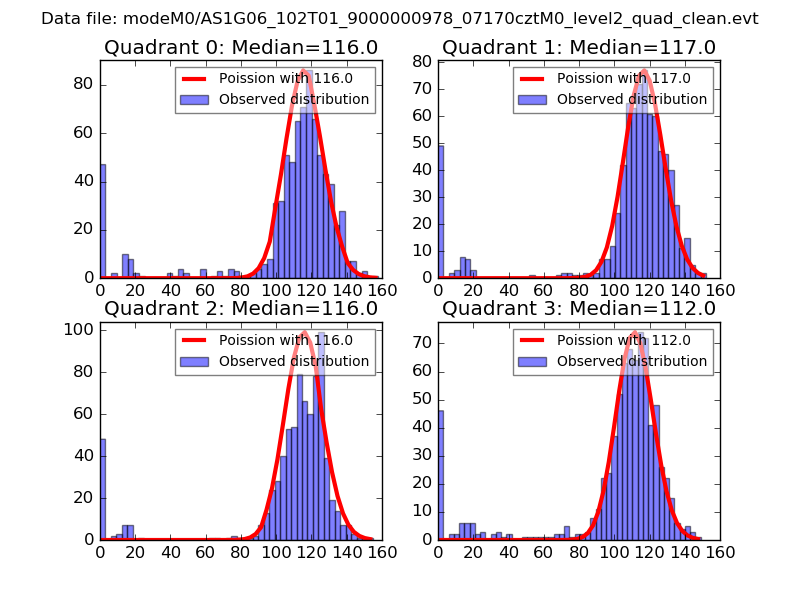
| Comparison with Poisson distribution Blue bars denote a histogram of data divided into 1 sec bins. Red curve is a Poisson curve with rate = median count rate of data. |
 |
 |
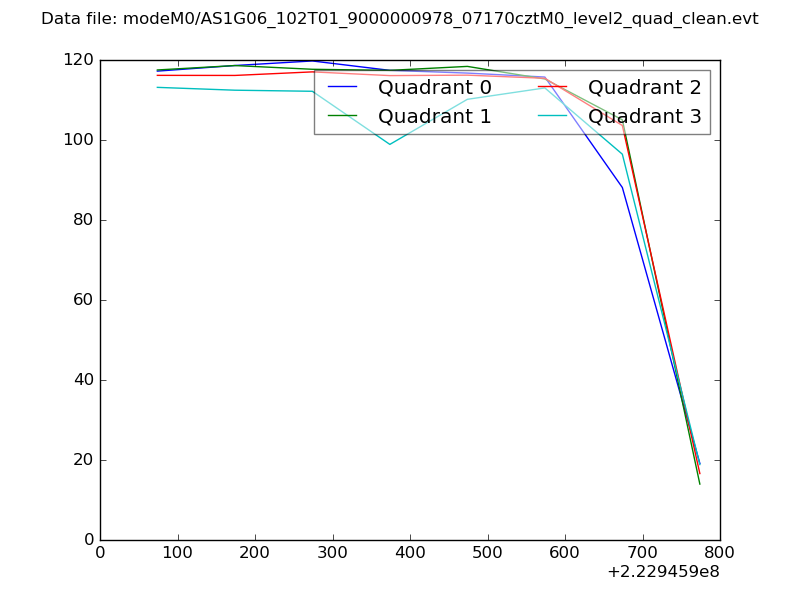
| Quadrant-wise count rates Data is divided into 100 sec bins |
 |
|
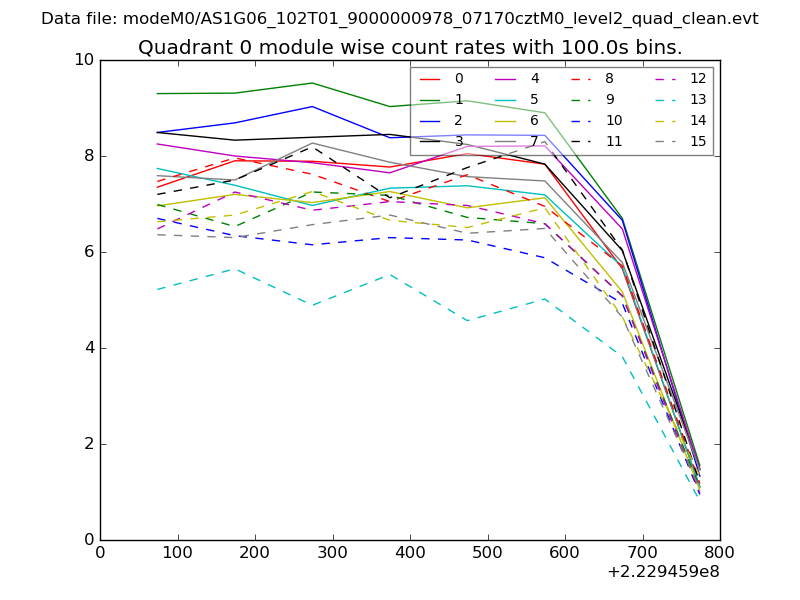
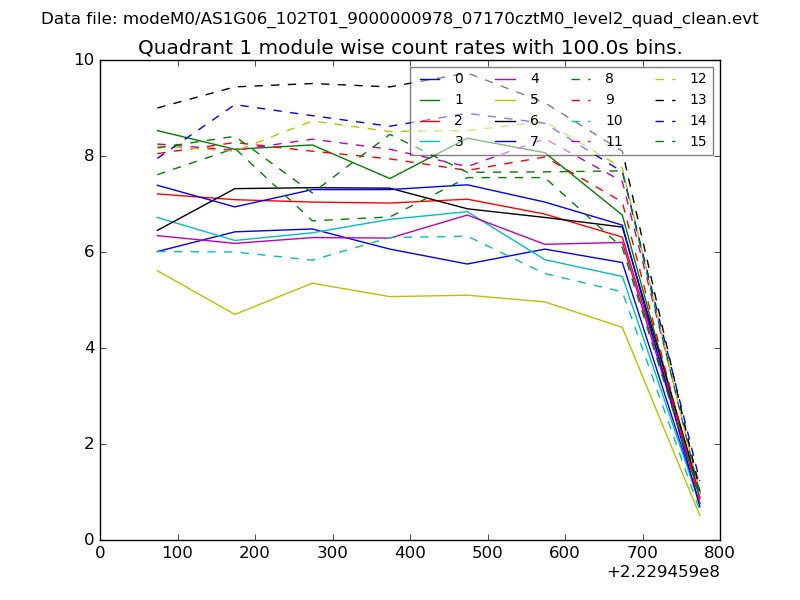
| Module-wise count rates for Quadrant A Data is divided into 100 sec bins |
 |
 |
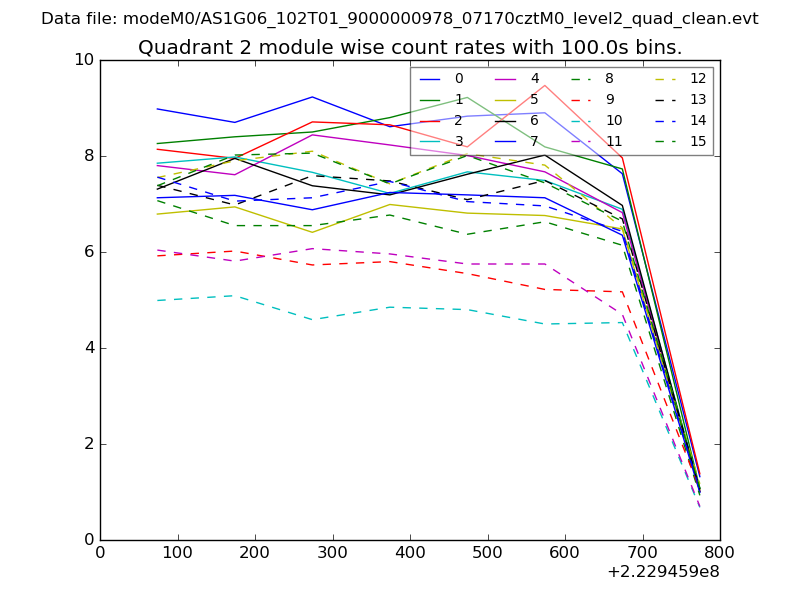
| Module-wise count rates for Quadrant B Data is divided into 100 sec bins |
 |
 |
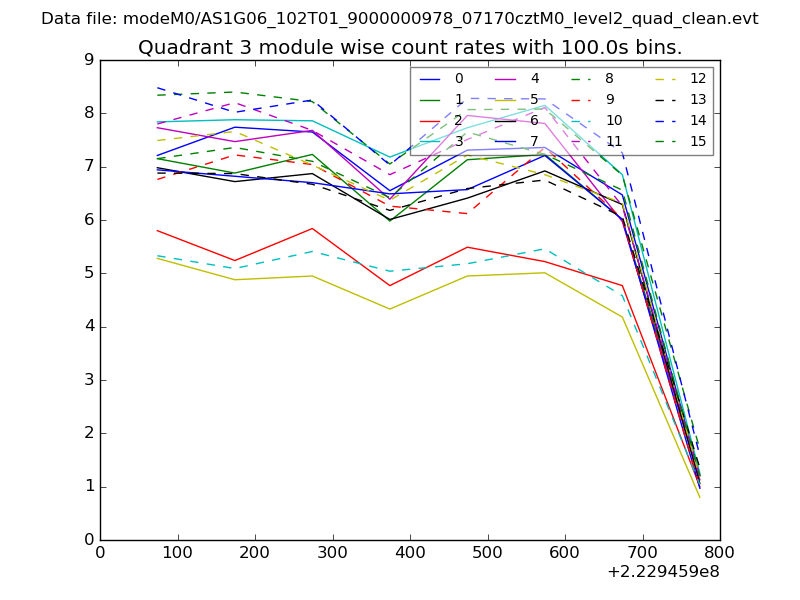
| Module-wise count rates for Quadrant C Data is divided into 100 sec bins |
 |
 |
| Module-wise count rates for Quadrant D Data is divided into 100 sec bins |
 |
 |
| Parameter | Plot |
|---|---|
| CZT HV Monitor | 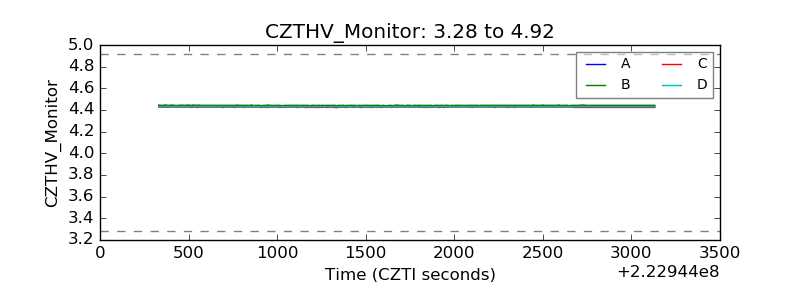 |
| D_VDD | 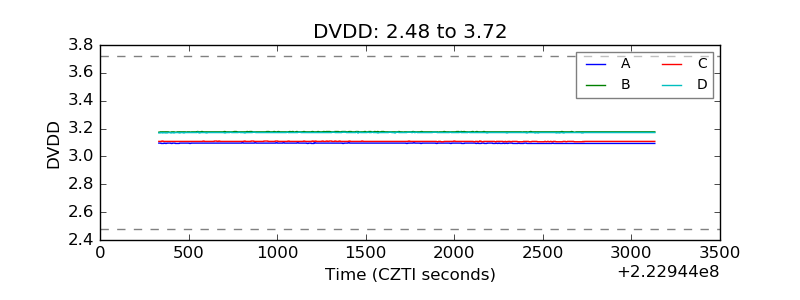 |
| Temperature 1 | 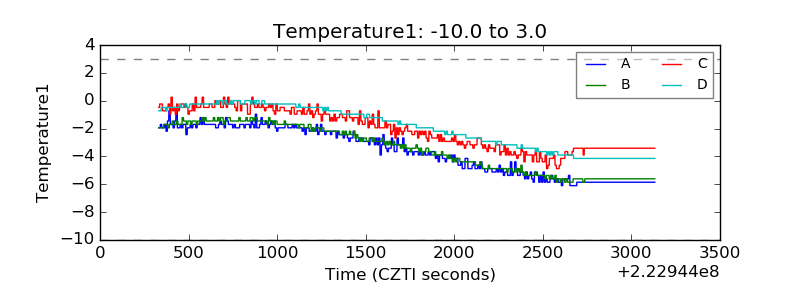 |
| Veto HV Monitor | 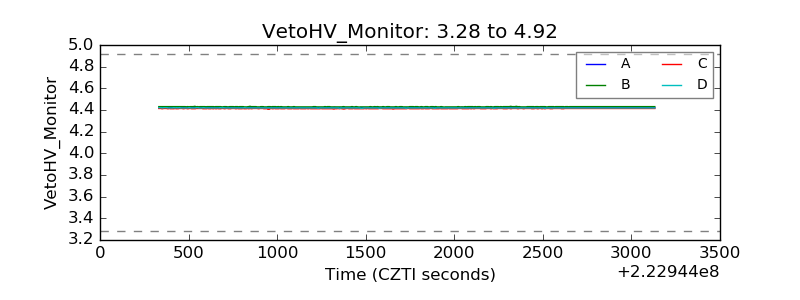 |
| Veto LLD | 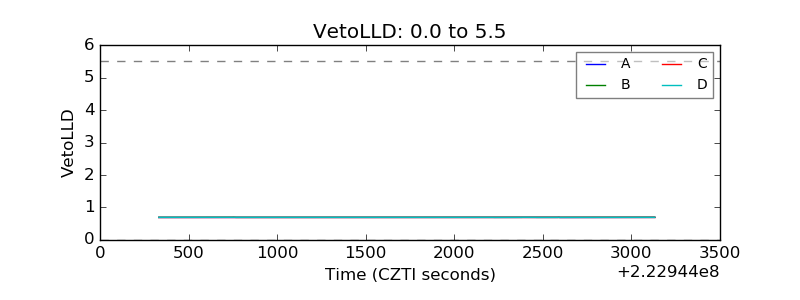 |
| Alpha Counter | 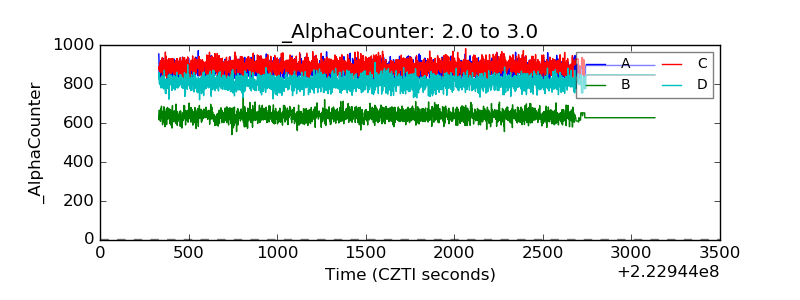 |
| _CPM_Rate | 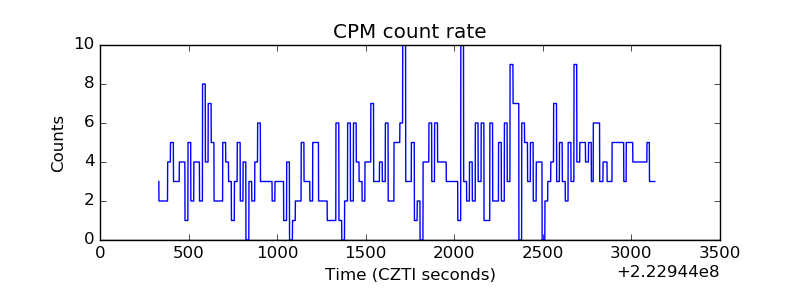 |
| CZT Counter | 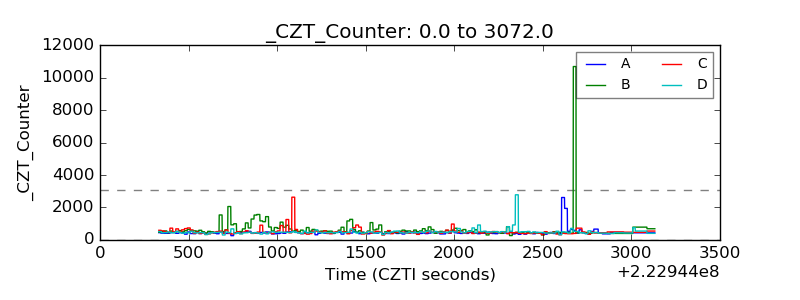 |
| +2.5 Volts monitor | 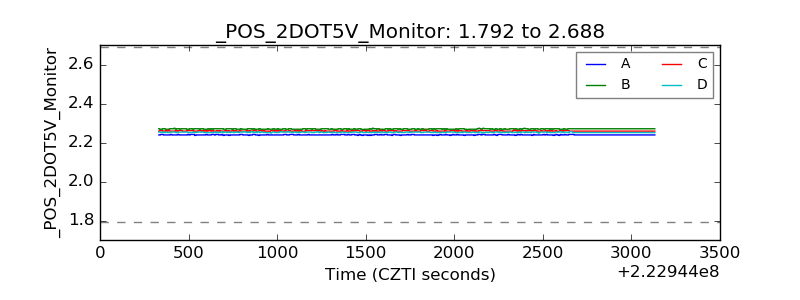 |
| +5 Volts monitor | 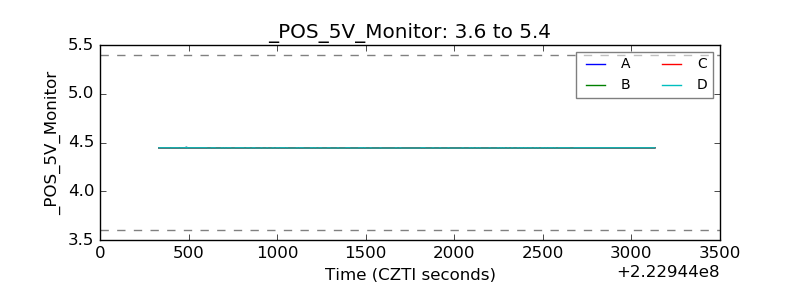 |
| _ROLL_ROT | 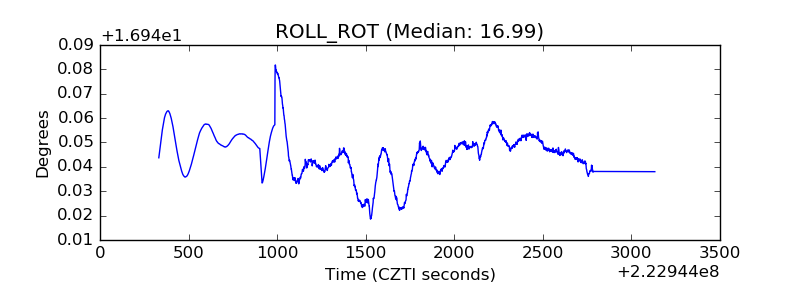 |
| _Roll_DEC | 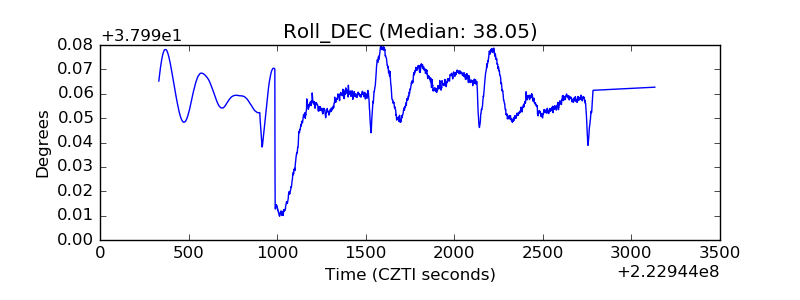 |
| _Roll_RA | 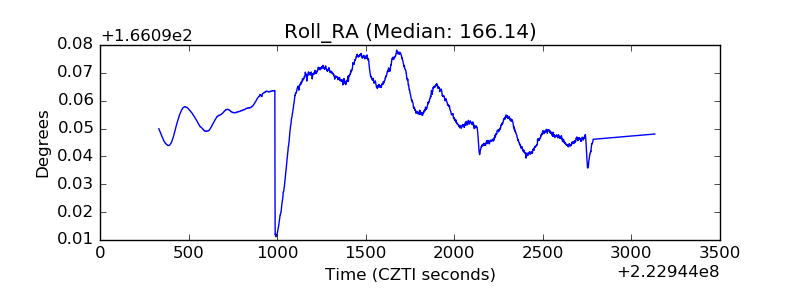 |
| Veto Counter | 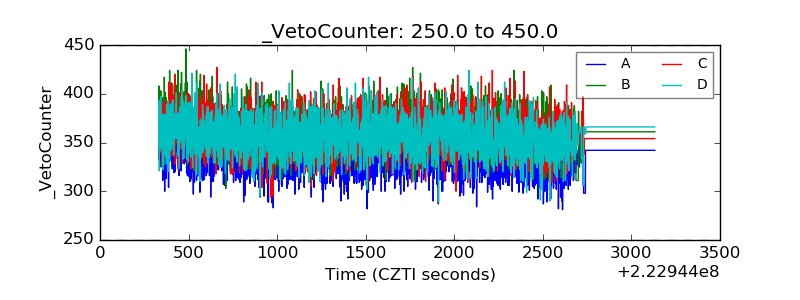 |