| Param | Original file | Final file |
|---|---|---|
| Filename | modeM0/AS1G06_102T01_9000000978_07172cztM0_level2.evt | modeM0/AS1G06_102T01_9000000978_07172cztM0_level2_quad_clean.evt |
| Size (bytes) | 482,238,720 | 66,435,840 |
| Size | 459.9 MB | 63.4 MB |
| Events in quadrant A | 2,416,856 | 422,394 |
| Events in quadrant B | 2,583,889 | 427,419 |
| Events in quadrant C | 2,633,645 | 421,903 |
| Events in quadrant D | 6,607,022 | 364,977 |
| Mode M0 | |||
|---|---|---|---|
| Quadrant | BADHDUFLAG | Total packets | Discarded packets |
| A | 0 | 10978 | 2 |
| B | 0 | 11426 | 1 |
| C | 0 | 11772 | 1 |
| D | 0 | 23459 | 1 |
| Mode SS | |||
|---|---|---|---|
| Quadrant | BADHDUFLAG | Total packets | Discarded packets |
| A | 0 | 108 | 0 |
| B | 0 | 108 | 0 |
| C | 0 | 108 | 0 |
| D | 0 | 108 | 0 |
| Mode M9 | |||
|---|---|---|---|
| Quadrant | BADHDUFLAG | Total packets | Discarded packets |
| A | 0 | 4 | 0 |
| B | 0 | 4 | 0 |
| C | 0 | 4 | 0 |
| D | 0 | 4 | 0 |
| Quadrant | Total seconds | Saturated seconds | Saturation percentage |
|---|---|---|---|
| A | 5352 | 29 | 0.541854% |
| B | 5352 | 23 | 0.429746% |
| C | 5352 | 124 | 2.316891% |
| D | 5352 | 1097 | 20.497010% |
Noise dominated data is calculated using 1-second bins in cleaned event files. If a bin has >2000 counts, and if more than 50% of those come from <1% of pixels, then it is considered to be noise-dominated and hence unusable.
| Quadrant | # 1 sec bins | Bins with >0 counts | Bins with >2000 counts | High rate bins dominated by noise | Noise dominated (total time) | Noise dominated (detector-on time) | Marked lightcurve |
|---|---|---|---|---|---|---|---|
| A | 5707 | 5352 | 1 | 1 | 0.02% | 0.02% | 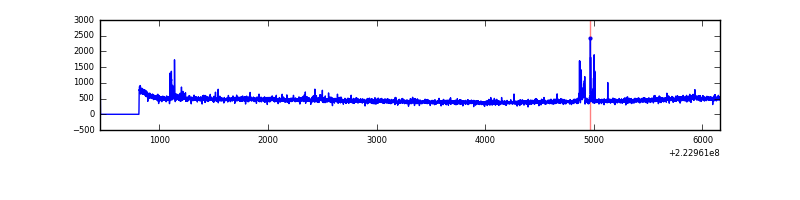 |
| B | 5707 | 5352 | 1 | 1 | 0.02% | 0.02% | 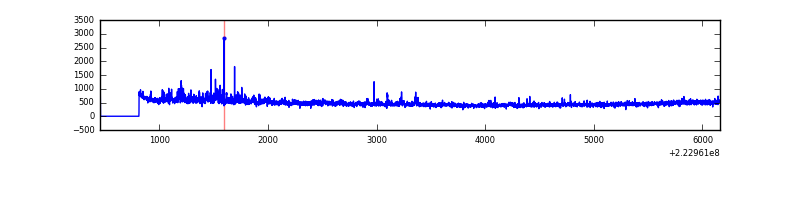 |
| C | 5707 | 5352 | 100 | 100 | 1.75% | 1.87% | 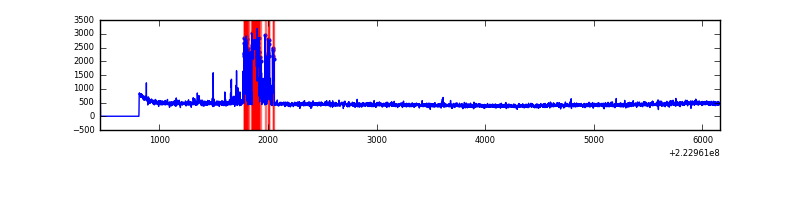 |
| D | 5707 | 5352 | 1096 | 1096 | 19.20% | 20.48% | 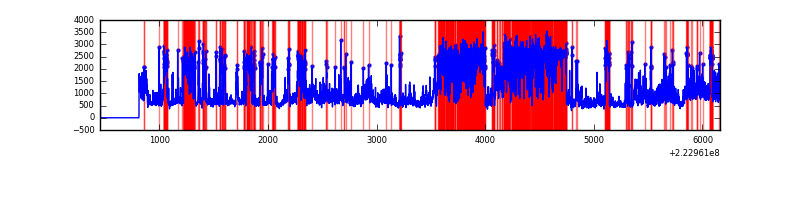 |
Top three noisy pixels from each quadrant. If the there are fewer than three noisy pixels in the level2.evt file, extra rows are filled as -1
| Pixel properties | Quadrant properties | ||||||
|---|---|---|---|---|---|---|---|
| Quadrant | DetID | PixID | Counts | Sigma | Mean | Median | Sigma |
| A | 13 | 248 | 35212 | 275.29 | 608 | 591 | 125.8 |
| A | 8 | 15 | 19734 | 152.22 | 608 | 591 | 125.8 |
| A | 14 | 111 | 18775 | 144.59 | 608 | 591 | 125.8 |
| B | 0 | 214 | 75860 | 627.4 | 614 | 597 | 120.0 |
| B | 15 | 204 | 64058 | 529.02 | 614 | 597 | 120.0 |
| B | 4 | 81 | 40476 | 332.43 | 614 | 597 | 120.0 |
| C | 8 | 208 | 344174 | 2532.29 | 584 | 584 | 135.7 |
| C | 10 | 22 | 6295 | 42.09 | 584 | 584 | 135.7 |
| C | 14 | 67 | 5190 | 33.94 | 584 | 584 | 135.7 |
| D | 12 | 221 | 3904914 | 28635.03 | 553 | 536 | 136.3 |
| D | 8 | 195 | 170812 | 1248.82 | 553 | 536 | 136.3 |
| D | 2 | 216 | 132780 | 969.89 | 553 | 536 | 136.3 |
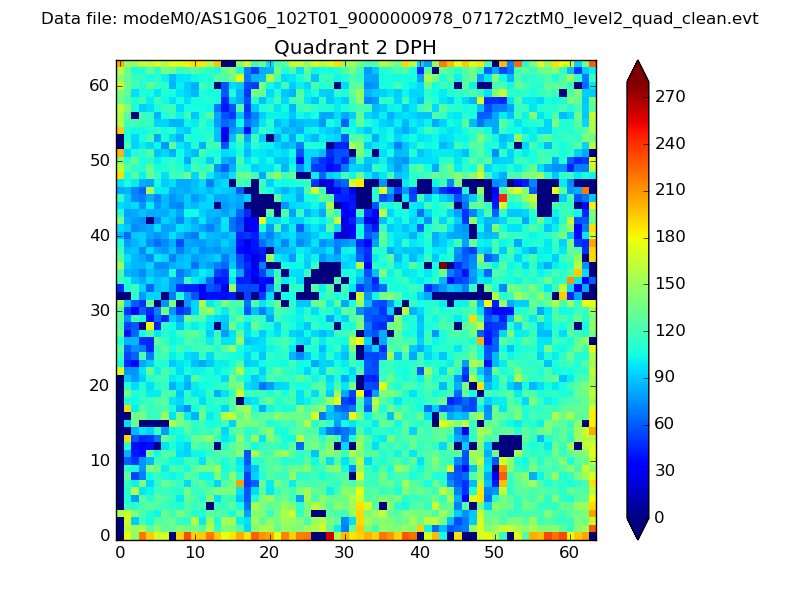
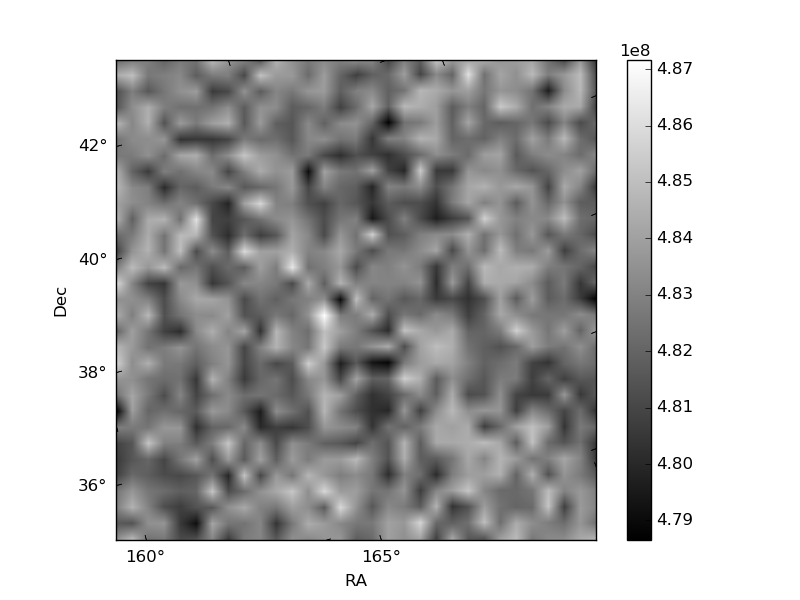
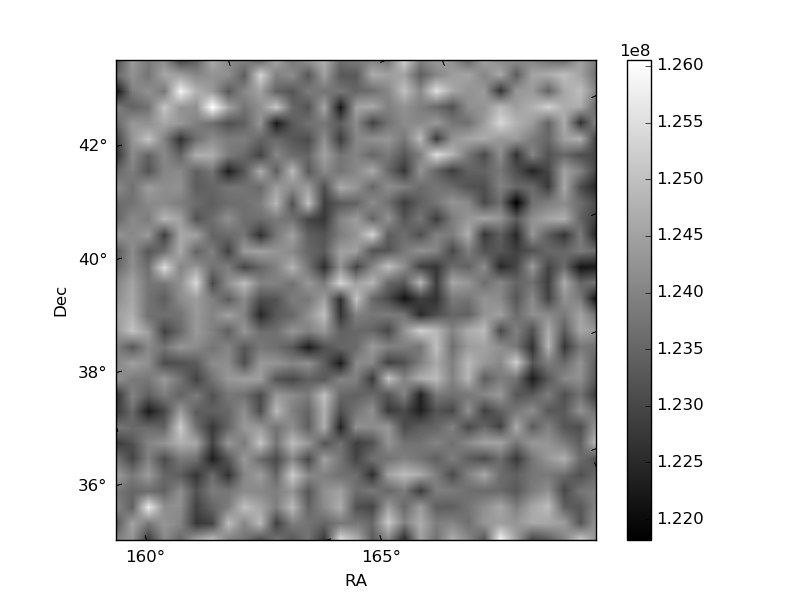
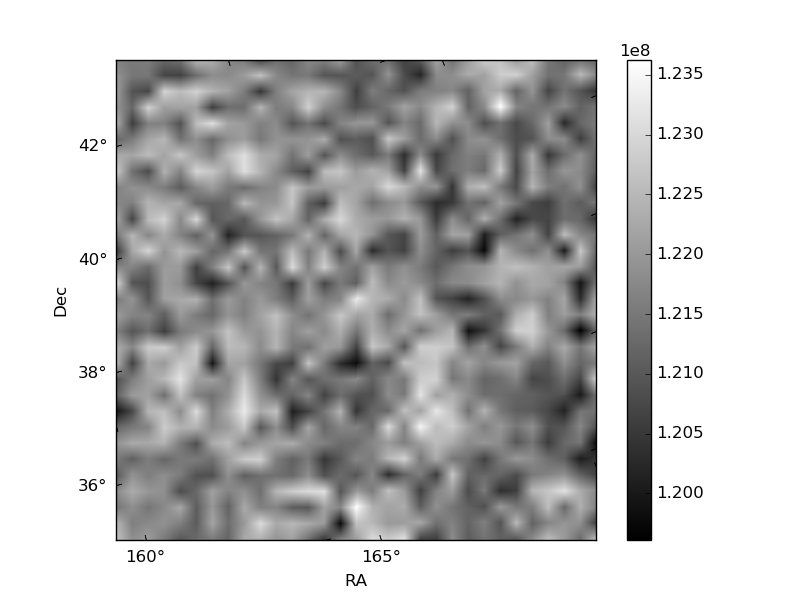
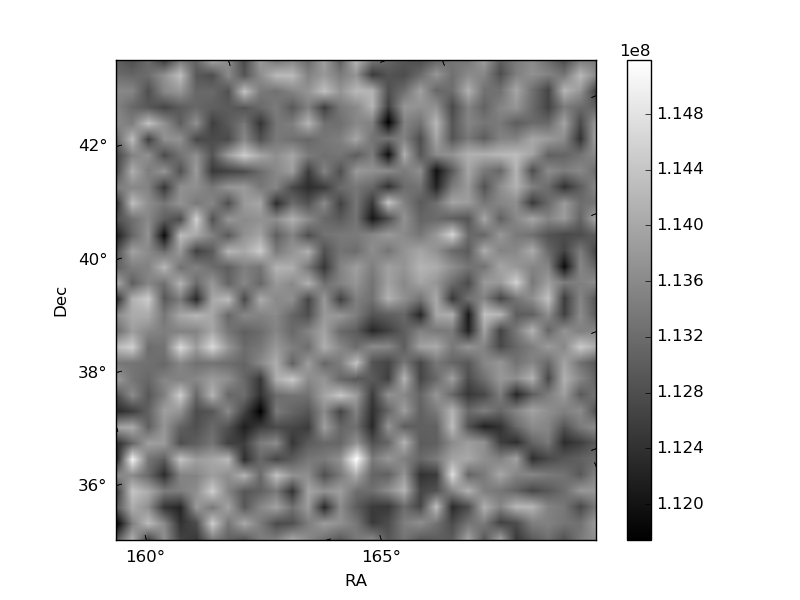
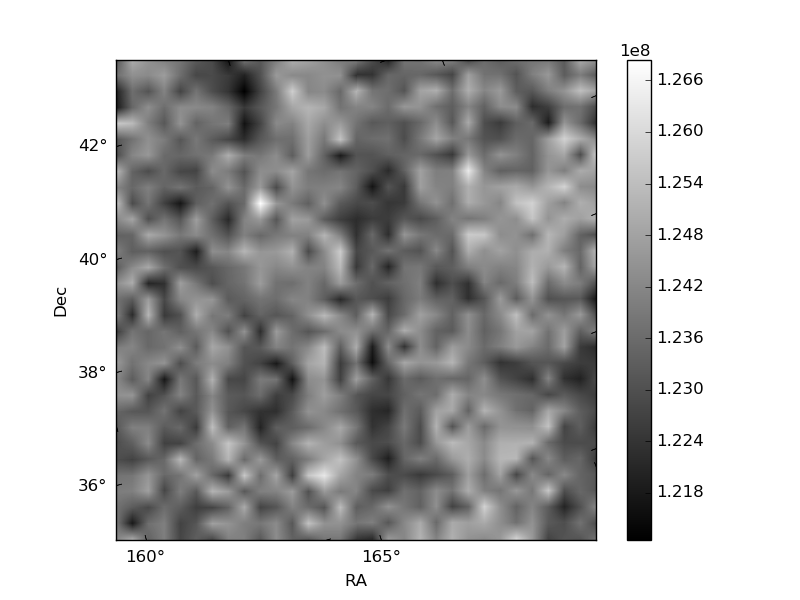
Histogram calculated using DETX and DETY for each event in the final _common_clean file
| Quadrant A | 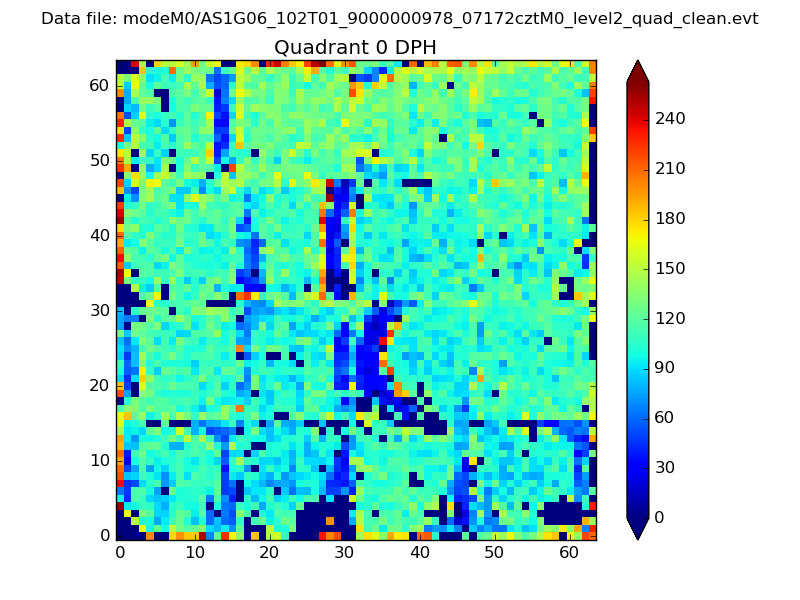 |
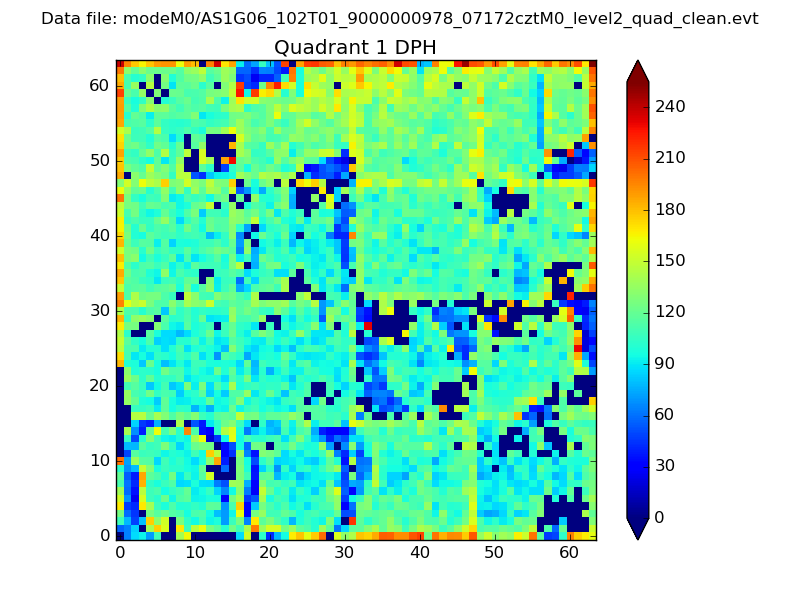 |
Quadrant B |
|---|---|---|---|
| Quadrant D | 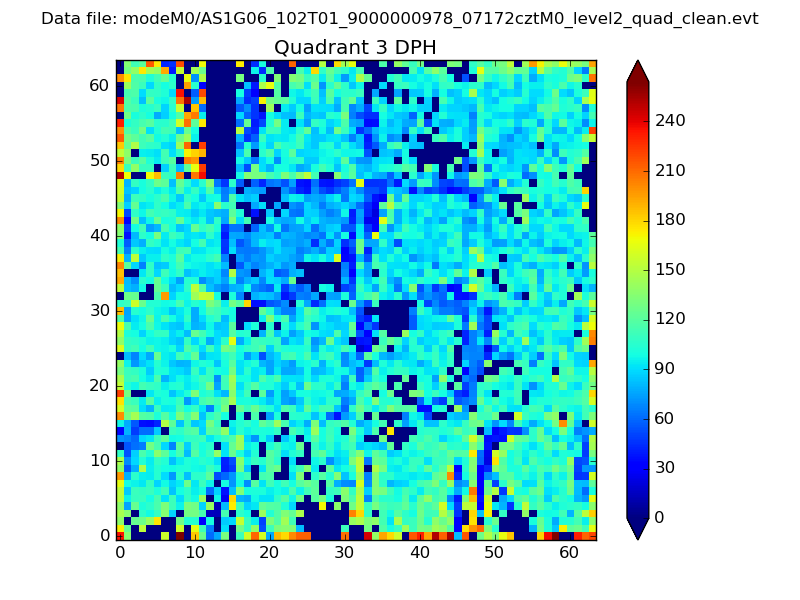 |
 |
Quadrant C |
| Plot type | Count rate plots | Images |
|---|---|---|
| Comparison with Poisson distribution Blue bars denote a histogram of data divided into 1 sec bins. Red curve is a Poisson curve with rate = median count rate of data. |
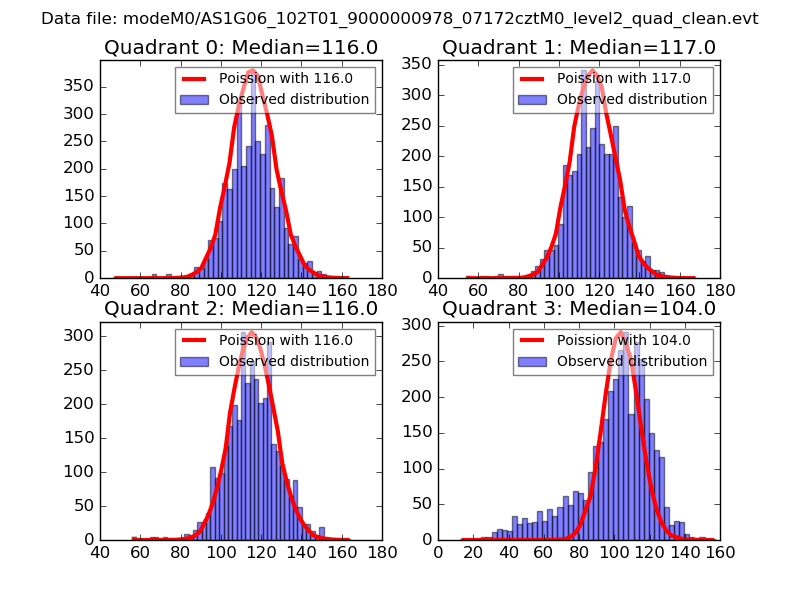 |
 |
| Quadrant-wise count rates Data is divided into 100 sec bins |
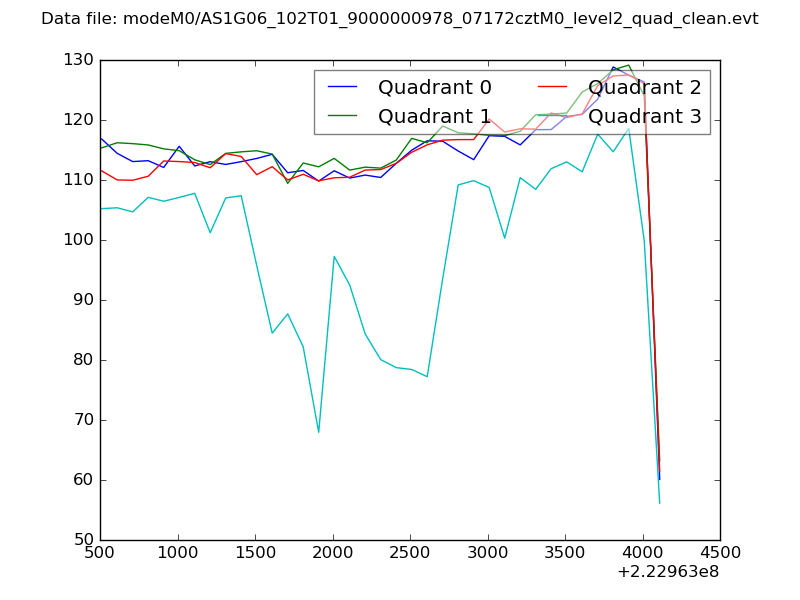 |
|
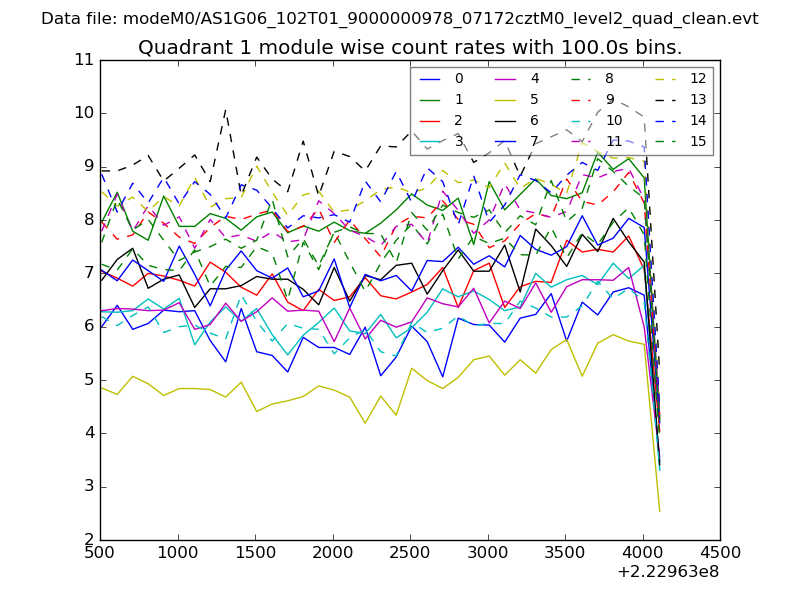
| Module-wise count rates for Quadrant A Data is divided into 100 sec bins |
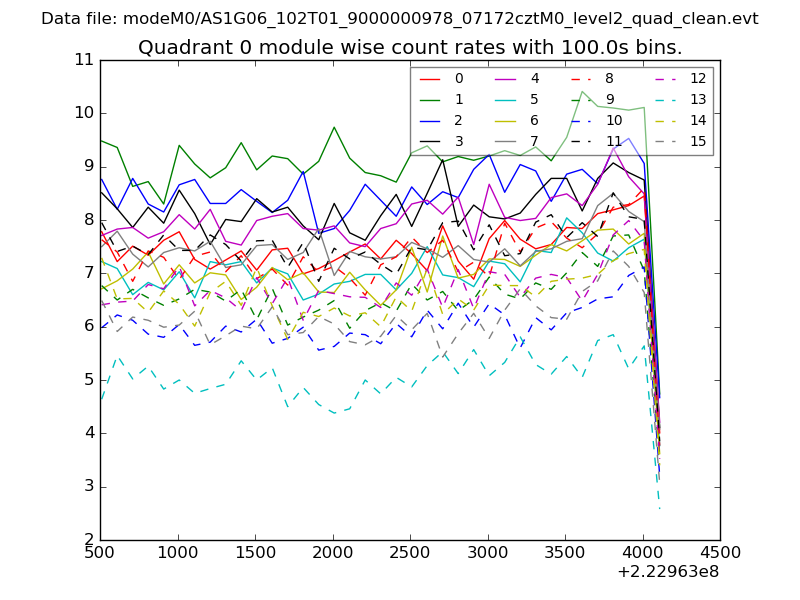 |
 |
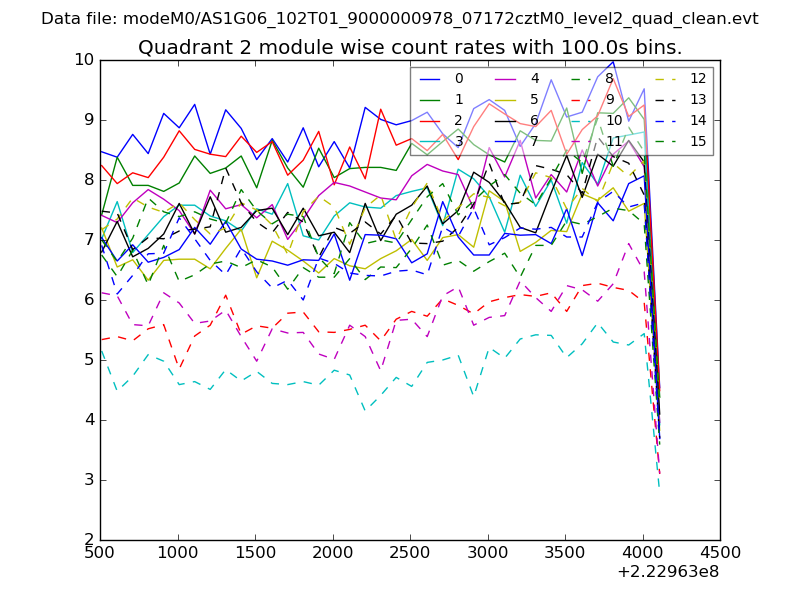
| Module-wise count rates for Quadrant B Data is divided into 100 sec bins |
 |
 |
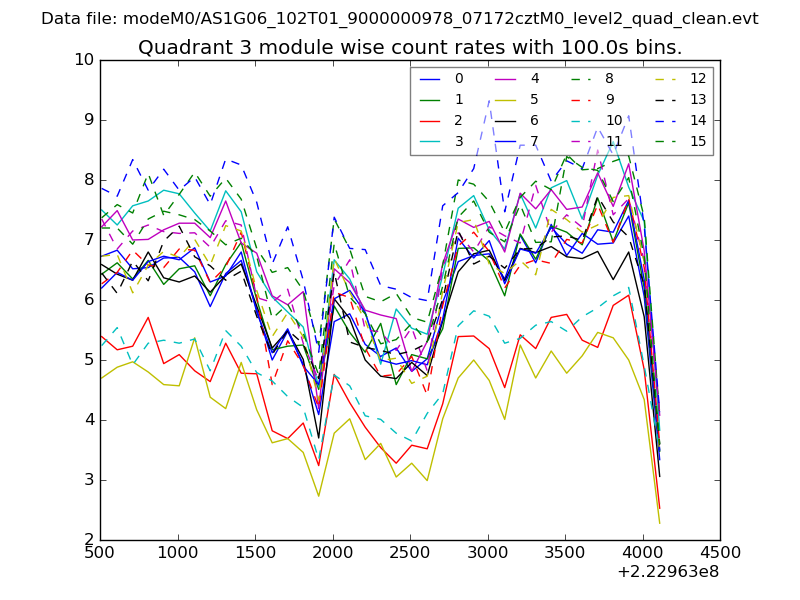
| Module-wise count rates for Quadrant C Data is divided into 100 sec bins |
 |
 |
| Module-wise count rates for Quadrant D Data is divided into 100 sec bins |
 |
 |
| Parameter | Plot |
|---|---|
| CZT HV Monitor | 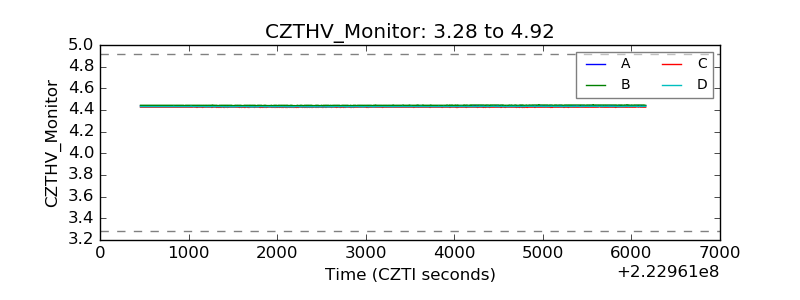 |
| D_VDD | 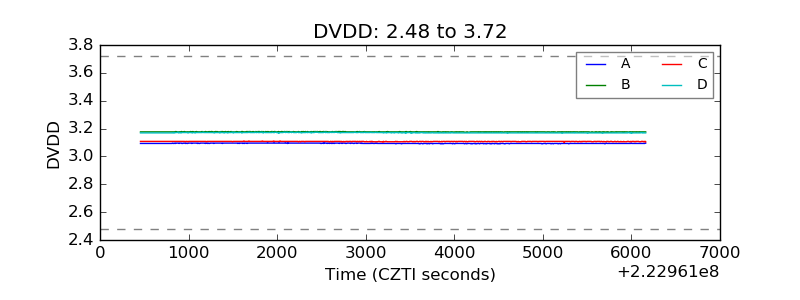 |
| Temperature 1 | 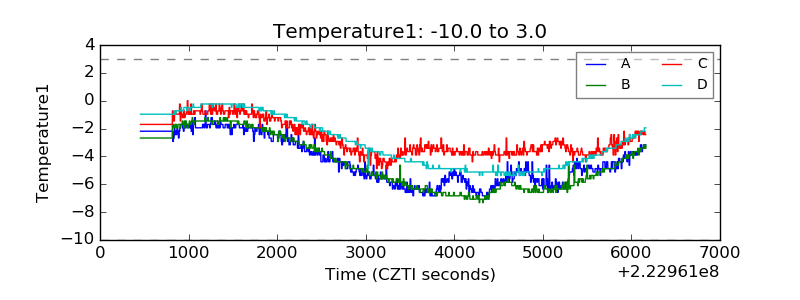 |
| Veto HV Monitor | 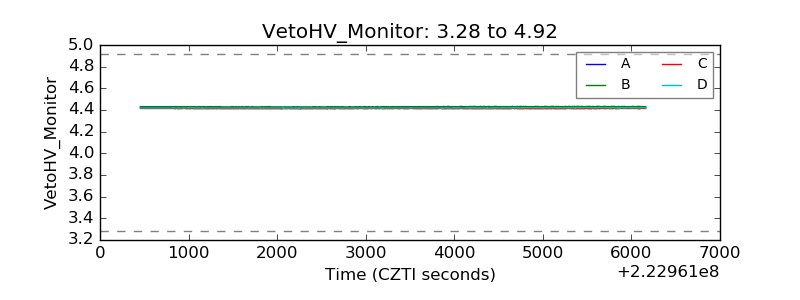 |
| Veto LLD | 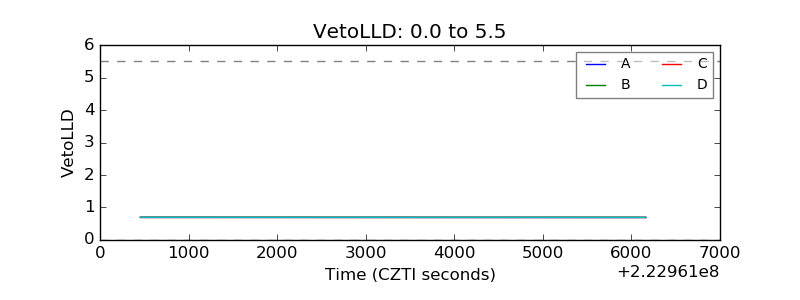 |
| Alpha Counter | 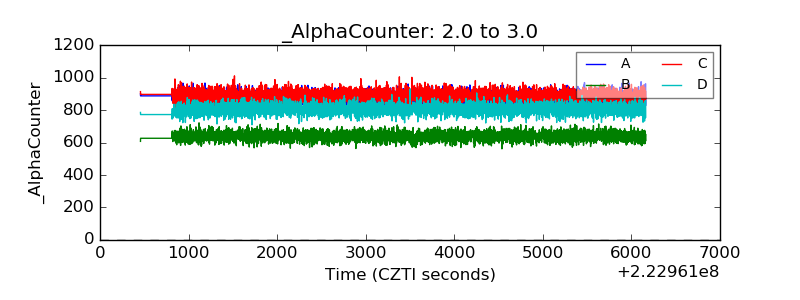 |
| _CPM_Rate | 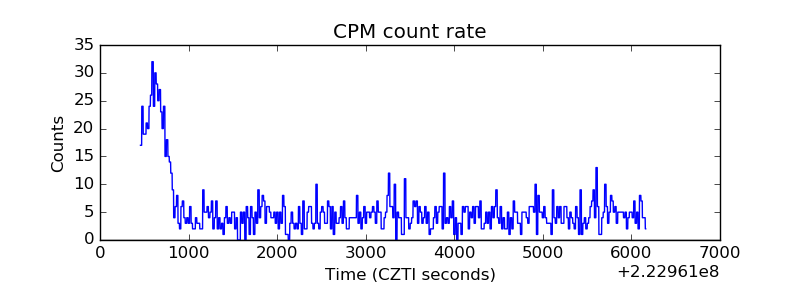 |
| CZT Counter | 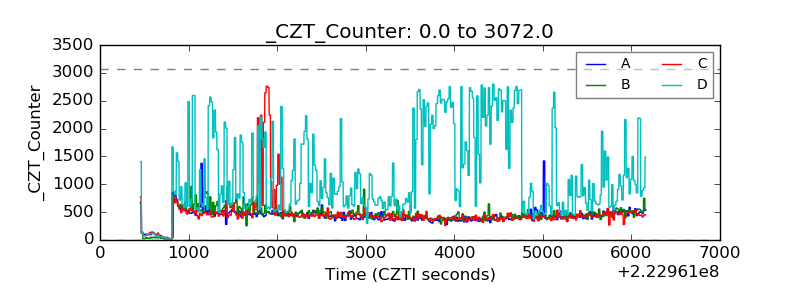 |
| +2.5 Volts monitor |  |
| +5 Volts monitor |  |
| _ROLL_ROT | 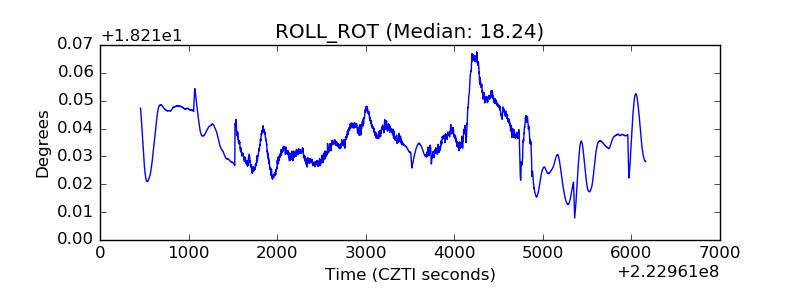 |
| _Roll_DEC | 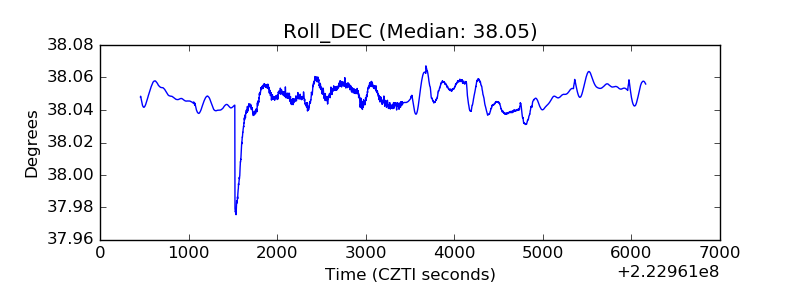 |
| _Roll_RA | 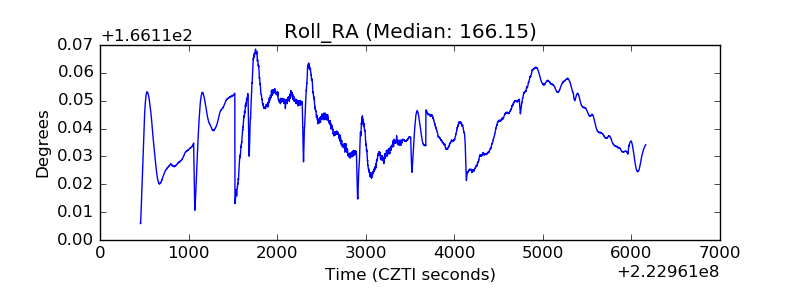 |
| Veto Counter | 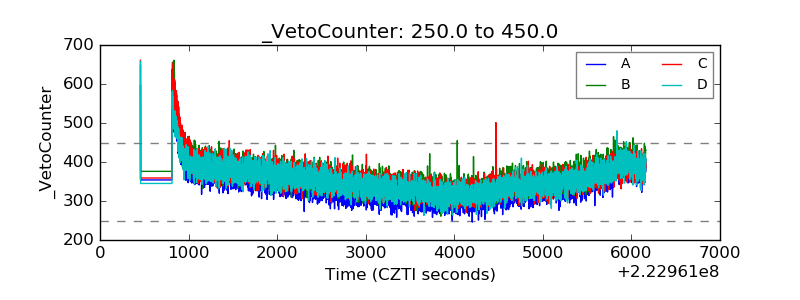 |