| Param | Original file | Final file |
|---|---|---|
| Filename | modeM0/AS1G06_102T01_9000000978_07173cztM0_level2.evt | modeM0/AS1G06_102T01_9000000978_07173cztM0_level2_quad_clean.evt |
| Size (bytes) | 1,024,689,600 | 167,803,200 |
| Size | 977.2 MB | 160.0 MB |
| Events in quadrant A | 6,226,307 | 1,049,237 |
| Events in quadrant B | 6,701,543 | 1,066,697 |
| Events in quadrant C | 6,100,615 | 1,052,160 |
| Events in quadrant D | 11,082,352 | 972,286 |
| Mode M0 | |||
|---|---|---|---|
| Quadrant | BADHDUFLAG | Total packets | Discarded packets |
| A | 0 | 28016 | 4 |
| B | 0 | 29245 | 3 |
| C | 0 | 27858 | 3 |
| D | 0 | 41943 | 6 |
| Mode SS | |||
|---|---|---|---|
| Quadrant | BADHDUFLAG | Total packets | Discarded packets |
| A | 0 | 278 | 0 |
| B | 0 | 278 | 0 |
| C | 0 | 278 | 0 |
| D | 0 | 278 | 0 |
| Mode M9 | |||
|---|---|---|---|
| Quadrant | BADHDUFLAG | Total packets | Discarded packets |
| A | 0 | 21 | 0 |
| B | 0 | 21 | 0 |
| C | 0 | 21 | 0 |
| D | 0 | 21 | 0 |
| Quadrant | Total seconds | Saturated seconds | Saturation percentage |
|---|---|---|---|
| A | 13635 | 129 | 0.946095% |
| B | 13635 | 157 | 1.151448% |
| C | 13635 | 105 | 0.770077% |
| D | 13634 | 1145 | 8.398122% |
Noise dominated data is calculated using 1-second bins in cleaned event files. If a bin has >2000 counts, and if more than 50% of those come from <1% of pixels, then it is considered to be noise-dominated and hence unusable.
| Quadrant | # 1 sec bins | Bins with >0 counts | Bins with >2000 counts | High rate bins dominated by noise | Noise dominated (total time) | Noise dominated (detector-on time) | Marked lightcurve |
|---|---|---|---|---|---|---|---|
| A | 37758 | 13636 | 0 | 0 | 0.00% | 0.00% | 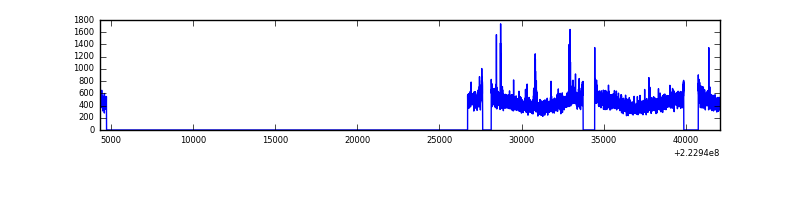 |
| B | 37758 | 13636 | 9 | 9 | 0.02% | 0.07% | 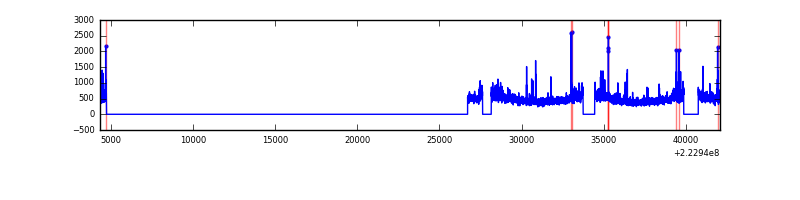 |
| C | 37758 | 13636 | 5 | 5 | 0.01% | 0.04% | 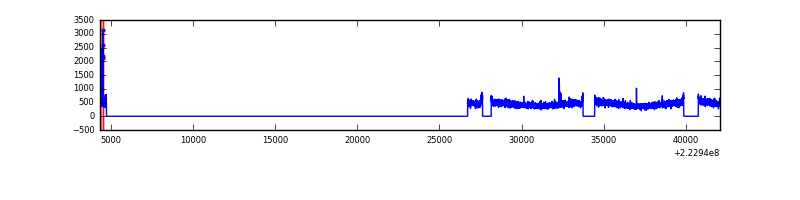 |
| D | 37758 | 13636 | 1088 | 1088 | 2.88% | 7.98% | 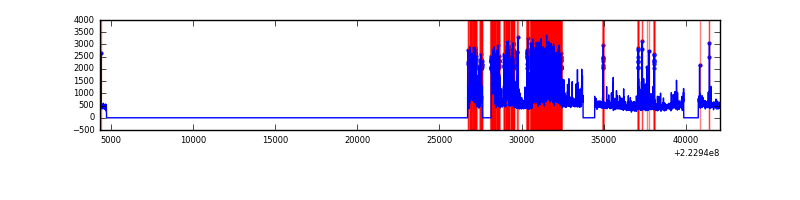 |
Top three noisy pixels from each quadrant. If the there are fewer than three noisy pixels in the level2.evt file, extra rows are filled as -1
| Pixel properties | Quadrant properties | ||||||
|---|---|---|---|---|---|---|---|
| Quadrant | DetID | PixID | Counts | Sigma | Mean | Median | Sigma |
| A | 14 | 111 | 80683 | 244.58 | 1587 | 1554 | 323.5 |
| A | 8 | 15 | 21428 | 61.43 | 1587 | 1554 | 323.5 |
| A | 0 | 226 | 15127 | 41.95 | 1587 | 1554 | 323.5 |
| B | 0 | 214 | 170335 | 555.51 | 1600 | 1563 | 303.8 |
| B | 0 | 219 | 98117 | 317.81 | 1600 | 1563 | 303.8 |
| B | 15 | 204 | 80927 | 261.23 | 1600 | 1563 | 303.8 |
| C | 4 | 254 | 62576 | 171.4 | 1539 | 1543 | 356.1 |
| C | 9 | 68 | 24380 | 64.13 | 1539 | 1543 | 356.1 |
| C | 13 | 61 | 11966 | 29.27 | 1539 | 1543 | 356.1 |
| D | 12 | 221 | 3693844 | 10103.61 | 1496 | 1448 | 365.5 |
| D | 12 | 233 | 553482 | 1510.55 | 1496 | 1448 | 365.5 |
| D | 8 | 195 | 526640 | 1437.1 | 1496 | 1448 | 365.5 |
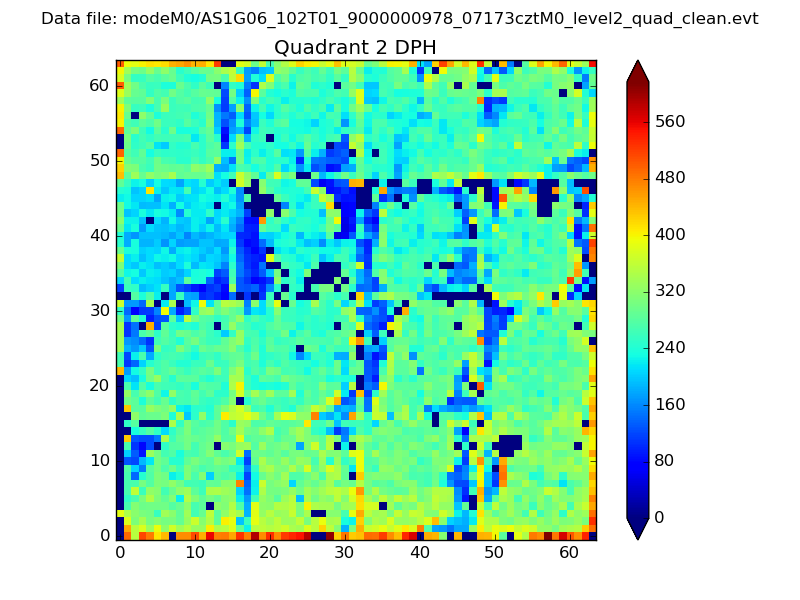
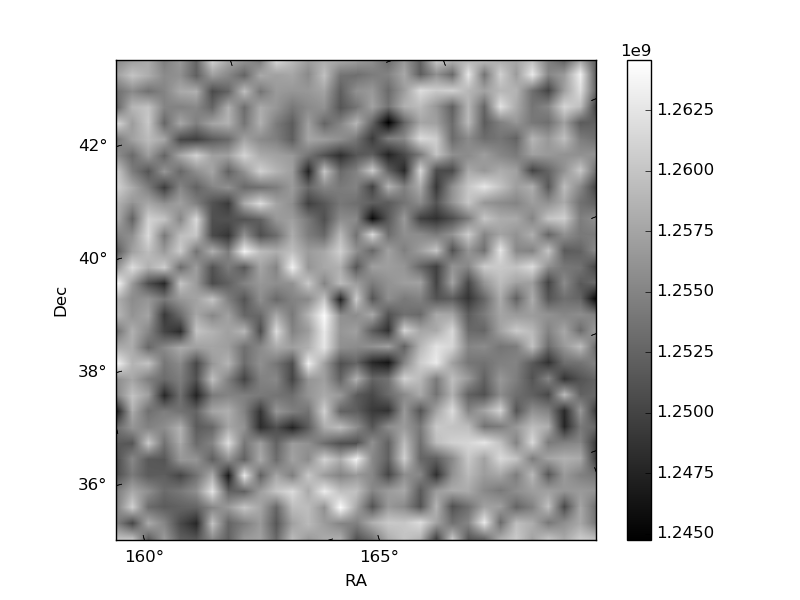
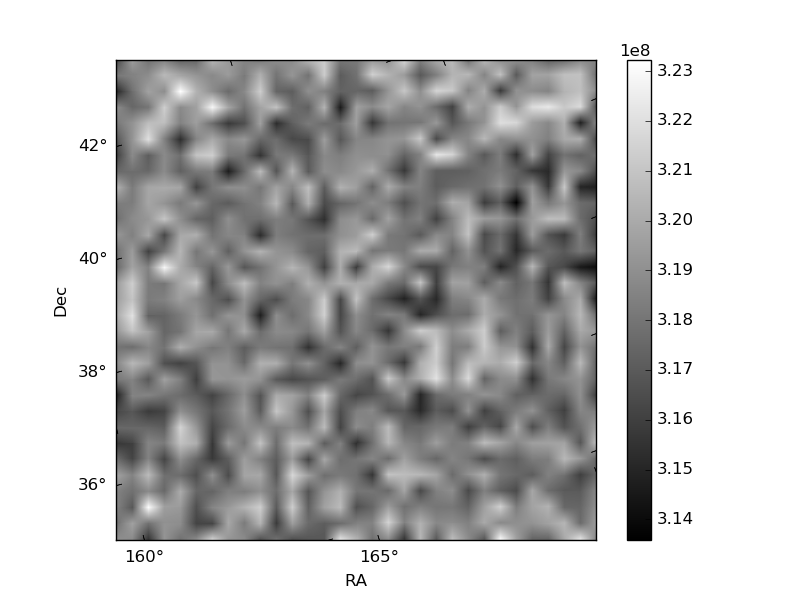
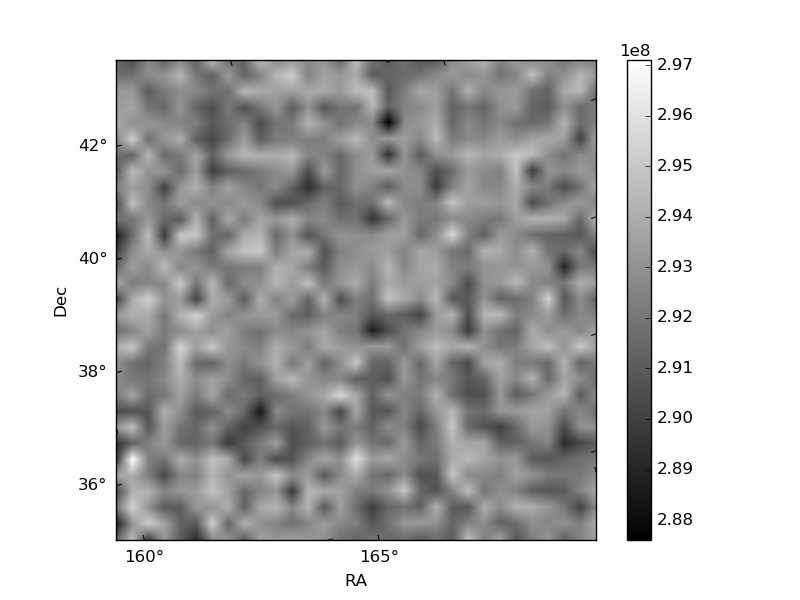
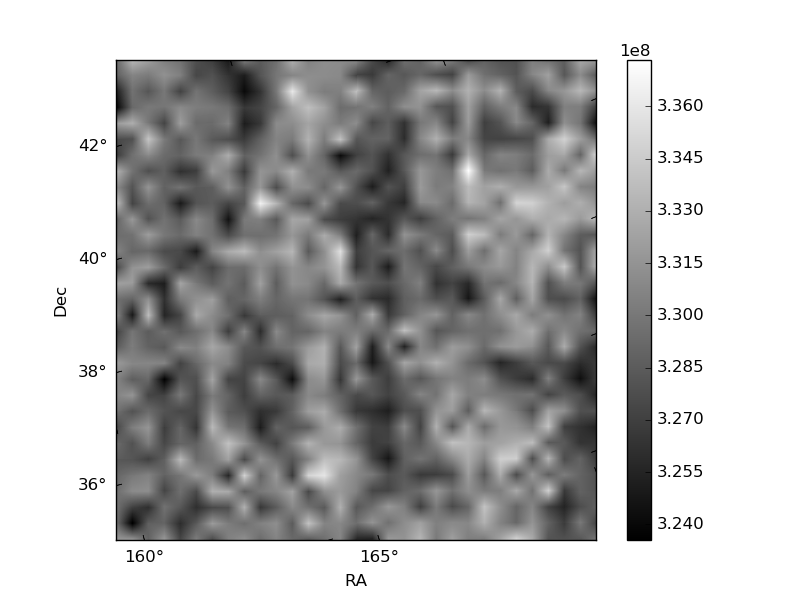
Histogram calculated using DETX and DETY for each event in the final _common_clean file
| Quadrant A | 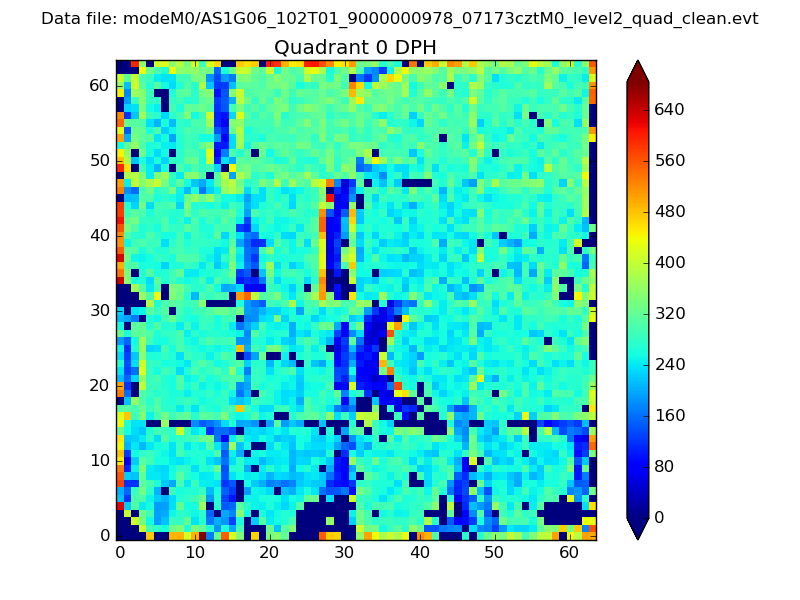 |
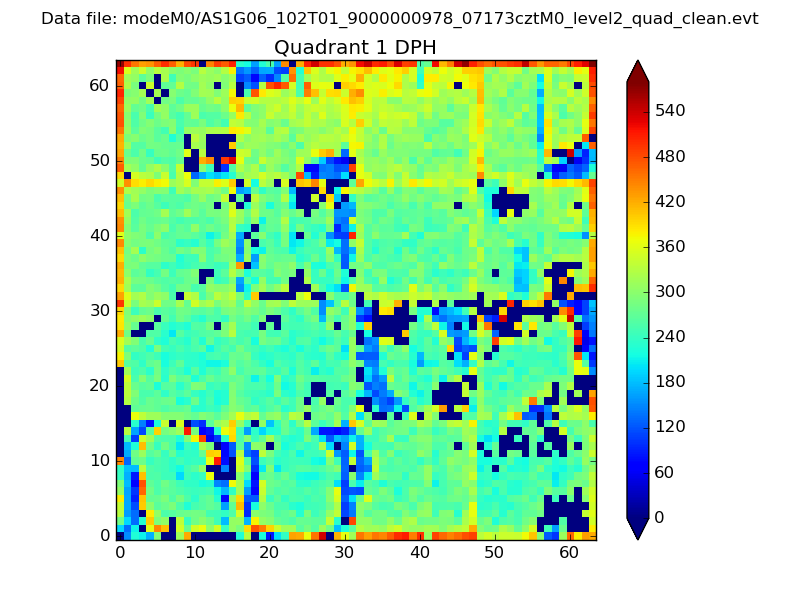 |
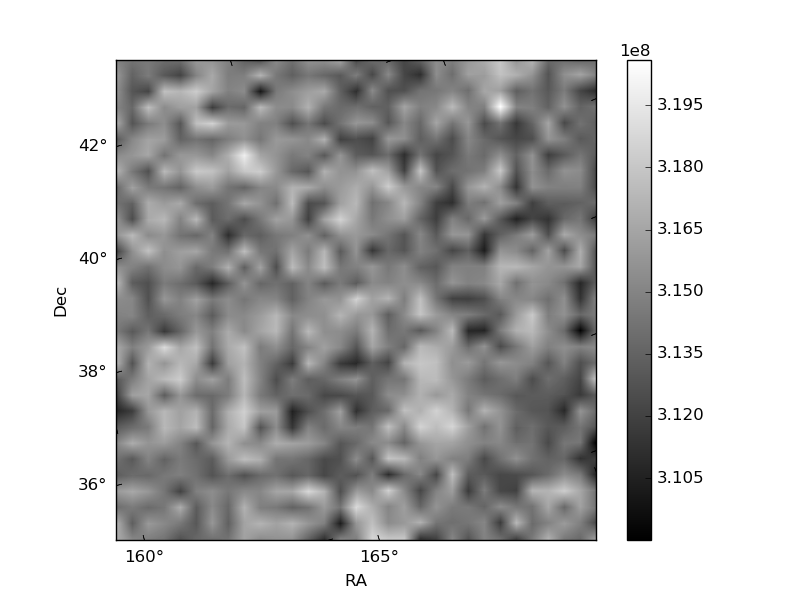
Quadrant B |
|---|---|---|---|
| Quadrant D | 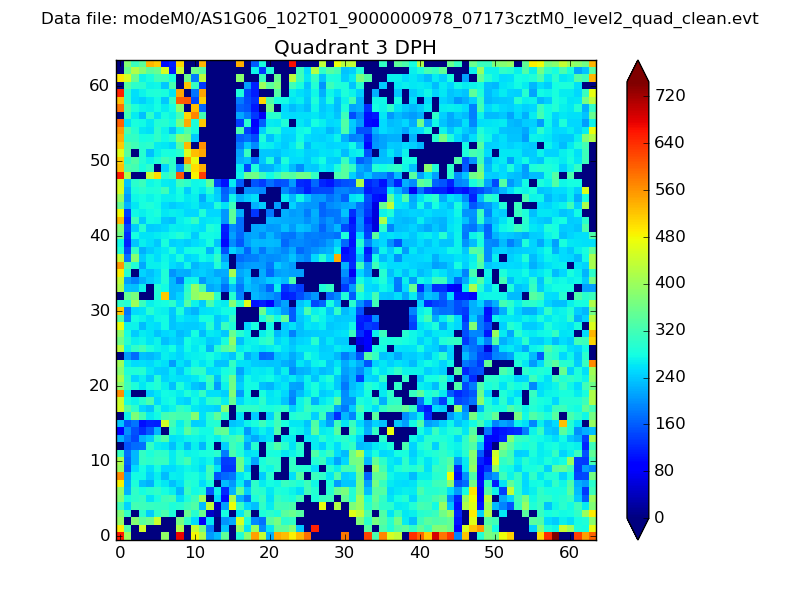 |
 |
Quadrant C |
| Plot type | Count rate plots | Images |
|---|---|---|
| Comparison with Poisson distribution Blue bars denote a histogram of data divided into 1 sec bins. Red curve is a Poisson curve with rate = median count rate of data. |
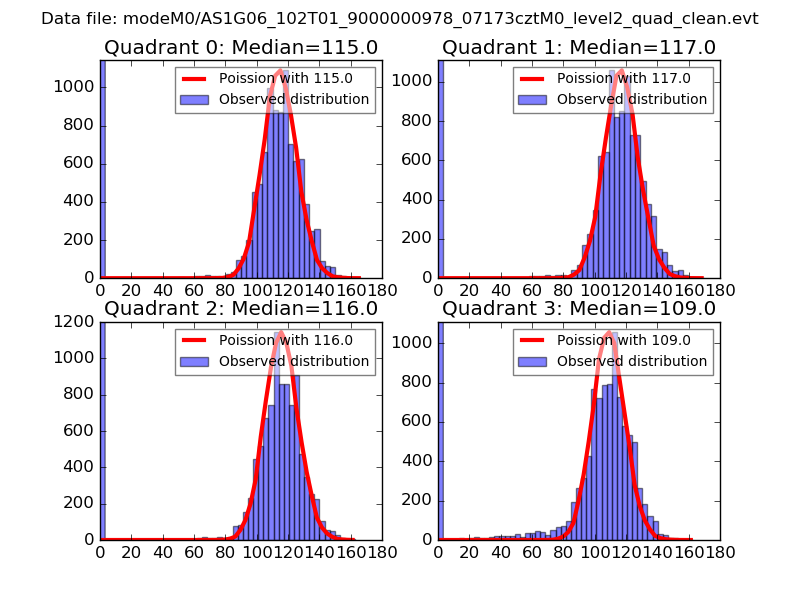 |
 |
| Quadrant-wise count rates Data is divided into 100 sec bins |
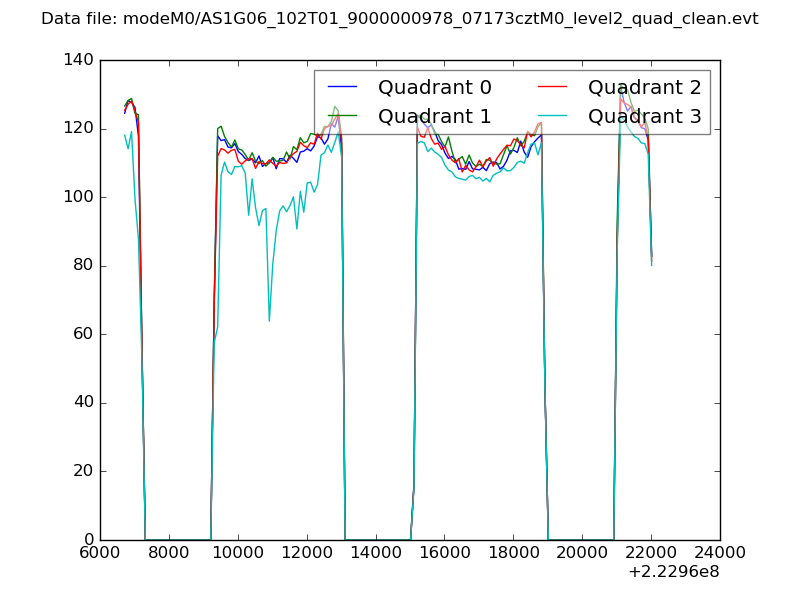 |
|
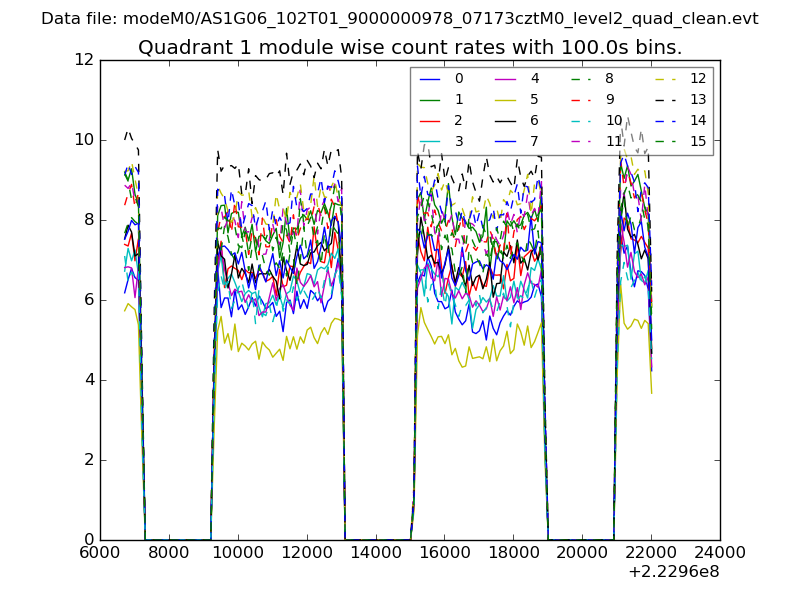
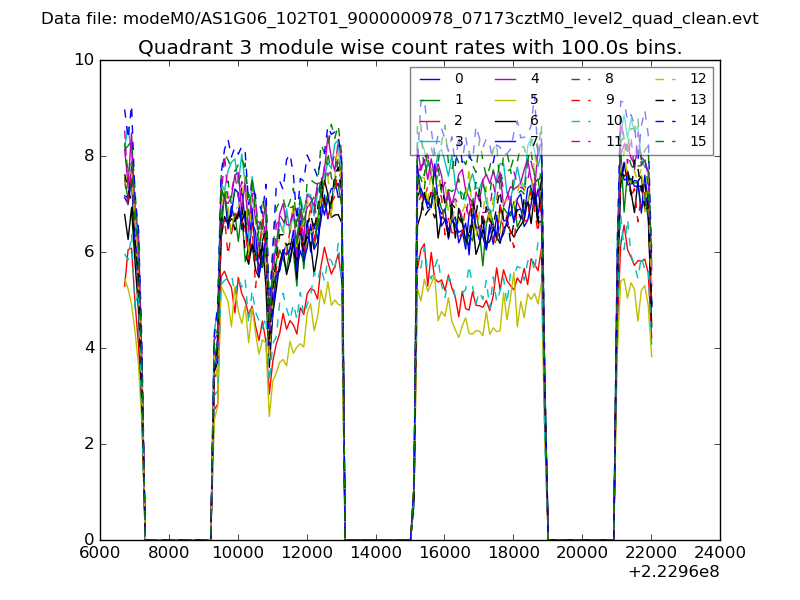
| Module-wise count rates for Quadrant A Data is divided into 100 sec bins |
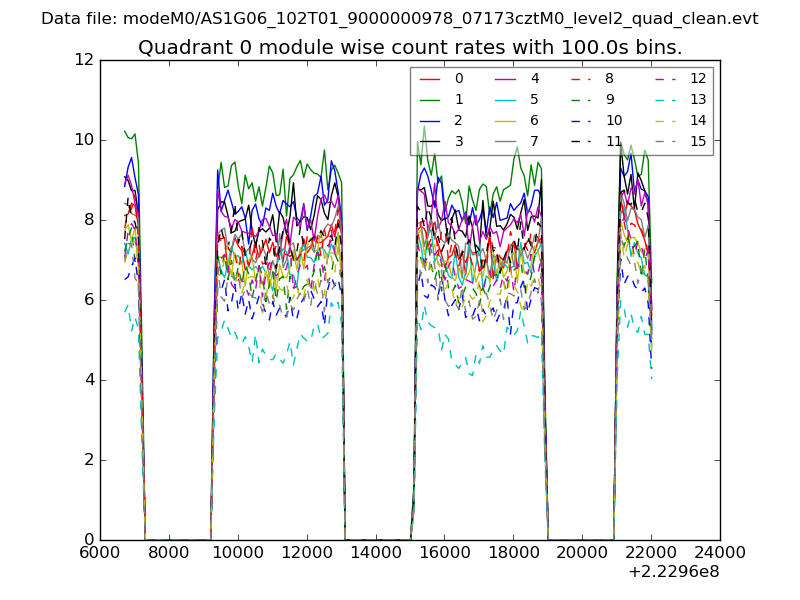 |
 |
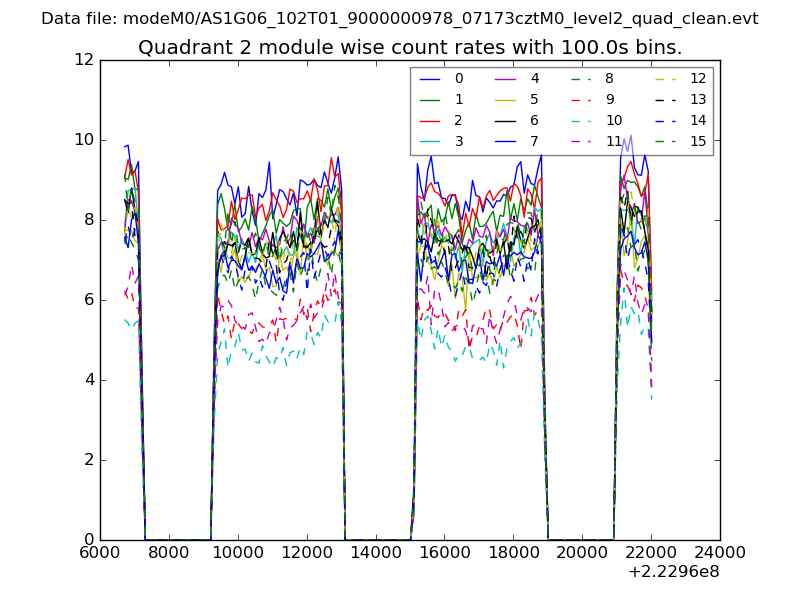
| Module-wise count rates for Quadrant B Data is divided into 100 sec bins |
 |
 |
| Module-wise count rates for Quadrant C Data is divided into 100 sec bins |
 |
 |
| Module-wise count rates for Quadrant D Data is divided into 100 sec bins |
 |
 |
| Parameter | Plot |
|---|---|
| CZT HV Monitor | 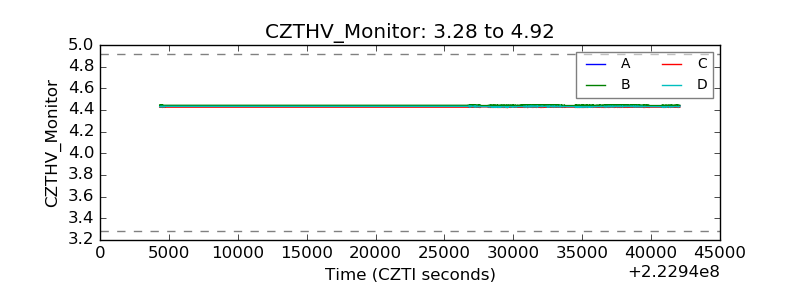 |
| D_VDD | 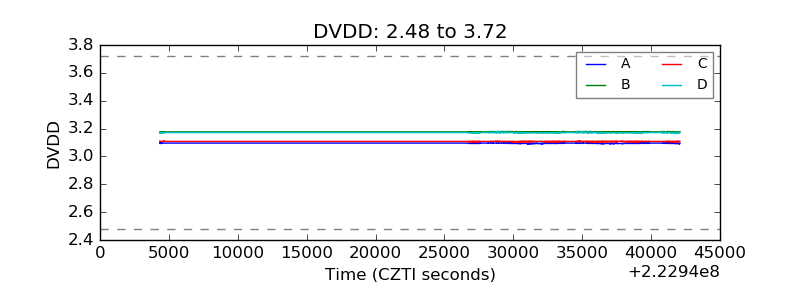 |
| Temperature 1 | 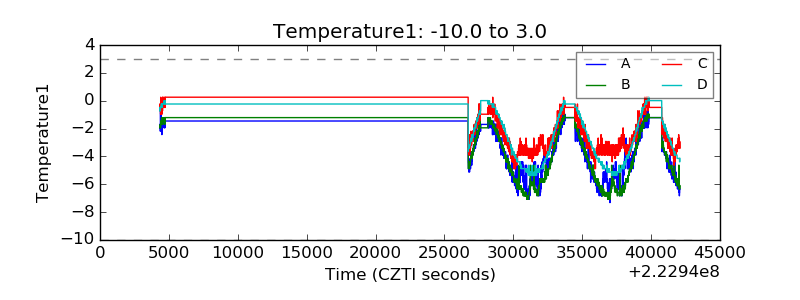 |
| Veto HV Monitor | 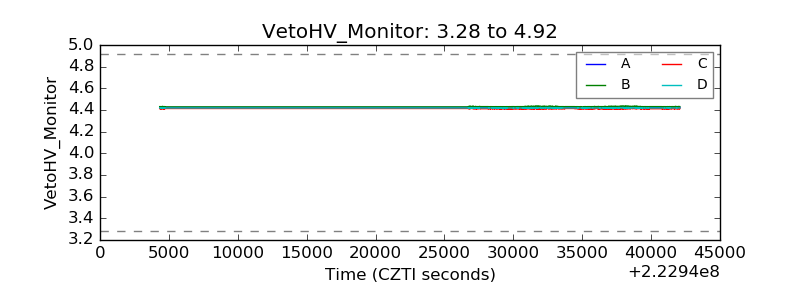 |
| Veto LLD | 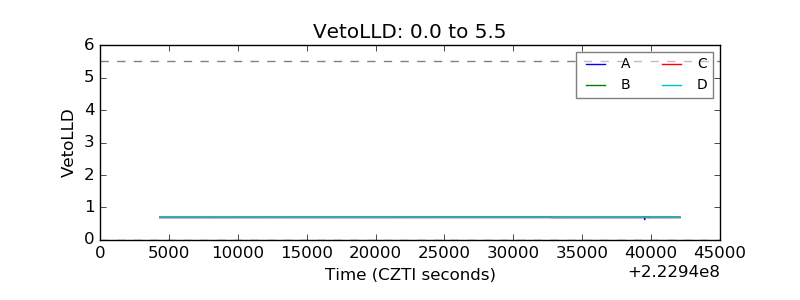 |
| Alpha Counter | 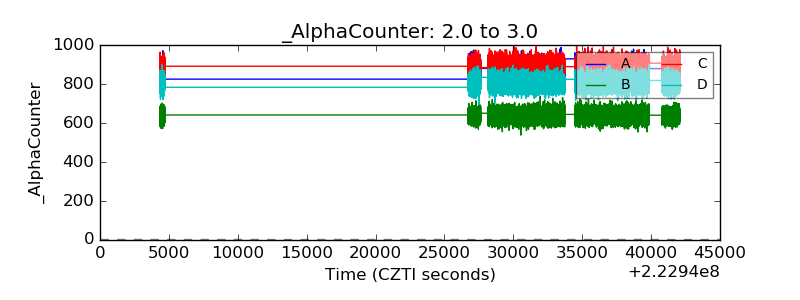 |
| _CPM_Rate | 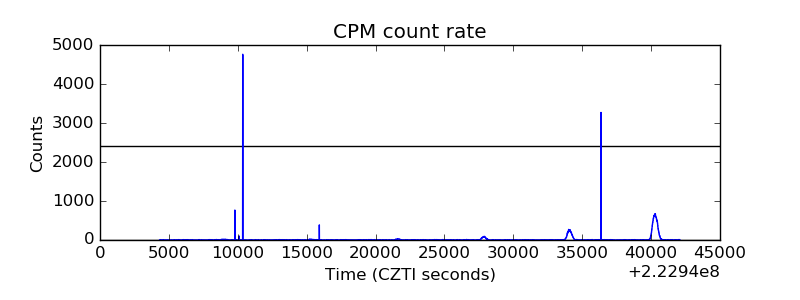 |
| CZT Counter | 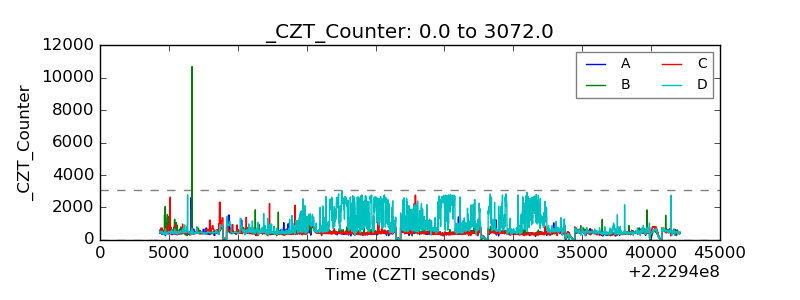 |
| +2.5 Volts monitor |  |
| +5 Volts monitor |  |
| _ROLL_ROT | 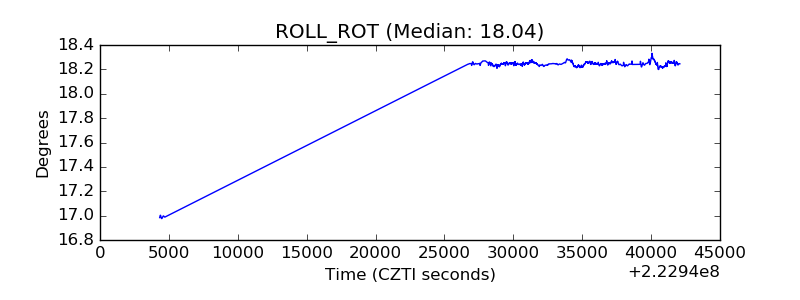 |
| _Roll_DEC | 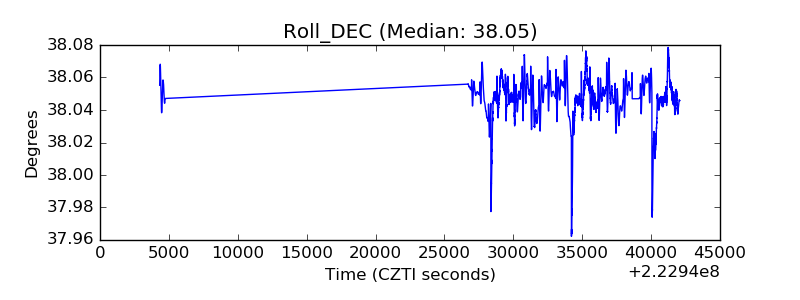 |
| _Roll_RA | 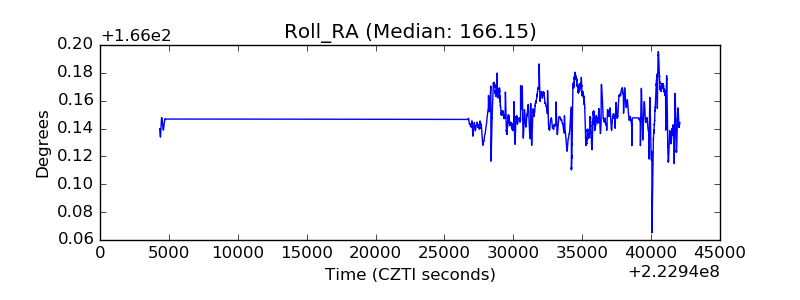 |
| Veto Counter | 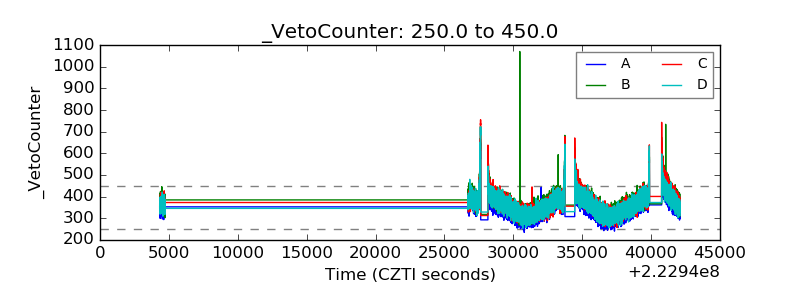 |