| Param | Original file | Final file |
|---|---|---|
| Filename | modeM0/AS1G06_102T01_9000000978_07174cztM0_level2.evt | modeM0/AS1G06_102T01_9000000978_07174cztM0_level2_quad_clean.evt |
| Size (bytes) | 2,768,875,200 | 422,032,320 |
| Size | 2.6 GB | 402.5 MB |
| Events in quadrant A | 15,807,384 | 2,668,215 |
| Events in quadrant B | 16,895,030 | 2,716,659 |
| Events in quadrant C | 16,763,044 | 2,668,606 |
| Events in quadrant D | 32,101,852 | 2,395,817 |
| Mode M0 | |||
|---|---|---|---|
| Quadrant | BADHDUFLAG | Total packets | Discarded packets |
| A | 0 | 70653 | 6 |
| B | 0 | 73173 | 5 |
| C | 0 | 74141 | 5 |
| D | 0 | 118245 | 10 |
| Mode SS | |||
|---|---|---|---|
| Quadrant | BADHDUFLAG | Total packets | Discarded packets |
| A | 0 | 690 | 0 |
| B | 0 | 690 | 0 |
| C | 0 | 690 | 0 |
| D | 0 | 690 | 0 |
| Mode M9 | |||
|---|---|---|---|
| Quadrant | BADHDUFLAG | Total packets | Discarded packets |
| A | 0 | 30 | 0 |
| B | 0 | 30 | 0 |
| C | 0 | 30 | 0 |
| D | 0 | 30 | 0 |
| Quadrant | Total seconds | Saturated seconds | Saturation percentage |
|---|---|---|---|
| A | 33931 | 725 | 2.136689% |
| B | 33931 | 721 | 2.124901% |
| C | 33931 | 914 | 2.693702% |
| D | 33930 | 5089 | 14.998526% |
Noise dominated data is calculated using 1-second bins in cleaned event files. If a bin has >2000 counts, and if more than 50% of those come from <1% of pixels, then it is considered to be noise-dominated and hence unusable.
| Quadrant | # 1 sec bins | Bins with >0 counts | Bins with >2000 counts | High rate bins dominated by noise | Noise dominated (total time) | Noise dominated (detector-on time) | Marked lightcurve |
|---|---|---|---|---|---|---|---|
| A | 44021 | 33933 | 39 | 39 | 0.09% | 0.11% | 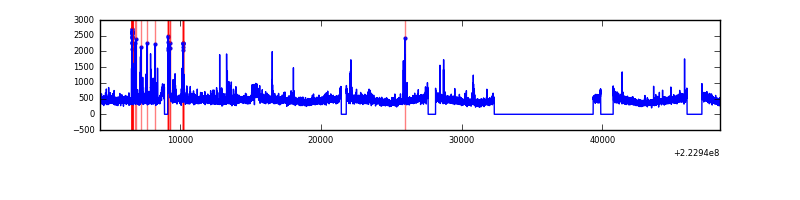 |
| B | 44021 | 33933 | 16 | 16 | 0.04% | 0.05% | 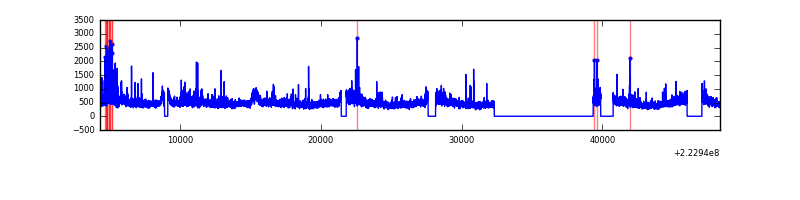 |
| C | 44021 | 33933 | 277 | 277 | 0.63% | 0.82% | 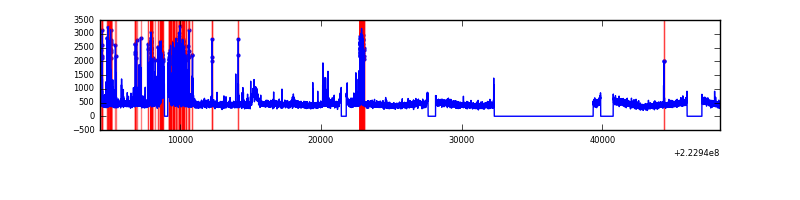 |
| D | 44021 | 33933 | 4263 | 4263 | 9.68% | 12.56% | 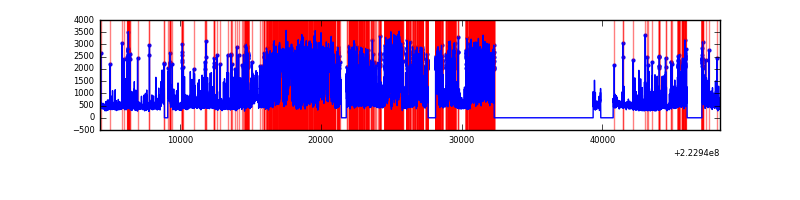 |
Top three noisy pixels from each quadrant. If the there are fewer than three noisy pixels in the level2.evt file, extra rows are filled as -1
| Pixel properties | Quadrant properties | ||||||
|---|---|---|---|---|---|---|---|
| Quadrant | DetID | PixID | Counts | Sigma | Mean | Median | Sigma |
| A | 14 | 238 | 345397 | 428.9 | 3935 | 3852 | 796.3 |
| A | 14 | 111 | 160698 | 196.96 | 3935 | 3852 | 796.3 |
| A | 8 | 15 | 95276 | 114.81 | 3935 | 3852 | 796.3 |
| B | 0 | 214 | 415040 | 541.57 | 3986 | 3885 | 759.2 |
| B | 0 | 219 | 329868 | 429.39 | 3986 | 3885 | 759.2 |
| B | 15 | 204 | 238510 | 309.05 | 3986 | 3885 | 759.2 |
| C | 4 | 254 | 1266737 | 1431.64 | 3821 | 3823 | 882.1 |
| C | 8 | 208 | 422021 | 474.07 | 3821 | 3823 | 882.1 |
| C | 9 | 68 | 120685 | 132.47 | 3821 | 3823 | 882.1 |
| D | 12 | 221 | 12404338 | 14044.52 | 3628 | 3511 | 883.0 |
| D | 2 | 216 | 2863054 | 3238.57 | 3628 | 3511 | 883.0 |
| D | 8 | 195 | 1197206 | 1351.92 | 3628 | 3511 | 883.0 |
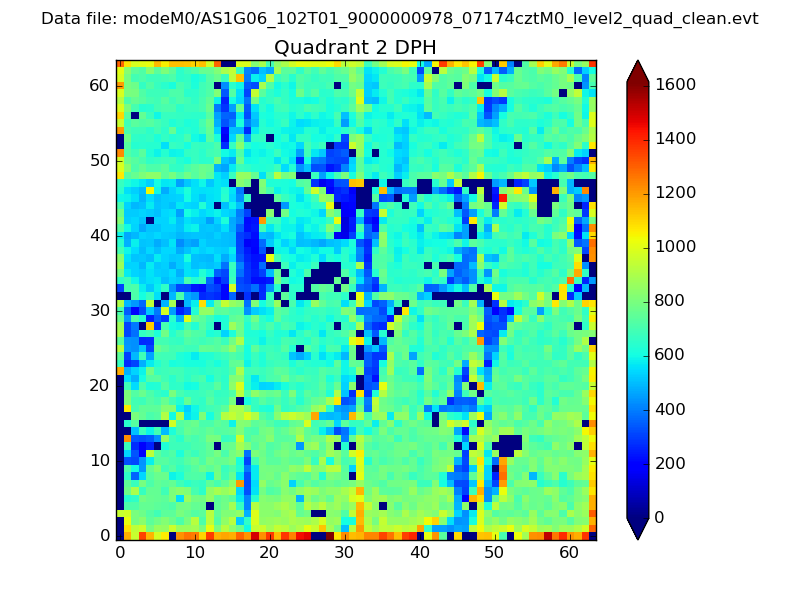
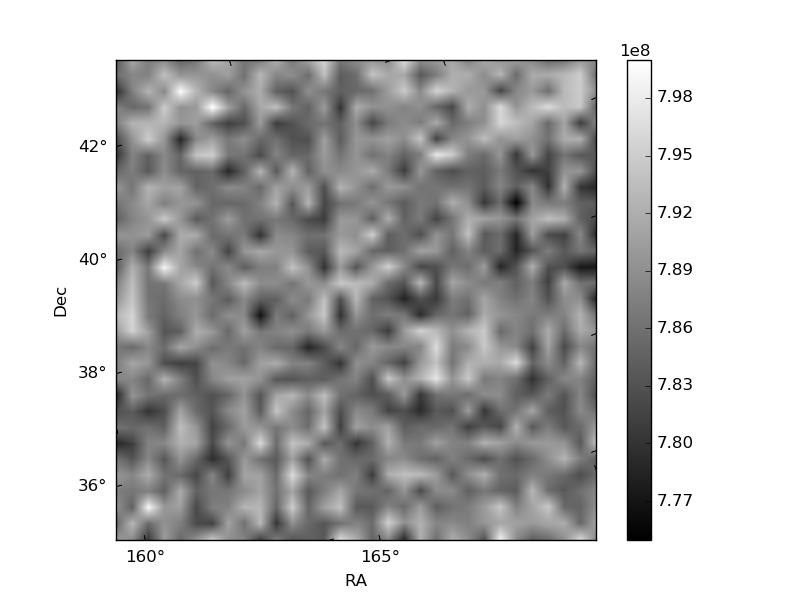
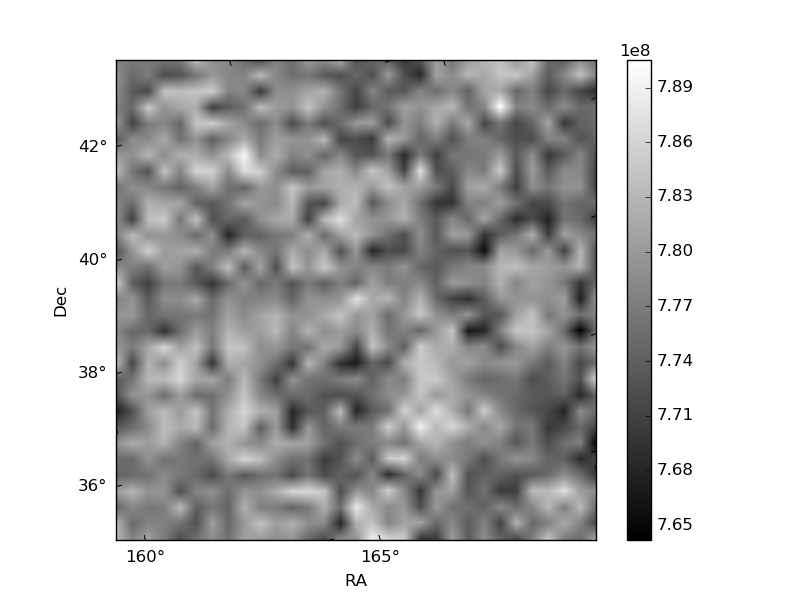
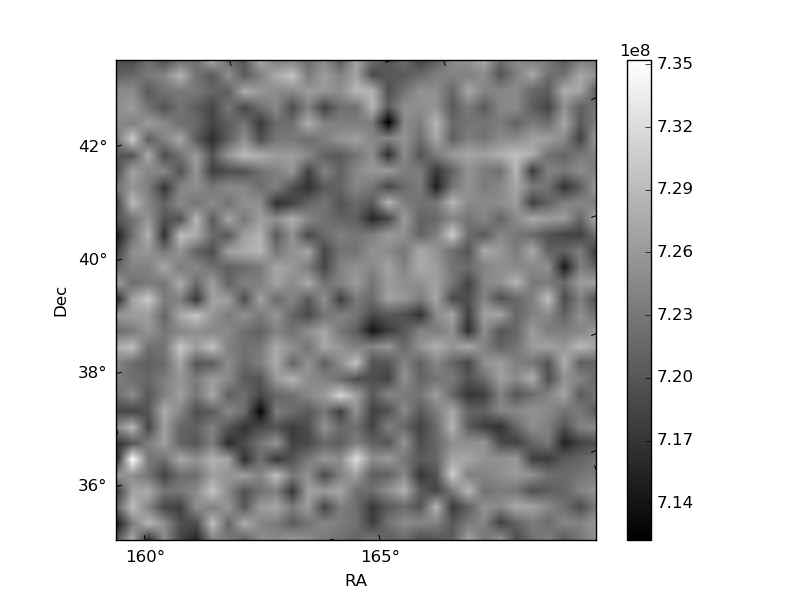
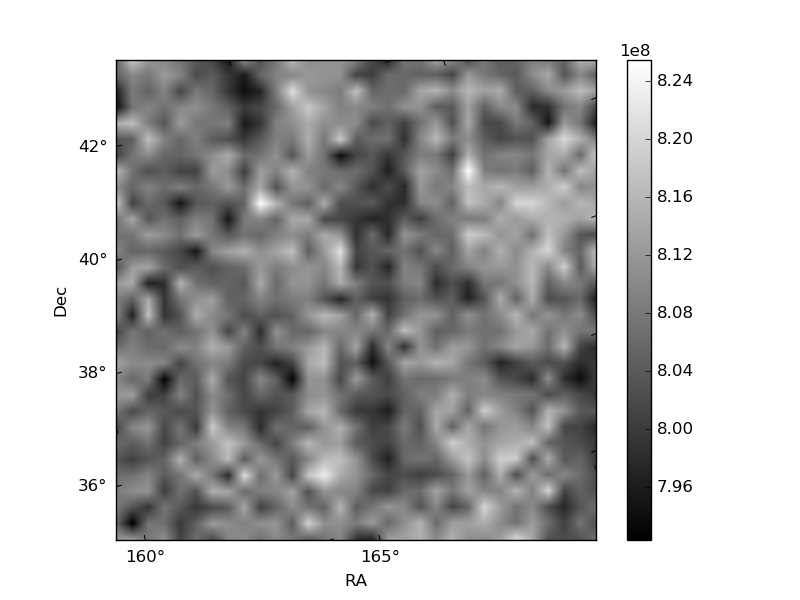
Histogram calculated using DETX and DETY for each event in the final _common_clean file
| Quadrant A | 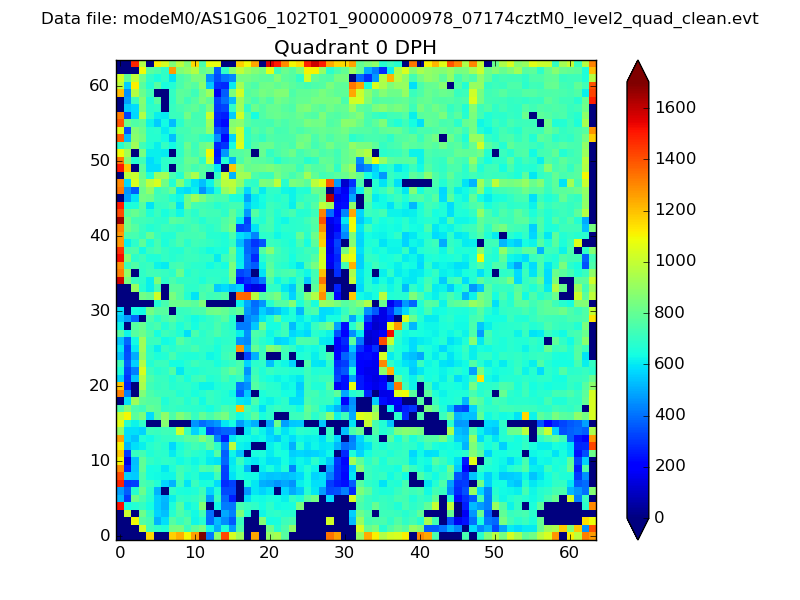 |
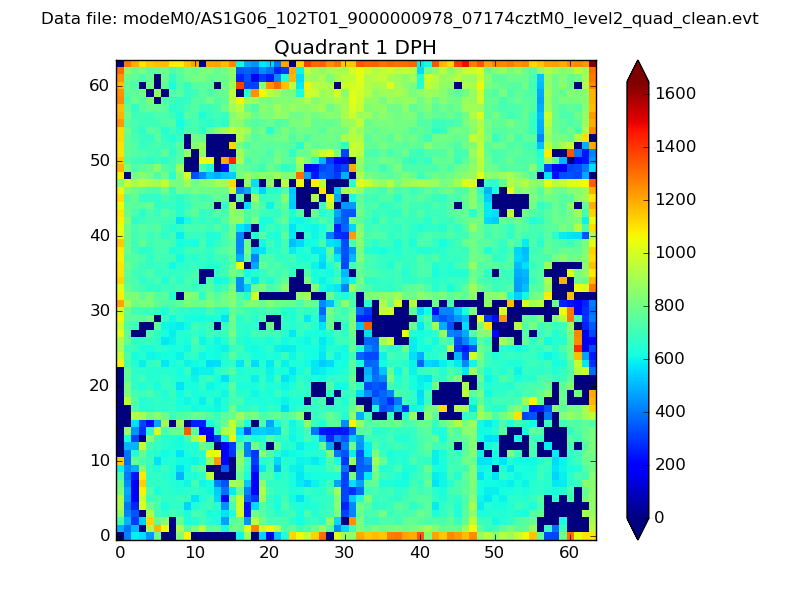 |
Quadrant B |
|---|---|---|---|
| Quadrant D | 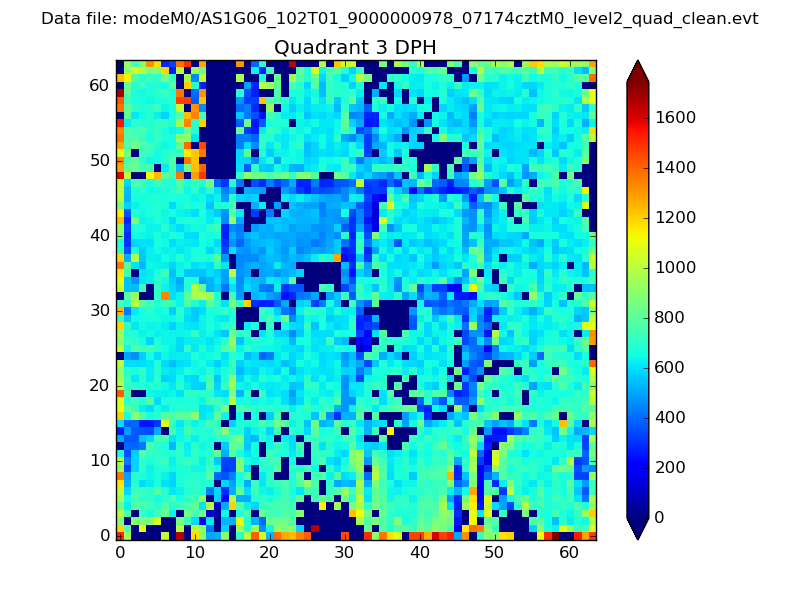 |
 |
Quadrant C |
| Plot type | Count rate plots | Images |
|---|---|---|
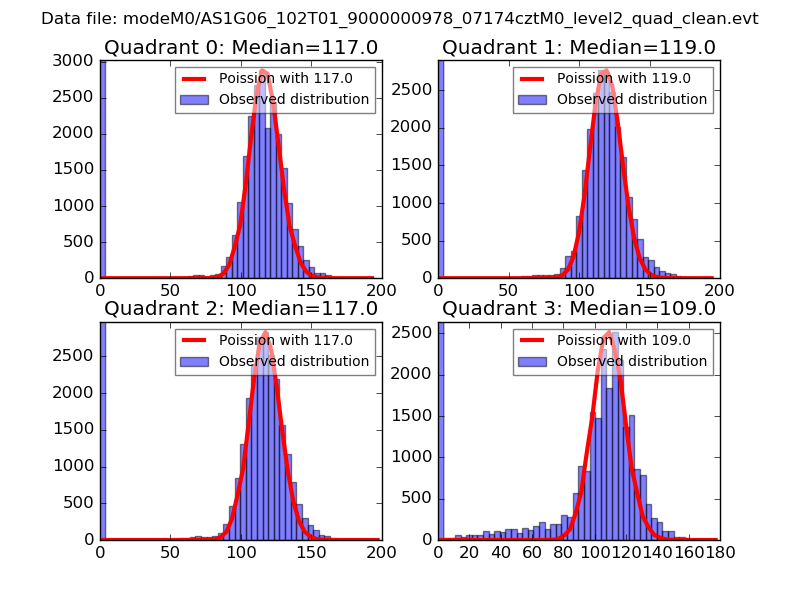
| Comparison with Poisson distribution Blue bars denote a histogram of data divided into 1 sec bins. Red curve is a Poisson curve with rate = median count rate of data. |
 |
 |
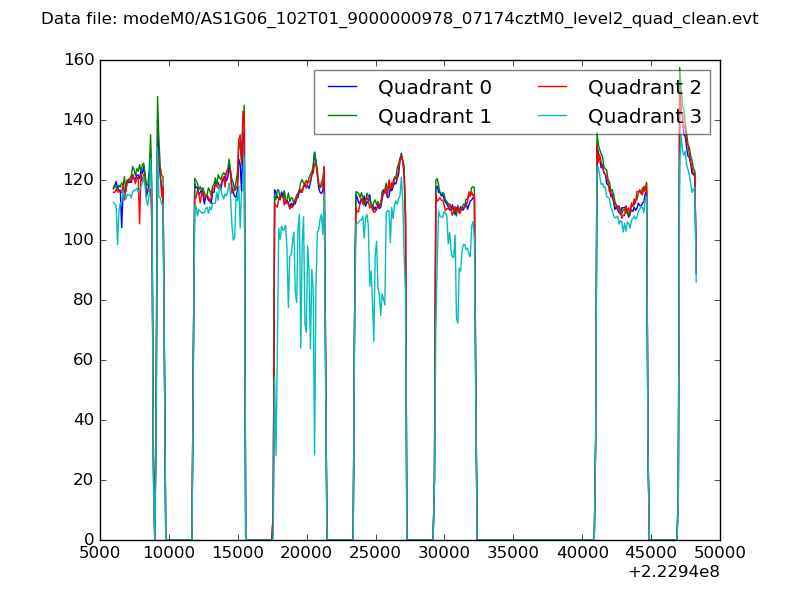
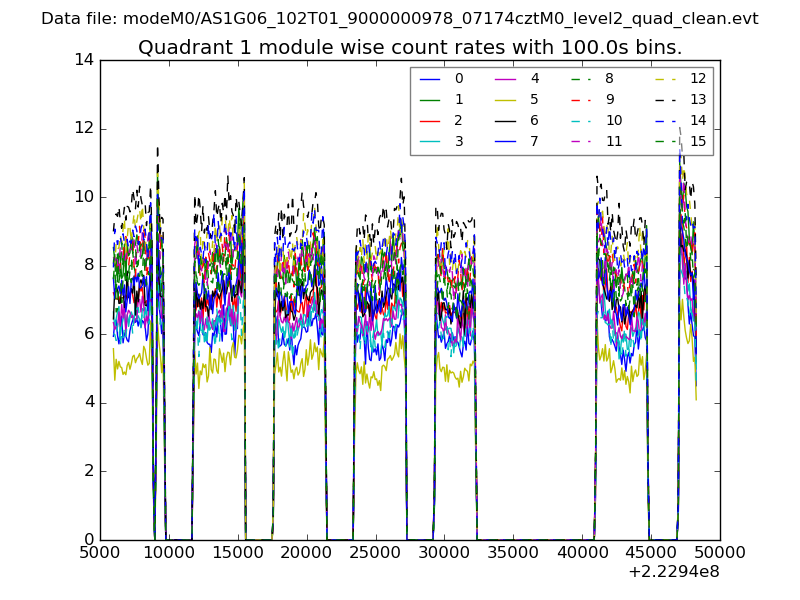
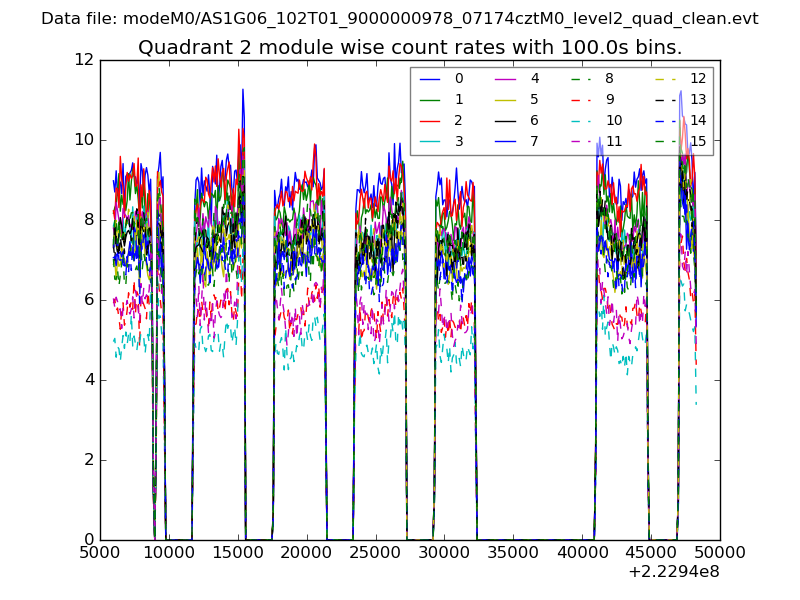
| Quadrant-wise count rates Data is divided into 100 sec bins |
 |
|
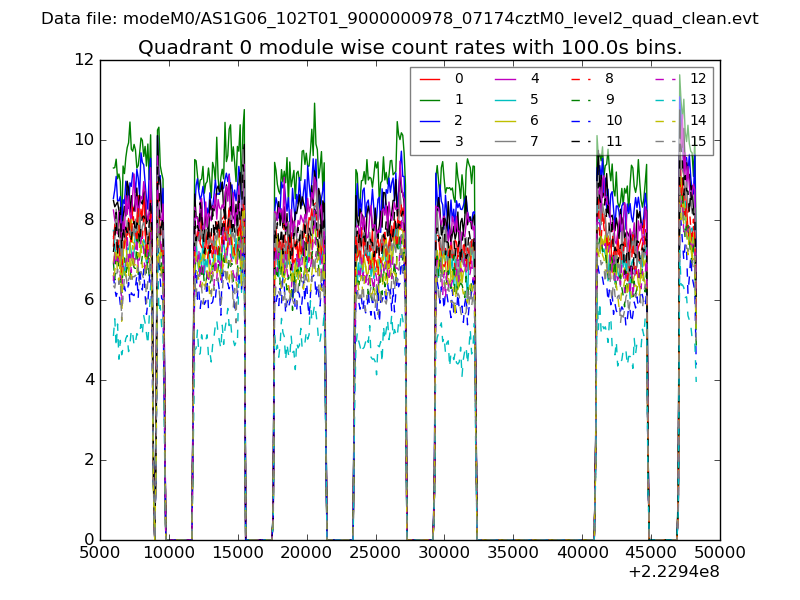
| Module-wise count rates for Quadrant A Data is divided into 100 sec bins |
 |
 |
| Module-wise count rates for Quadrant B Data is divided into 100 sec bins |
 |
 |
| Module-wise count rates for Quadrant C Data is divided into 100 sec bins |
 |
 |
| Module-wise count rates for Quadrant D Data is divided into 100 sec bins |
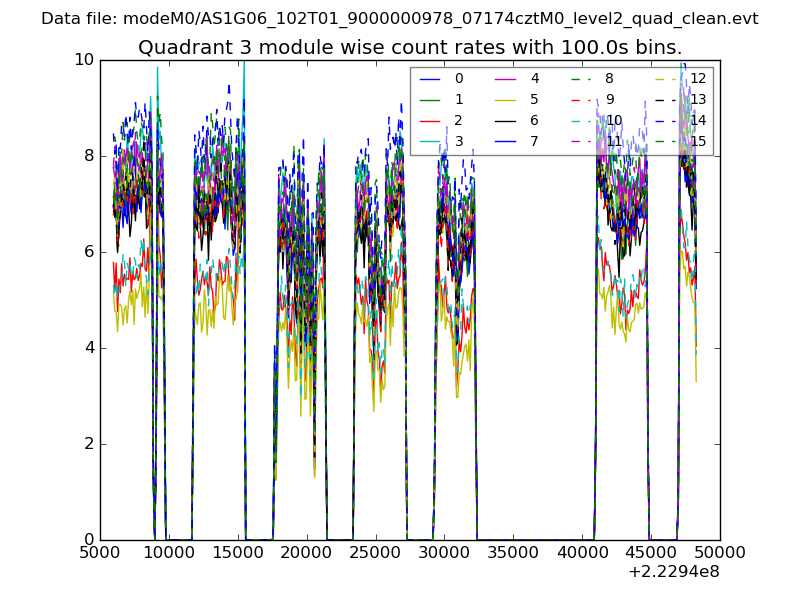 |
 |
| Parameter | Plot |
|---|---|
| CZT HV Monitor | 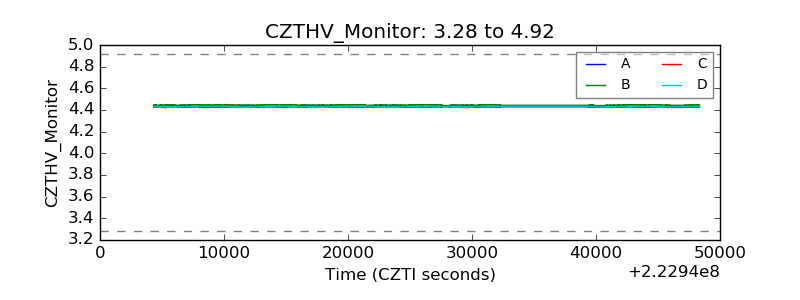 |
| D_VDD | 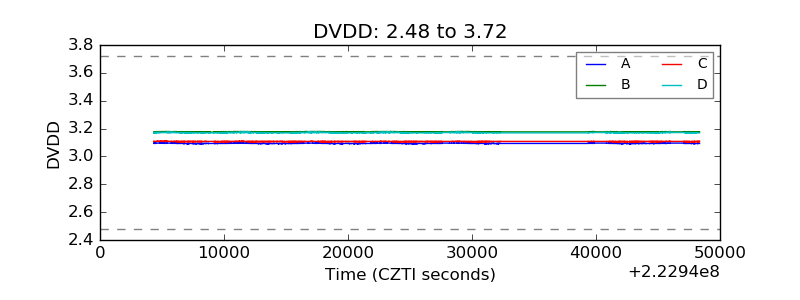 |
| Temperature 1 | 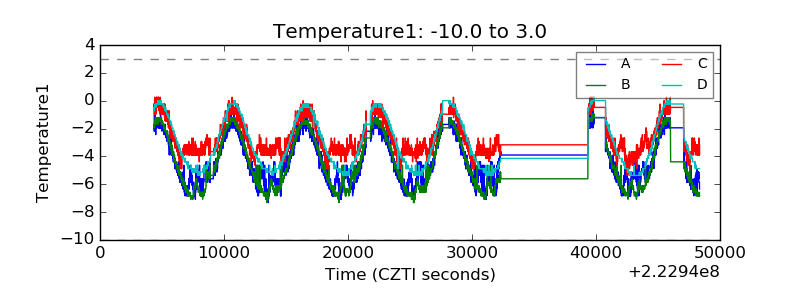 |
| Veto HV Monitor | 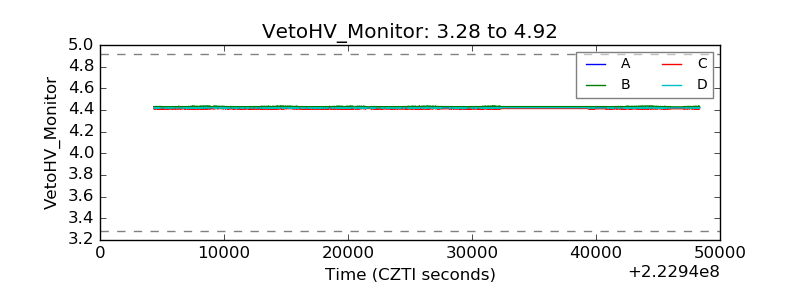 |
| Veto LLD | 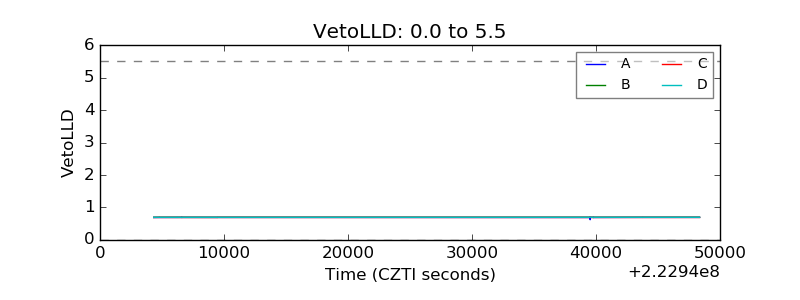 |
| Alpha Counter | 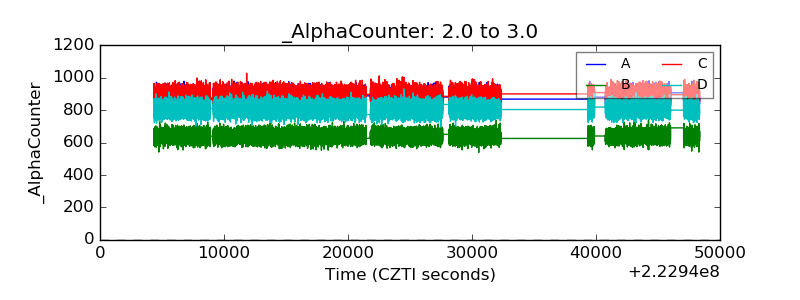 |
| _CPM_Rate | 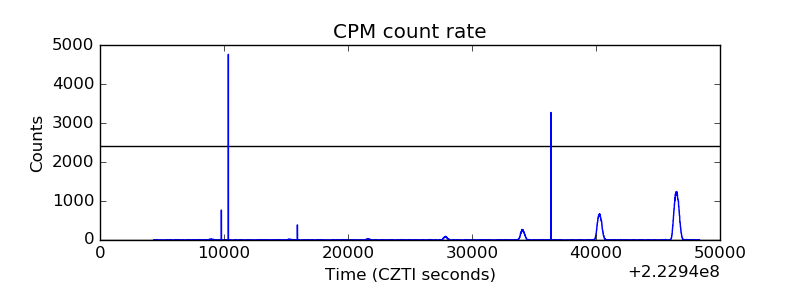 |
| CZT Counter | 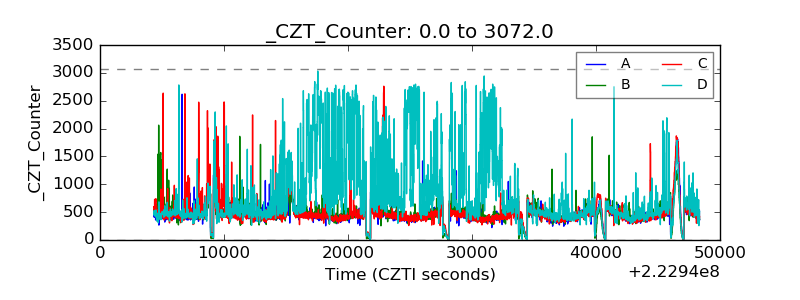 |
| +2.5 Volts monitor |  |
| +5 Volts monitor |  |
| _ROLL_ROT | 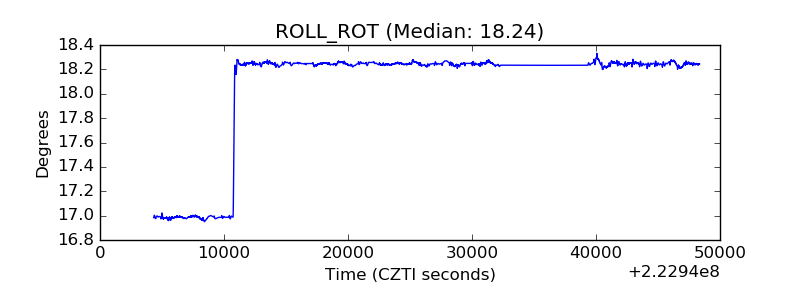 |
| _Roll_DEC | 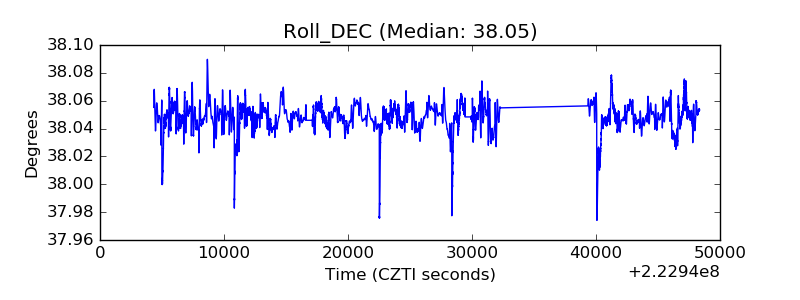 |
| _Roll_RA | 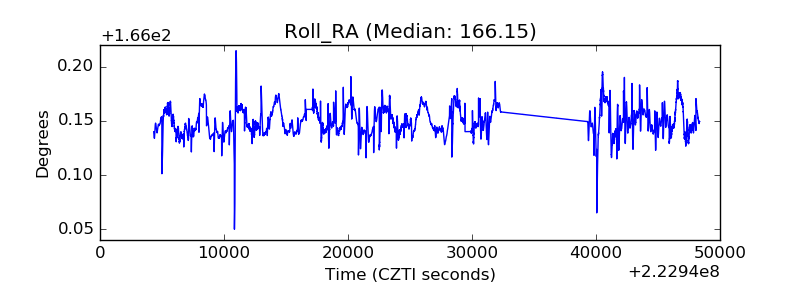 |
| Veto Counter | 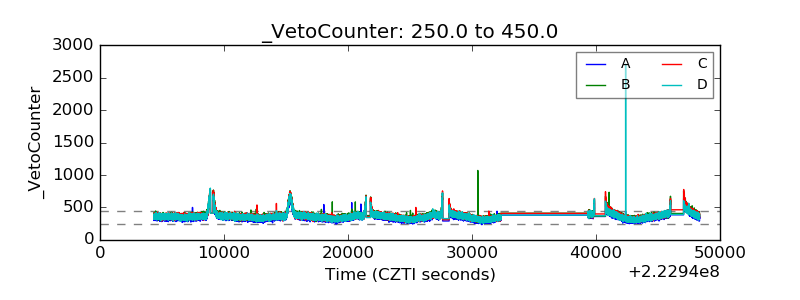 |