| Param | Original file | Final file |
|---|---|---|
| Filename | modeM0/AS1G06_102T01_9000000978_07177cztM0_level2.evt | modeM0/AS1G06_102T01_9000000978_07177cztM0_level2_quad_clean.evt |
| Size (bytes) | 536,279,040 | 91,854,720 |
| Size | 511.4 MB | 87.6 MB |
| Events in quadrant A | 3,792,726 | 583,612 |
| Events in quadrant B | 3,308,222 | 610,071 |
| Events in quadrant C | 3,101,490 | 592,803 |
| Events in quadrant D | 5,588,988 | 532,286 |
| Mode M0 | |||
|---|---|---|---|
| Quadrant | BADHDUFLAG | Total packets | Discarded packets |
| A | 0 | 15678 | 4 |
| B | 0 | 14391 | 3 |
| C | 0 | 13829 | 3 |
| D | 0 | 21064 | 3 |
| Mode SS | |||
|---|---|---|---|
| Quadrant | BADHDUFLAG | Total packets | Discarded packets |
| A | 0 | 138 | 0 |
| B | 0 | 138 | 0 |
| C | 0 | 138 | 0 |
| D | 0 | 138 | 0 |
| Mode M9 | |||
|---|---|---|---|
| Quadrant | BADHDUFLAG | Total packets | Discarded packets |
| A | 0 | 24 | 0 |
| B | 0 | 24 | 0 |
| C | 0 | 24 | 0 |
| D | 0 | 24 | 0 |
| Quadrant | Total seconds | Saturated seconds | Saturation percentage |
|---|---|---|---|
| A | 6632 | 54 | 0.814234% |
| B | 6632 | 55 | 0.829312% |
| C | 6632 | 28 | 0.422195% |
| D | 6632 | 478 | 7.207479% |
Noise dominated data is calculated using 1-second bins in cleaned event files. If a bin has >2000 counts, and if more than 50% of those come from <1% of pixels, then it is considered to be noise-dominated and hence unusable.
| Quadrant | # 1 sec bins | Bins with >0 counts | Bins with >2000 counts | High rate bins dominated by noise | Noise dominated (total time) | Noise dominated (detector-on time) | Marked lightcurve |
|---|---|---|---|---|---|---|---|
| A | 9072 | 6635 | 5 | 5 | 0.06% | 0.08% | 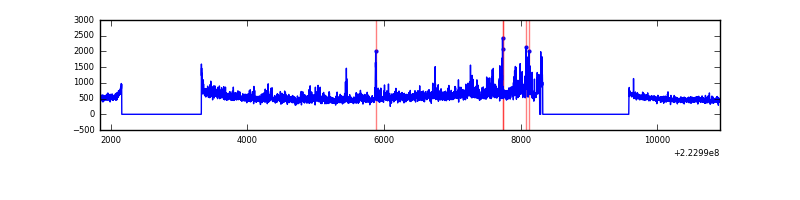 |
| B | 9072 | 6634 | 3 | 3 | 0.03% | 0.05% | 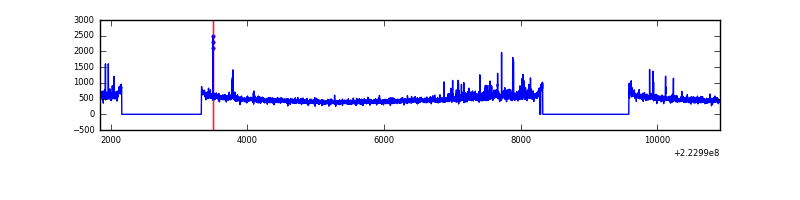 |
| C | 9072 | 6635 | 0 | 0 | 0.00% | 0.00% | 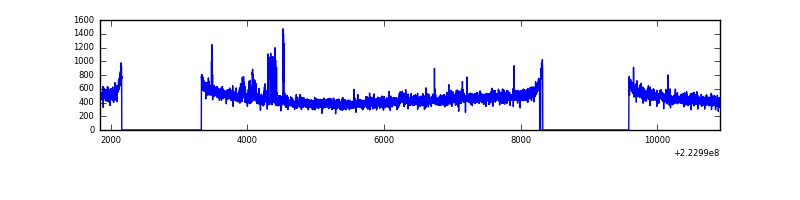 |
| D | 9072 | 6635 | 455 | 455 | 5.02% | 6.86% | 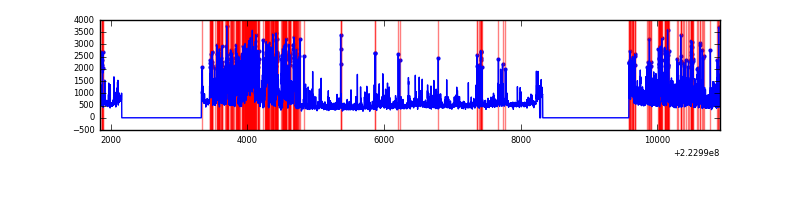 |
Top three noisy pixels from each quadrant. If the there are fewer than three noisy pixels in the level2.evt file, extra rows are filled as -1
| Pixel properties | Quadrant properties | ||||||
|---|---|---|---|---|---|---|---|
| Quadrant | DetID | PixID | Counts | Sigma | Mean | Median | Sigma |
| A | 8 | 15 | 706947 | 4394.18 | 788 | 773 | 160.7 |
| A | 14 | 238 | 42816 | 261.61 | 788 | 773 | 160.7 |
| A | 3 | 1 | 7719 | 43.22 | 788 | 773 | 160.7 |
| B | 0 | 214 | 104398 | 679.9 | 805 | 786 | 152.4 |
| B | 0 | 219 | 33223 | 212.85 | 805 | 786 | 152.4 |
| B | 15 | 204 | 25890 | 164.73 | 805 | 786 | 152.4 |
| C | 9 | 68 | 76282 | 423.03 | 773 | 774 | 178.5 |
| C | 10 | 22 | 9690 | 49.95 | 773 | 774 | 178.5 |
| C | 13 | 61 | 6082 | 29.74 | 773 | 774 | 178.5 |
| D | 12 | 233 | 1470165 | 8106.32 | 745 | 720 | 181.3 |
| D | 2 | 216 | 778527 | 4290.84 | 745 | 720 | 181.3 |
| D | 8 | 195 | 238626 | 1312.43 | 745 | 720 | 181.3 |
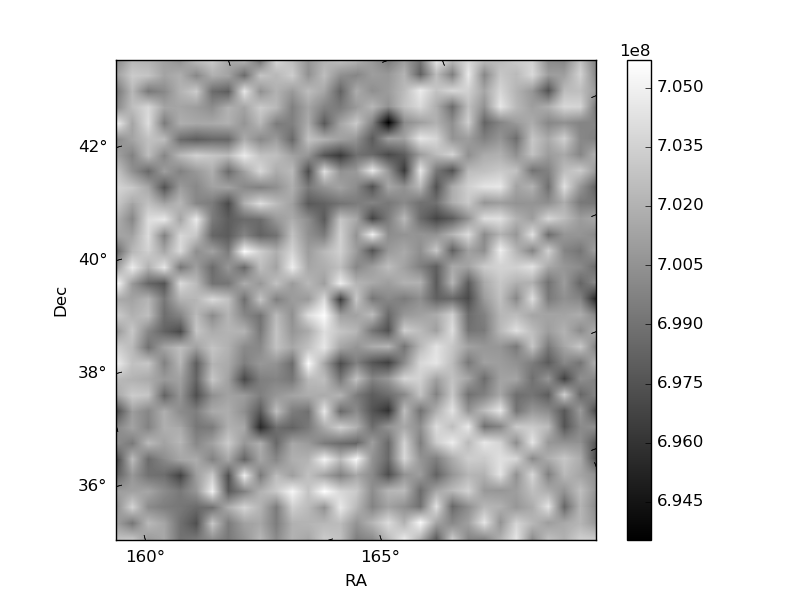
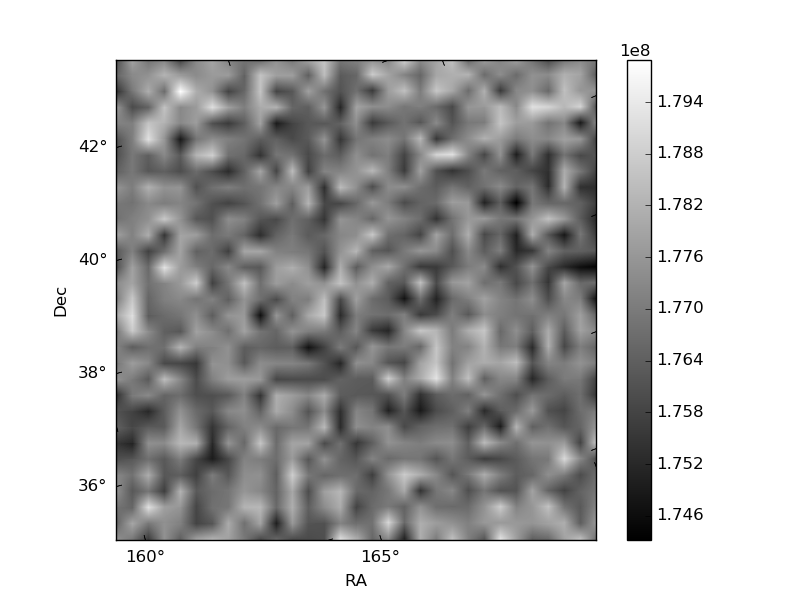
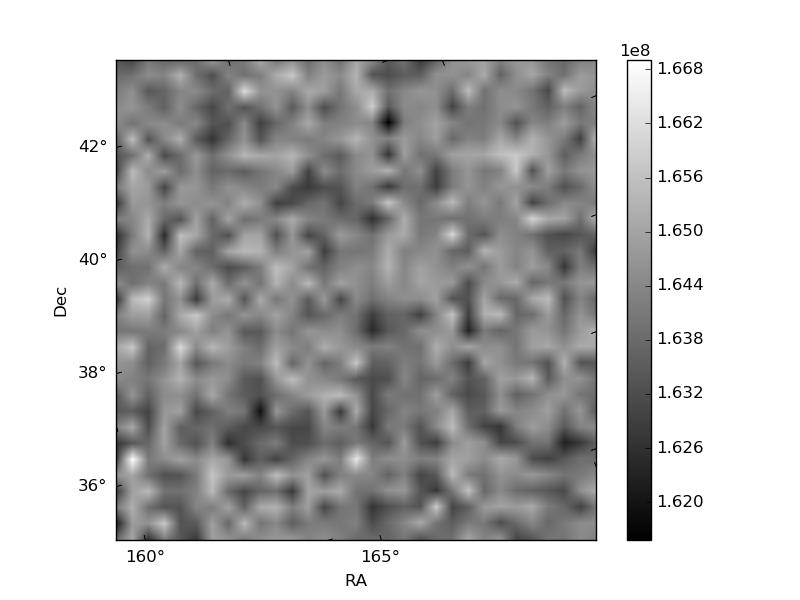
Histogram calculated using DETX and DETY for each event in the final _common_clean file
| Quadrant A | 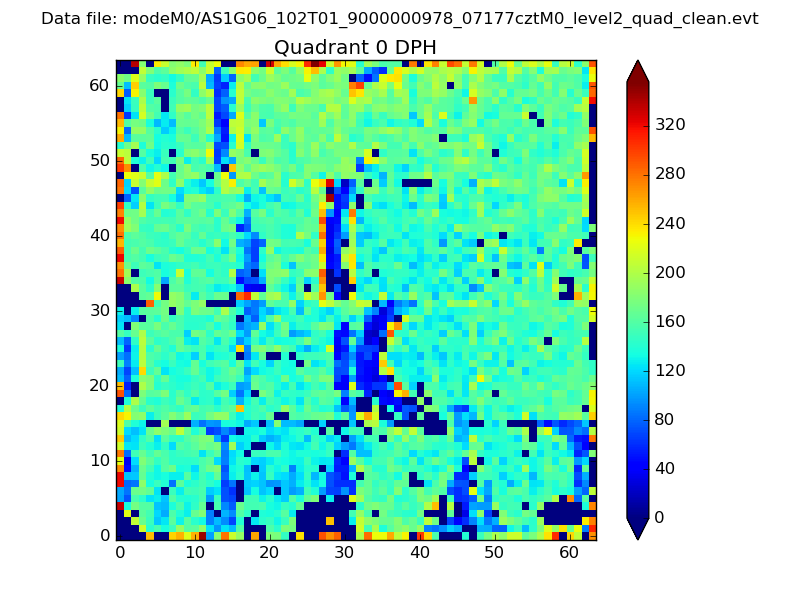 |
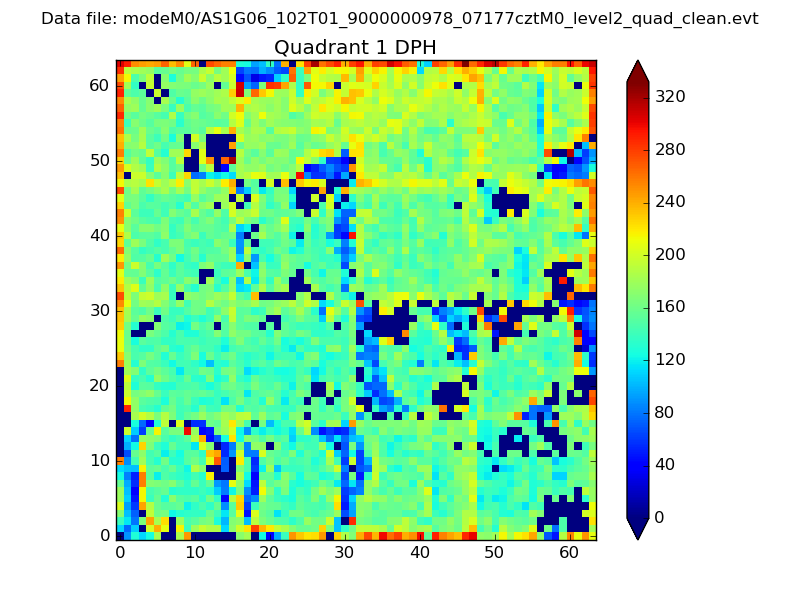 |
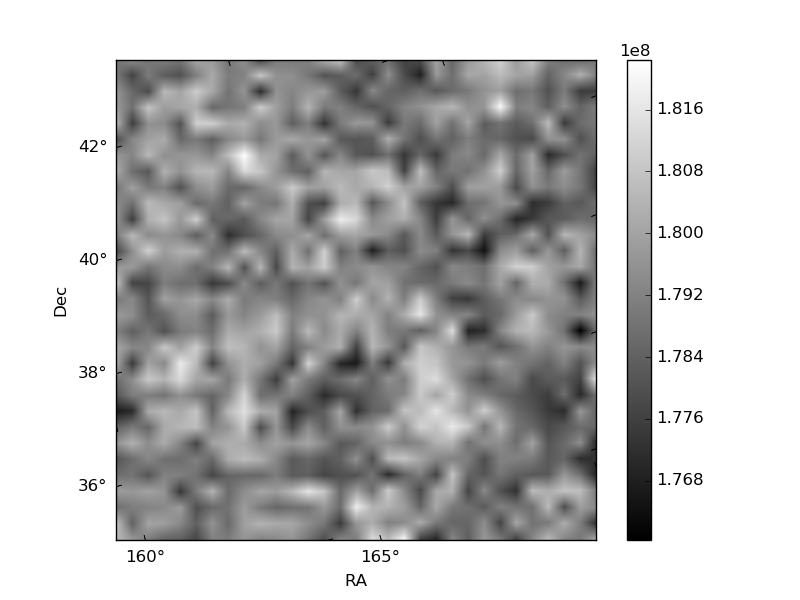
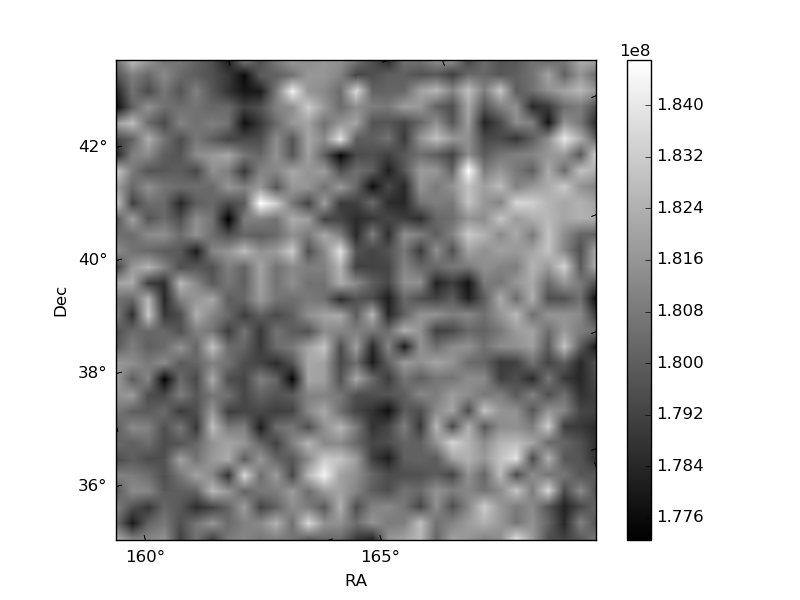
Quadrant B |
|---|---|---|---|
| Quadrant D | 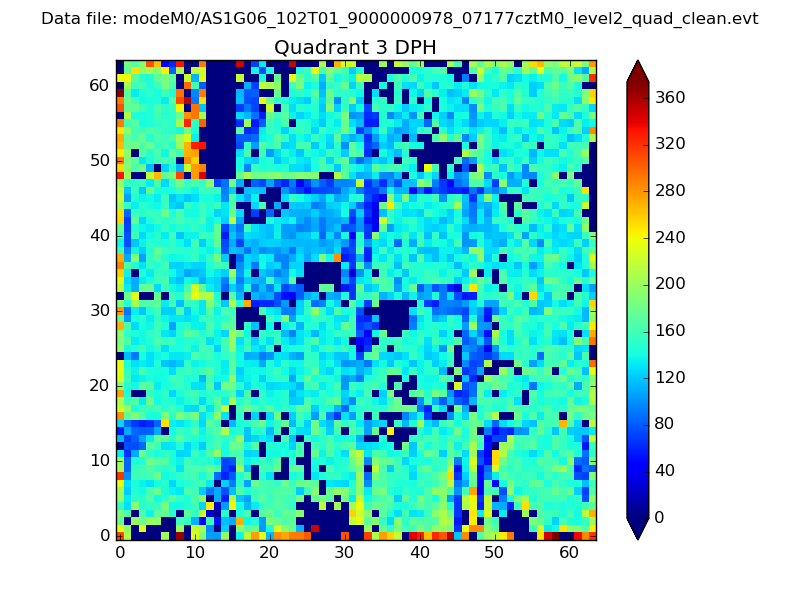 |
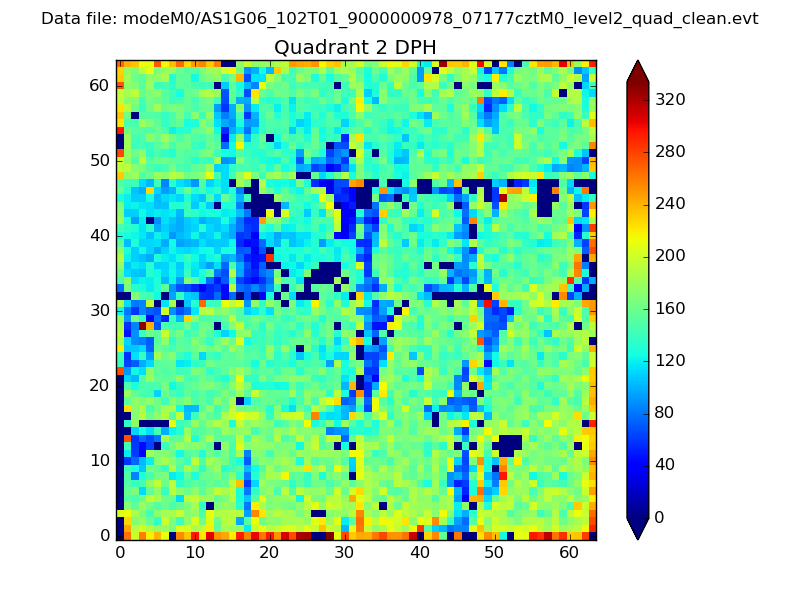 |
Quadrant C |
| Plot type | Count rate plots | Images |
|---|---|---|
| Comparison with Poisson distribution Blue bars denote a histogram of data divided into 1 sec bins. Red curve is a Poisson curve with rate = median count rate of data. |
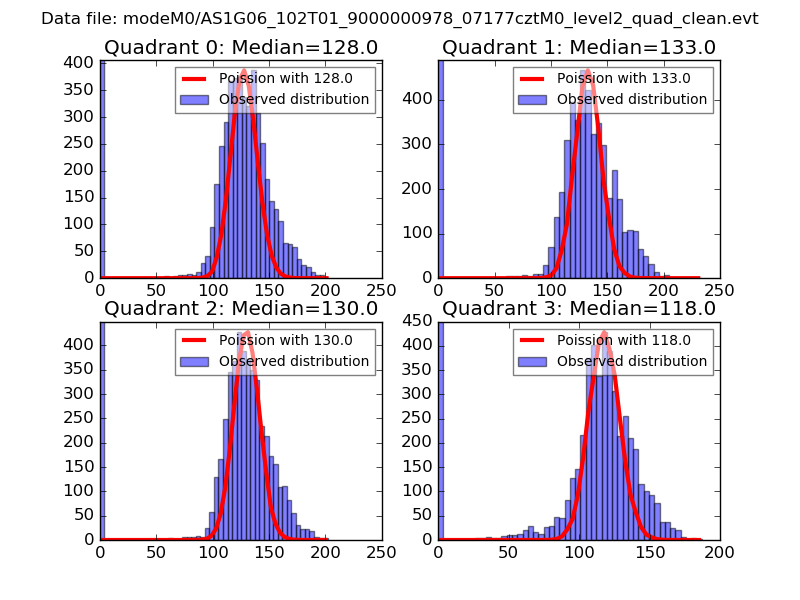 |
 |
| Quadrant-wise count rates Data is divided into 100 sec bins |
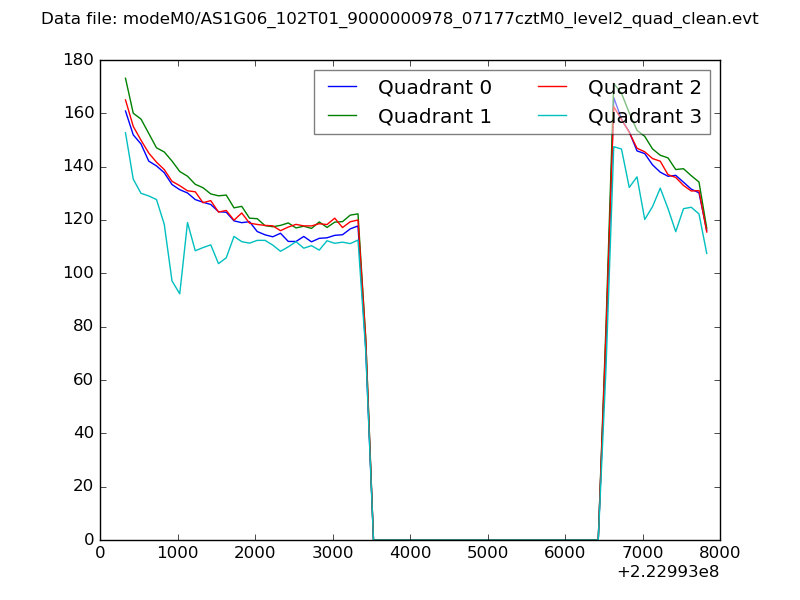 |
|
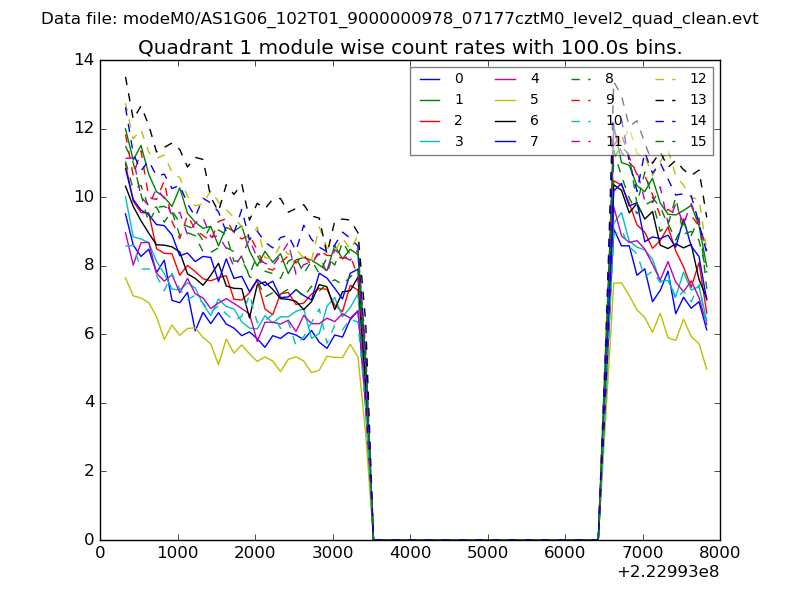
| Module-wise count rates for Quadrant A Data is divided into 100 sec bins |
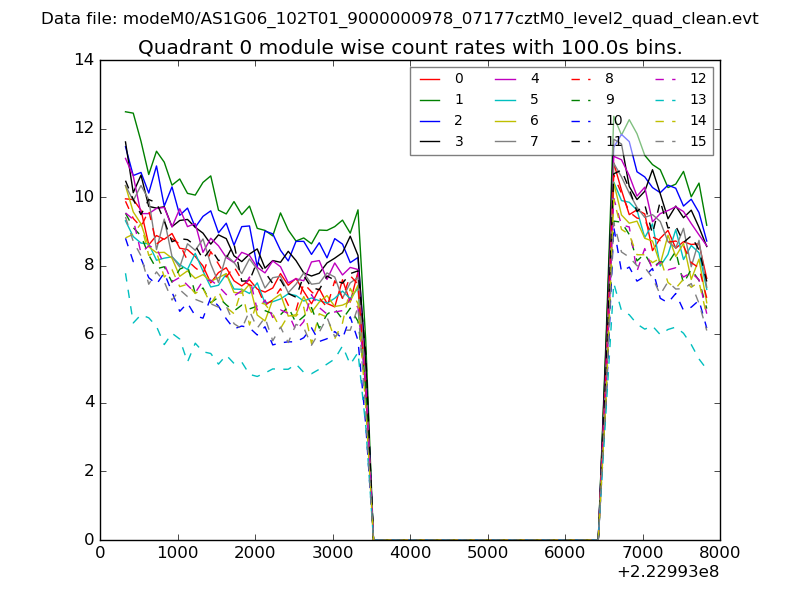 |
 |
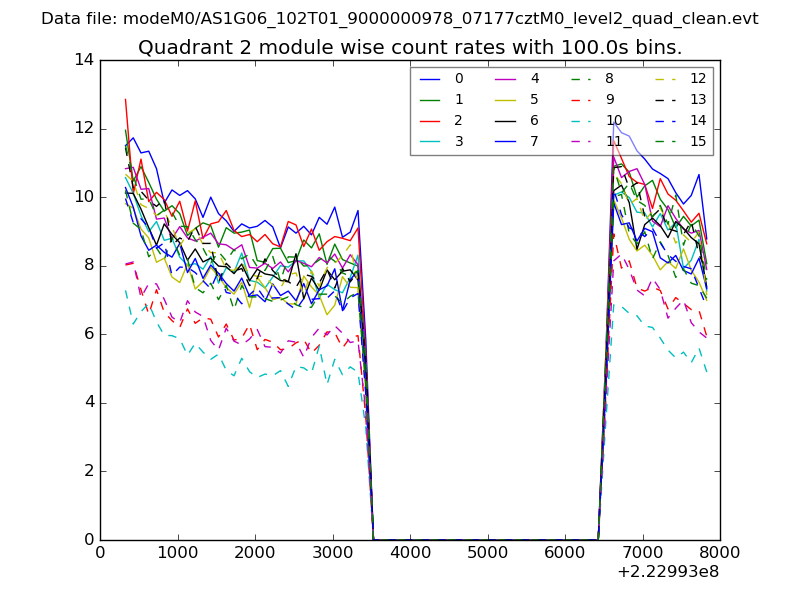
| Module-wise count rates for Quadrant B Data is divided into 100 sec bins |
 |
 |
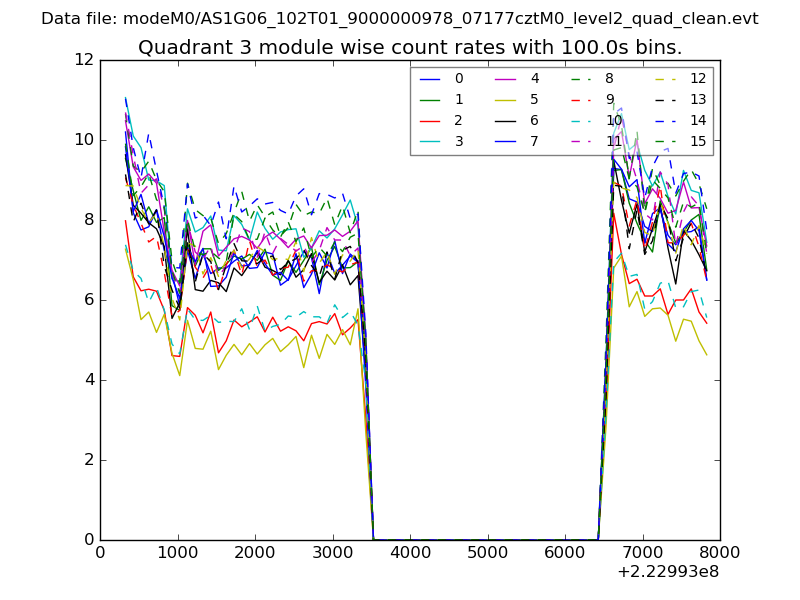
| Module-wise count rates for Quadrant C Data is divided into 100 sec bins |
 |
 |
| Module-wise count rates for Quadrant D Data is divided into 100 sec bins |
 |
 |
| Parameter | Plot |
|---|---|
| CZT HV Monitor | 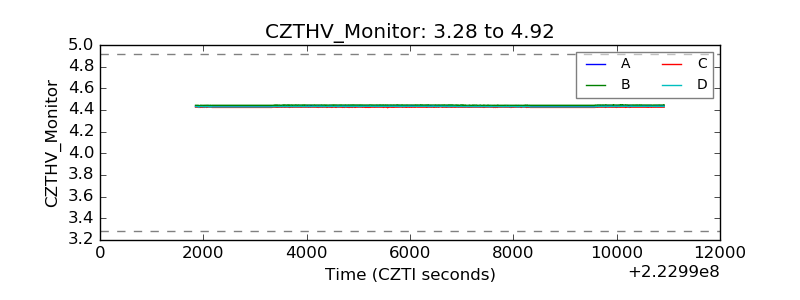 |
| D_VDD | 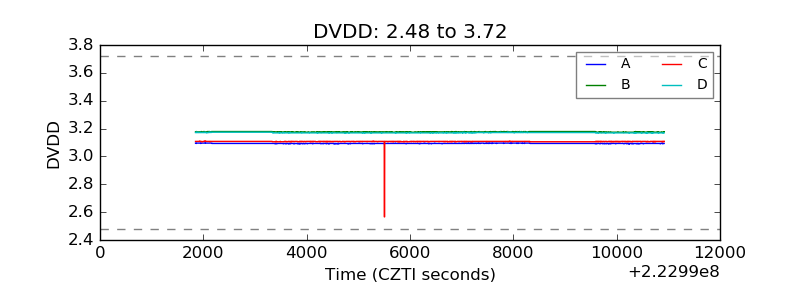 |
| Temperature 1 | 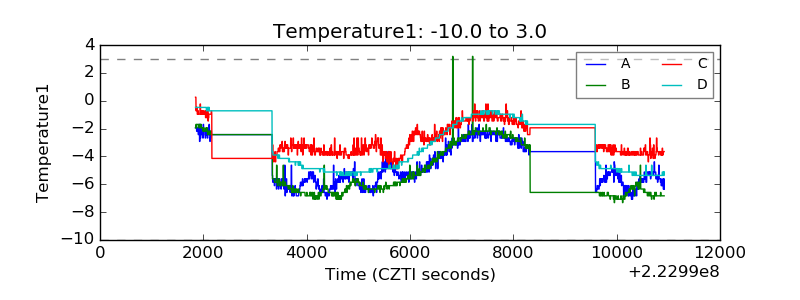 |
| Veto HV Monitor |  |
| Veto LLD | 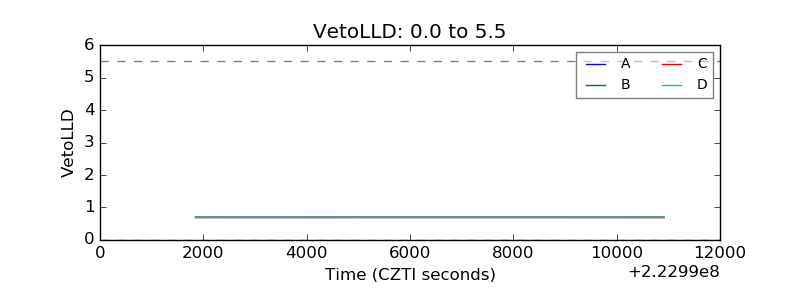 |
| Alpha Counter | 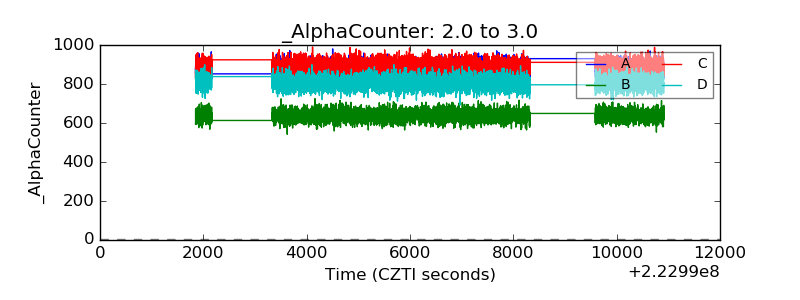 |
| _CPM_Rate | 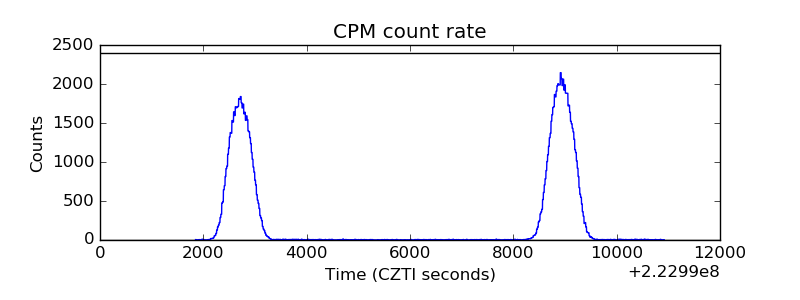 |
| CZT Counter | 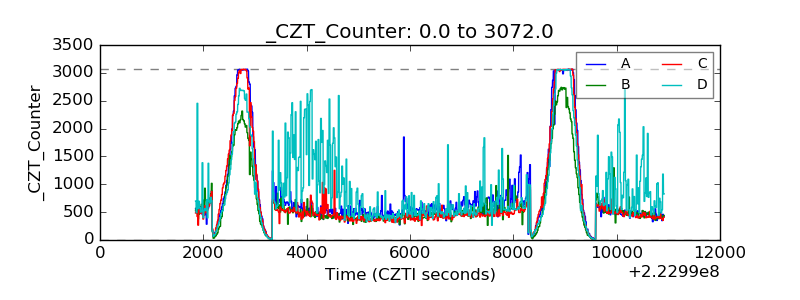 |
| +2.5 Volts monitor |  |
| +5 Volts monitor |  |
| _ROLL_ROT | 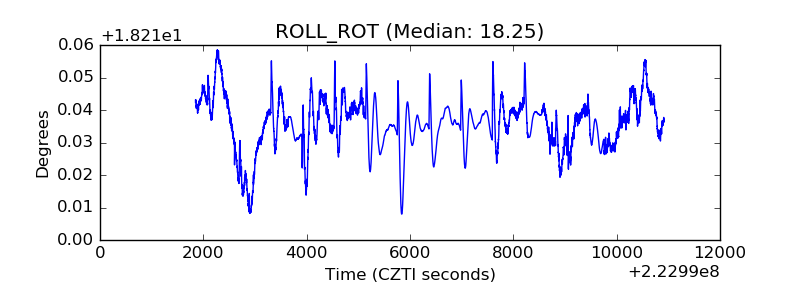 |
| _Roll_DEC | 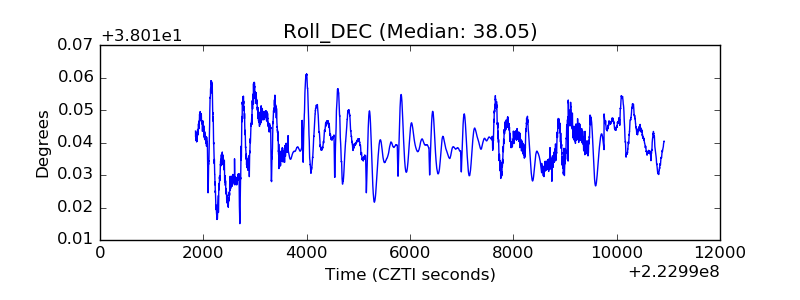 |
| _Roll_RA | 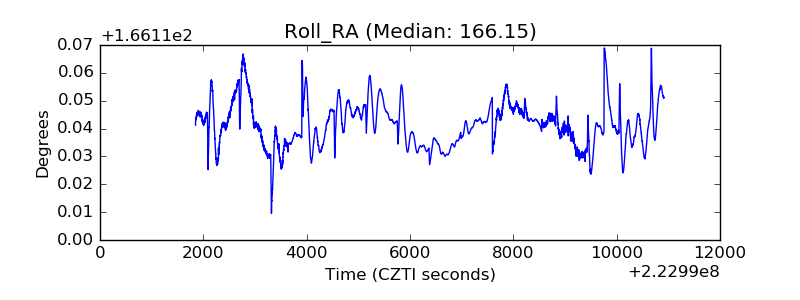 |
| Veto Counter | 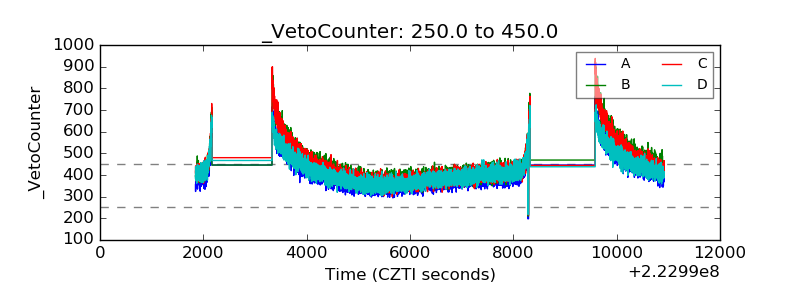 |