| Param | Original file | Final file |
|---|---|---|
| Filename | modeM0/AS1G06_102T01_9000000978_07179cztM0_level2.evt | modeM0/AS1G06_102T01_9000000978_07179cztM0_level2_quad_clean.evt |
| Size (bytes) | 368,919,360 | 69,632,640 |
| Size | 351.8 MB | 66.4 MB |
| Events in quadrant A | 2,744,112 | 436,876 |
| Events in quadrant B | 2,632,312 | 451,225 |
| Events in quadrant C | 2,465,868 | 437,005 |
| Events in quadrant D | 2,971,135 | 413,631 |
| Mode M0 | |||
|---|---|---|---|
| Quadrant | BADHDUFLAG | Total packets | Discarded packets |
| A | 0 | 11481 | 2 |
| B | 0 | 11143 | 2 |
| C | 0 | 10940 | 2 |
| D | 0 | 12325 | 2 |
| Mode SS | |||
|---|---|---|---|
| Quadrant | BADHDUFLAG | Total packets | Discarded packets |
| A | 0 | 108 | 0 |
| B | 0 | 108 | 0 |
| C | 0 | 108 | 0 |
| D | 0 | 108 | 0 |
| Mode M9 | |||
|---|---|---|---|
| Quadrant | BADHDUFLAG | Total packets | Discarded packets |
| A | 0 | 14 | 0 |
| B | 0 | 14 | 0 |
| C | 0 | 14 | 0 |
| D | 0 | 15 | 0 |
| Quadrant | Total seconds | Saturated seconds | Saturation percentage |
|---|---|---|---|
| A | 5277 | 60 | 1.137010% |
| B | 5277 | 70 | 1.326511% |
| C | 5277 | 29 | 0.549555% |
| D | 5277 | 92 | 1.743415% |
Noise dominated data is calculated using 1-second bins in cleaned event files. If a bin has >2000 counts, and if more than 50% of those come from <1% of pixels, then it is considered to be noise-dominated and hence unusable.
| Quadrant | # 1 sec bins | Bins with >0 counts | Bins with >2000 counts | High rate bins dominated by noise | Noise dominated (total time) | Noise dominated (detector-on time) | Marked lightcurve |
|---|---|---|---|---|---|---|---|
| A | 6562 | 5278 | 3 | 3 | 0.05% | 0.06% | 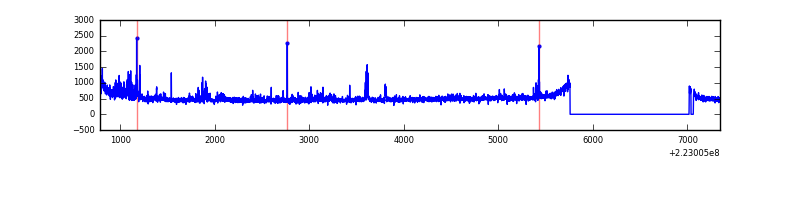 |
| B | 6562 | 5278 | 0 | 0 | 0.00% | 0.00% | 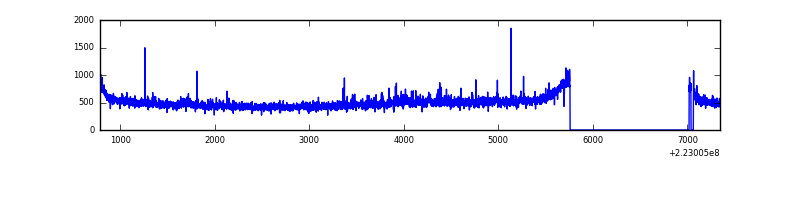 |
| C | 6562 | 5279 | 0 | 0 | 0.00% | 0.00% | 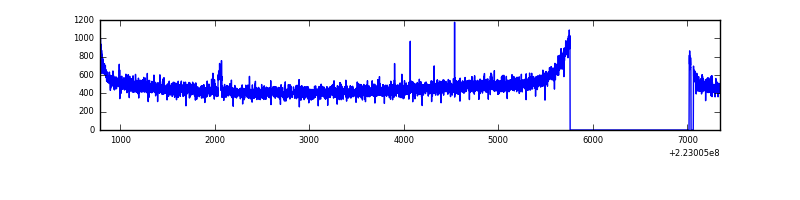 |
| D | 6562 | 5278 | 43 | 43 | 0.66% | 0.81% | 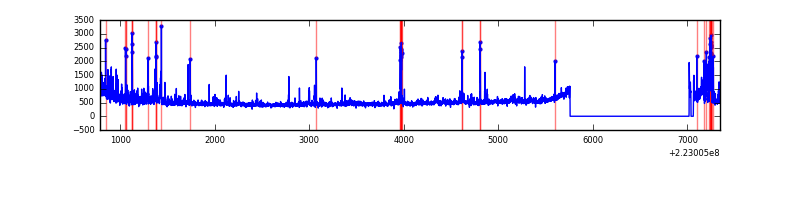 |
Top three noisy pixels from each quadrant. If the there are fewer than three noisy pixels in the level2.evt file, extra rows are filled as -1
| Pixel properties | Quadrant properties | ||||||
|---|---|---|---|---|---|---|---|
| Quadrant | DetID | PixID | Counts | Sigma | Mean | Median | Sigma |
| A | 8 | 15 | 186542 | 1414.85 | 653 | 640 | 131.4 |
| A | 14 | 238 | 32342 | 241.27 | 653 | 640 | 131.4 |
| A | 15 | 174 | 7526 | 52.41 | 653 | 640 | 131.4 |
| B | 0 | 214 | 29630 | 233.25 | 657 | 643 | 124.3 |
| B | 15 | 204 | 28115 | 221.05 | 657 | 643 | 124.3 |
| B | 0 | 219 | 13061 | 99.92 | 657 | 643 | 124.3 |
| C | 10 | 22 | 10427 | 67.55 | 629 | 632 | 145.0 |
| C | 13 | 61 | 4914 | 29.53 | 629 | 632 | 145.0 |
| C | 9 | 68 | 2577 | 13.41 | 629 | 632 | 145.0 |
| D | 2 | 216 | 279392 | 1818.64 | 628 | 608 | 153.3 |
| D | 8 | 195 | 147664 | 959.32 | 628 | 608 | 153.3 |
| D | 2 | 14 | 128821 | 836.39 | 628 | 608 | 153.3 |
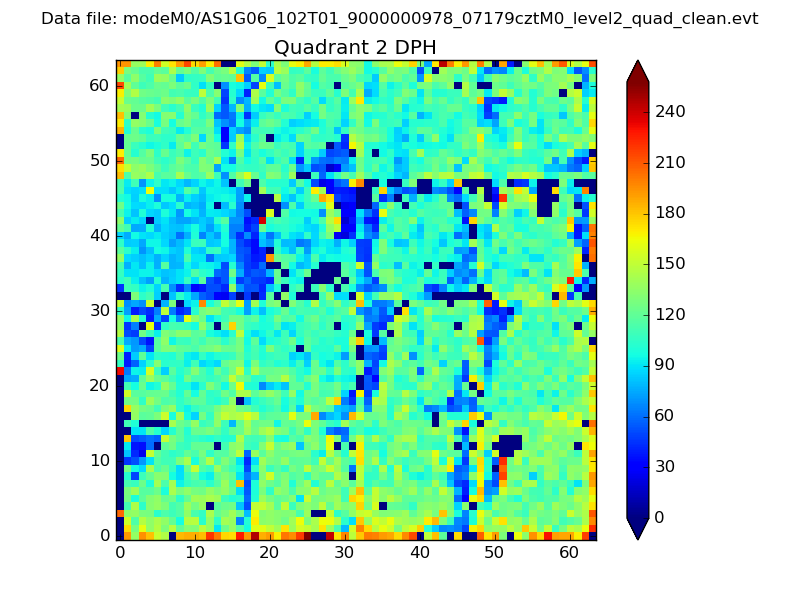
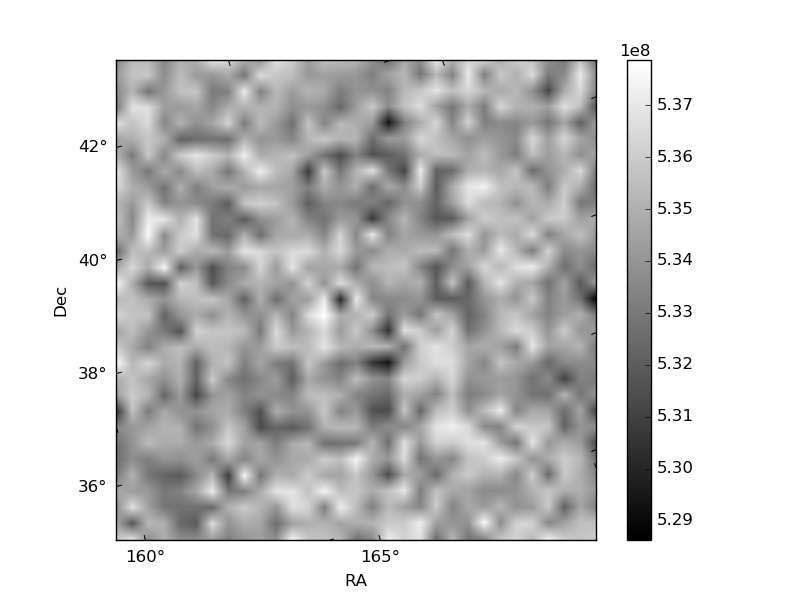
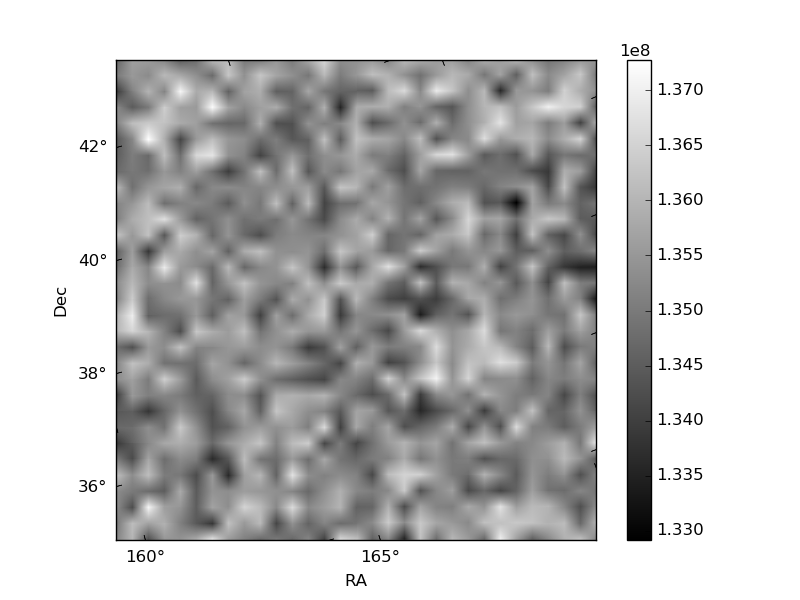
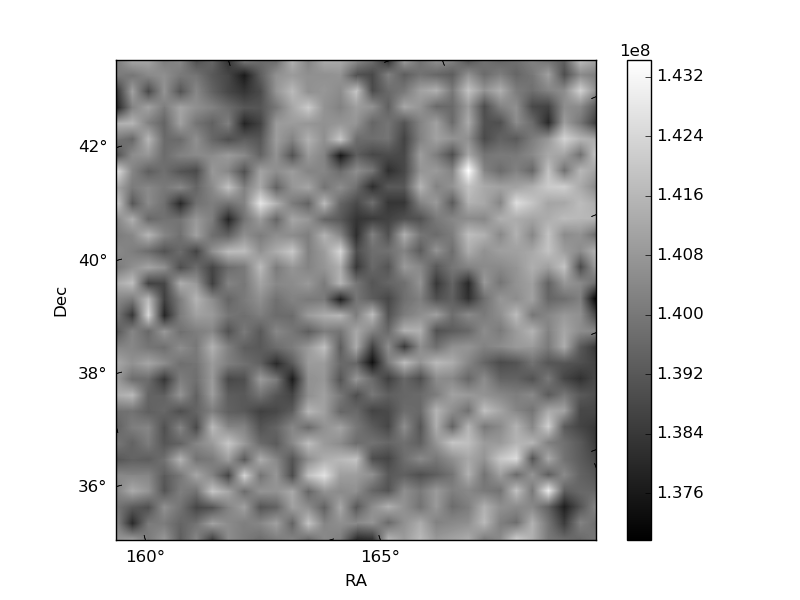
Histogram calculated using DETX and DETY for each event in the final _common_clean file
| Quadrant A | 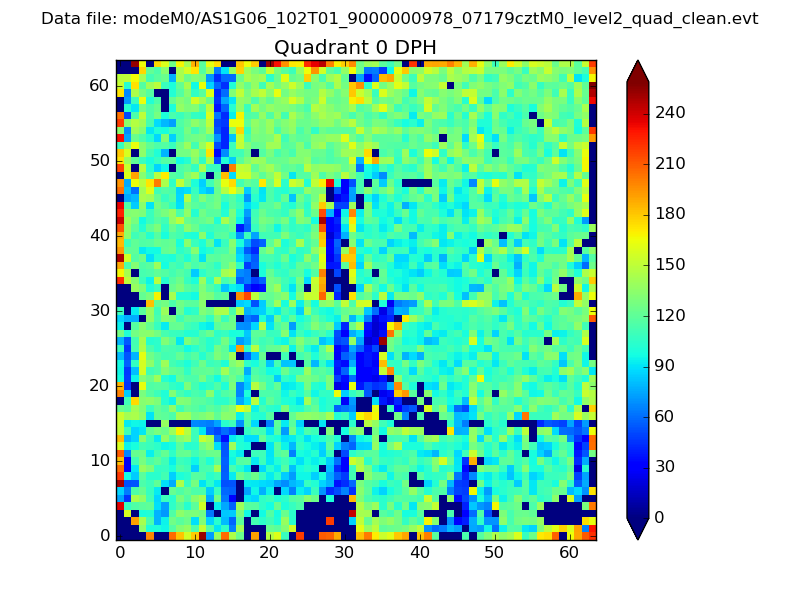 |
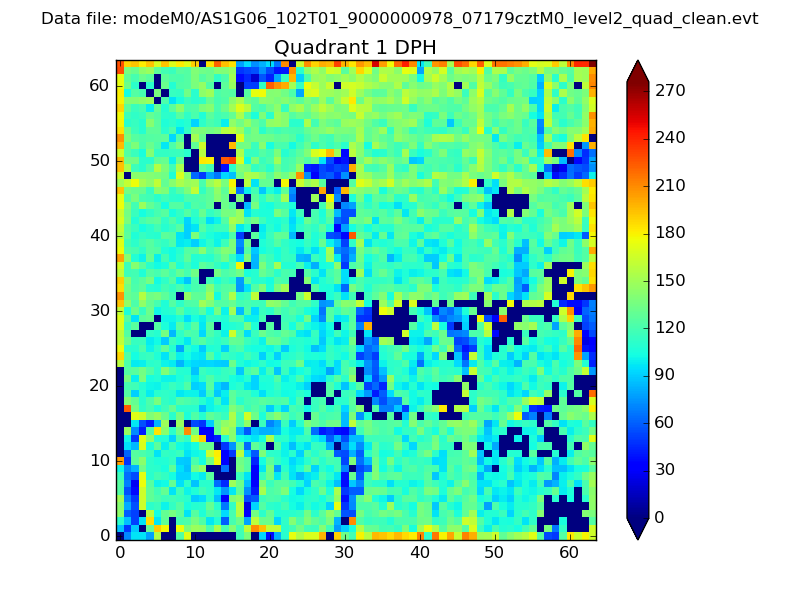 |
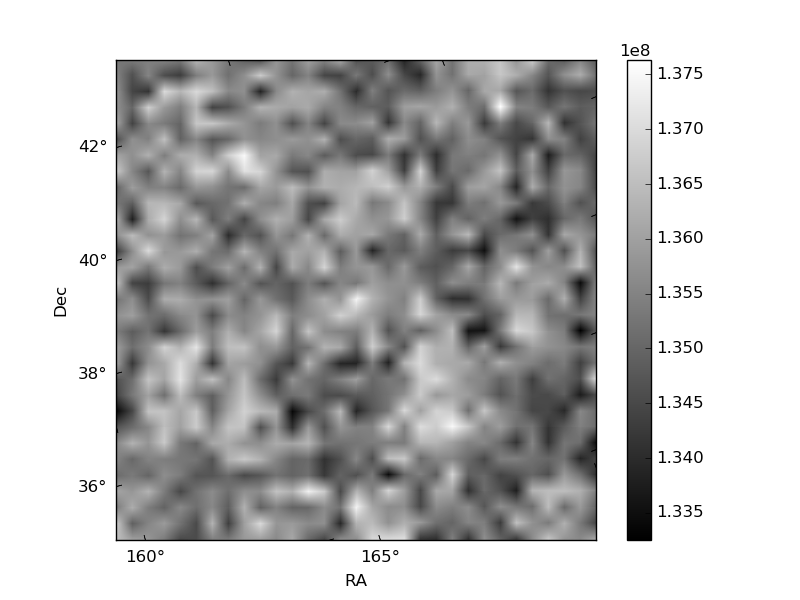
Quadrant B |
|---|---|---|---|
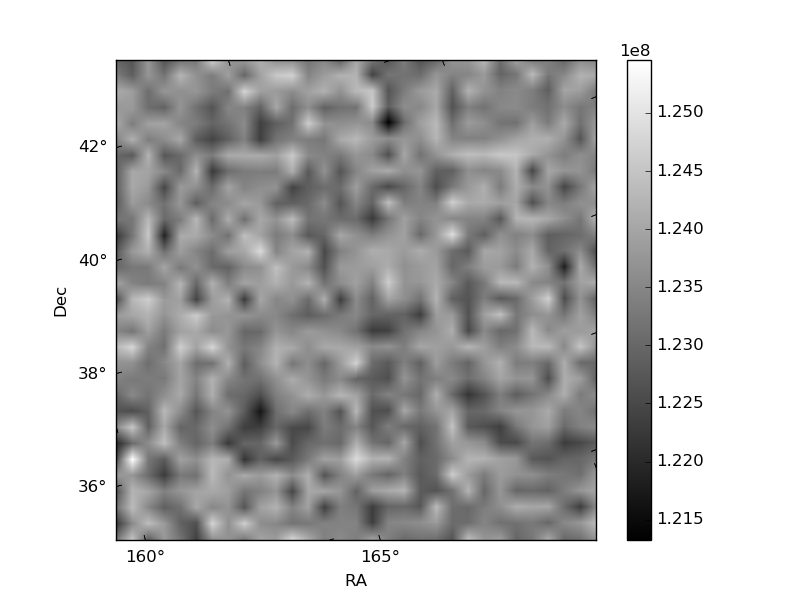
| Quadrant D | 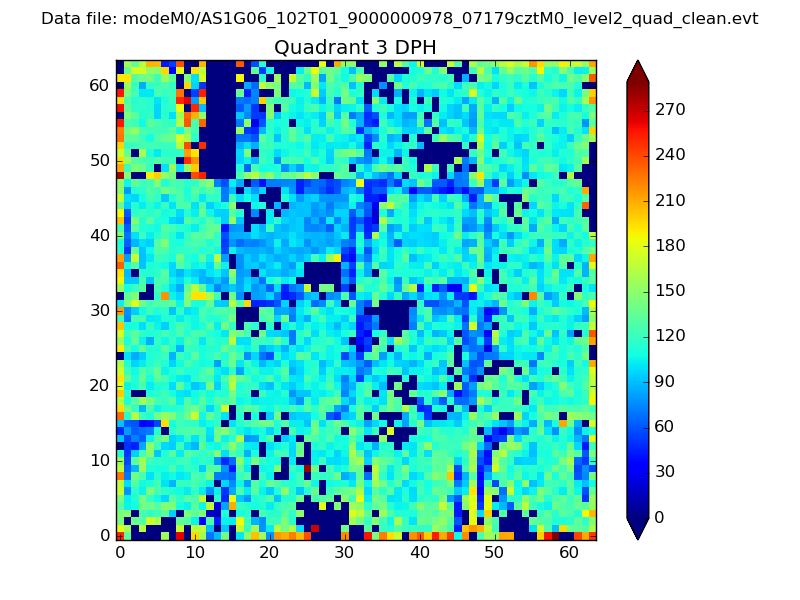 |
 |
Quadrant C |
| Plot type | Count rate plots | Images |
|---|---|---|
| Comparison with Poisson distribution Blue bars denote a histogram of data divided into 1 sec bins. Red curve is a Poisson curve with rate = median count rate of data. |
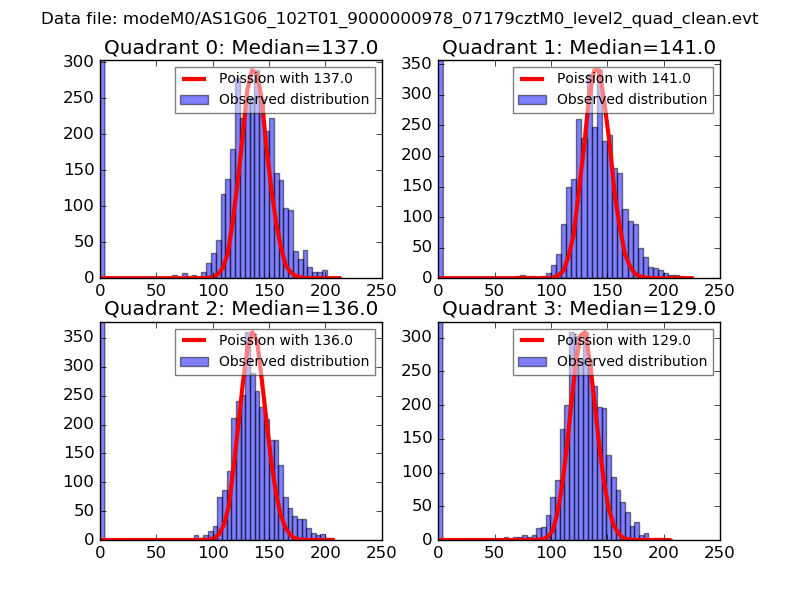 |
 |
| Quadrant-wise count rates Data is divided into 100 sec bins |
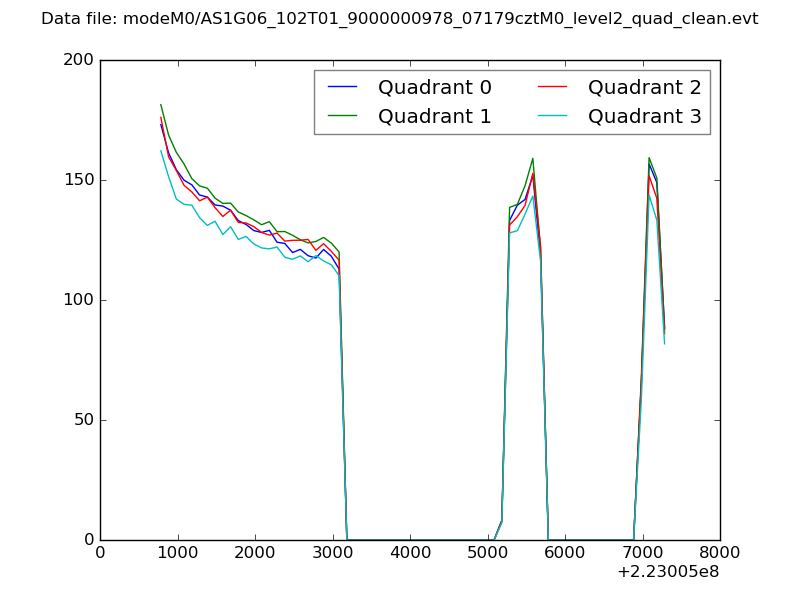 |
|
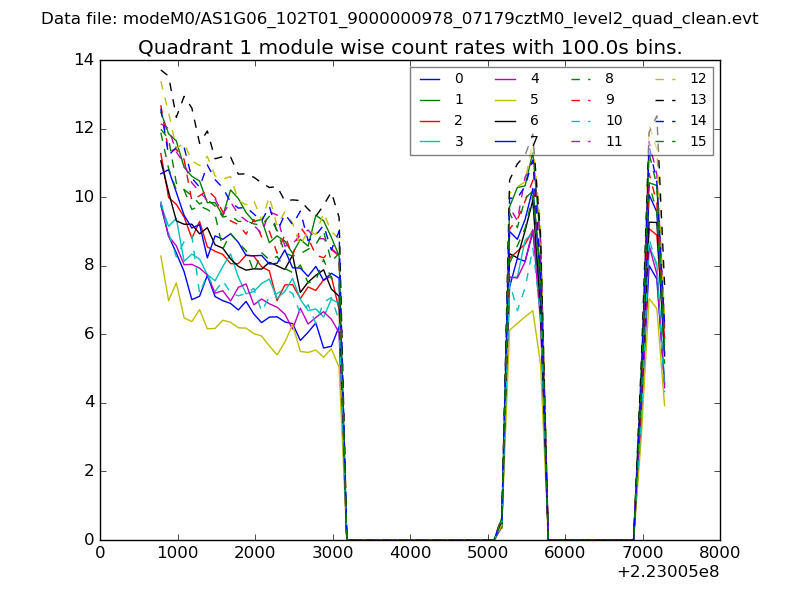
| Module-wise count rates for Quadrant A Data is divided into 100 sec bins |
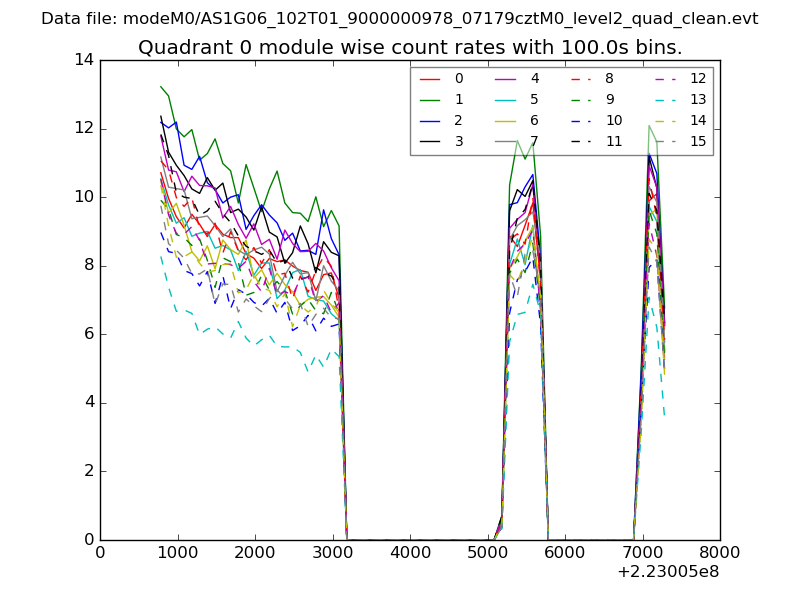 |
 |
| Module-wise count rates for Quadrant B Data is divided into 100 sec bins |
 |
 |
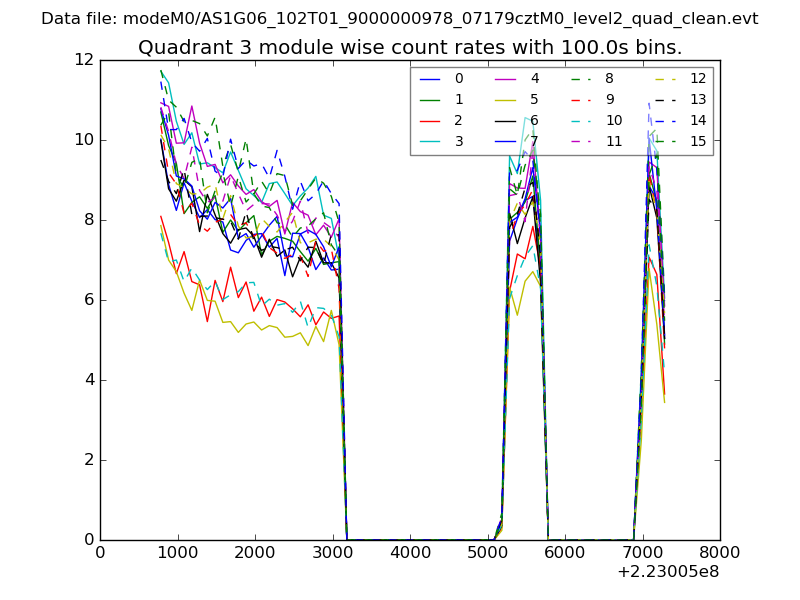
| Module-wise count rates for Quadrant C Data is divided into 100 sec bins |
 |
 |
| Module-wise count rates for Quadrant D Data is divided into 100 sec bins |
 |
 |
| Parameter | Plot |
|---|---|
| CZT HV Monitor | 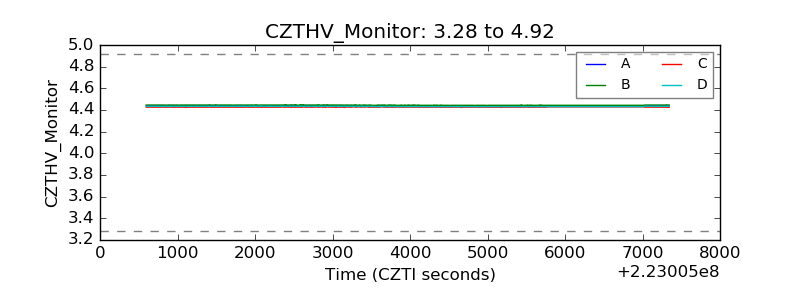 |
| D_VDD | 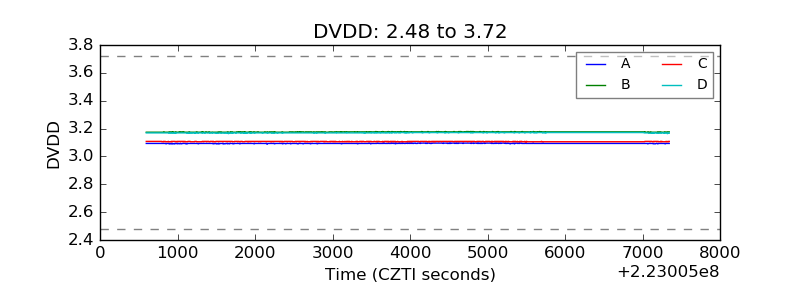 |
| Temperature 1 |  |
| Veto HV Monitor | 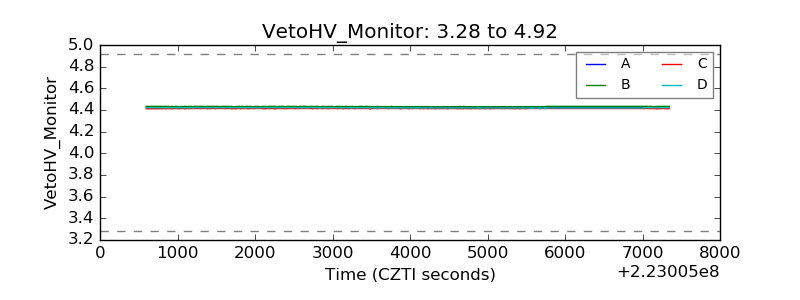 |
| Veto LLD | 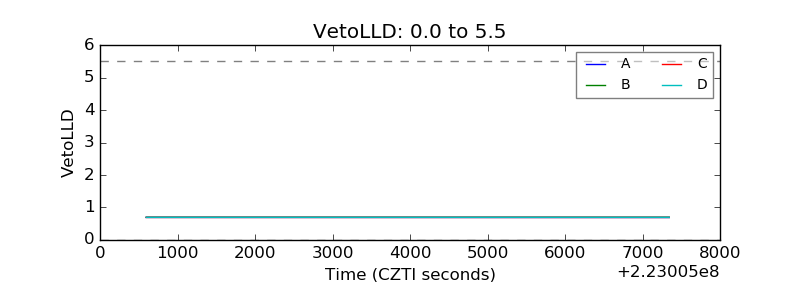 |
| Alpha Counter | 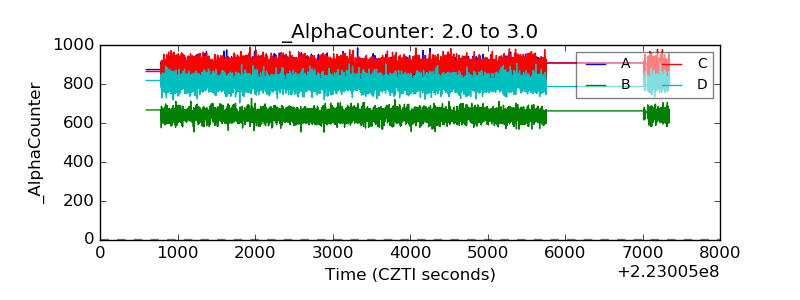 |
| _CPM_Rate | 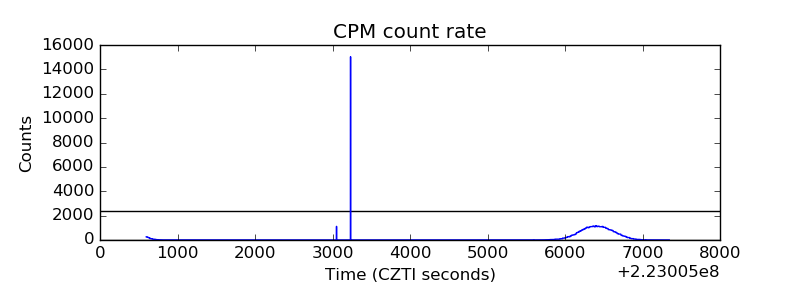 |
| CZT Counter | 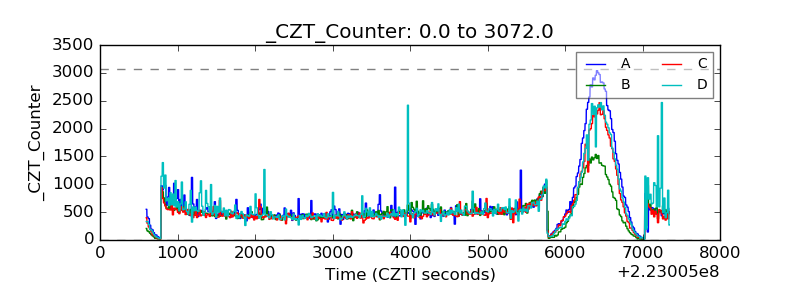 |
| +2.5 Volts monitor |  |
| +5 Volts monitor |  |
| _ROLL_ROT | 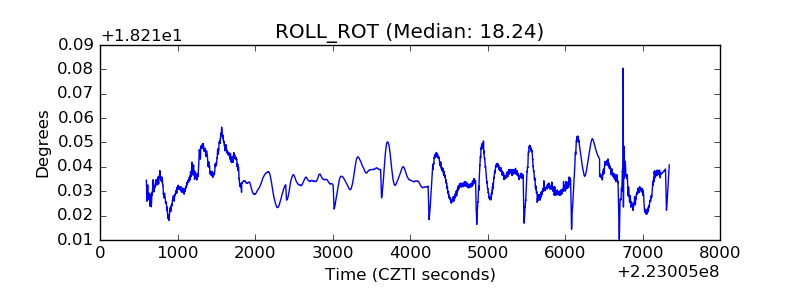 |
| _Roll_DEC | 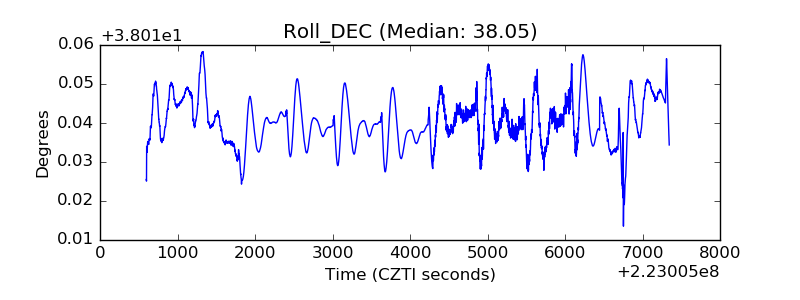 |
| _Roll_RA | 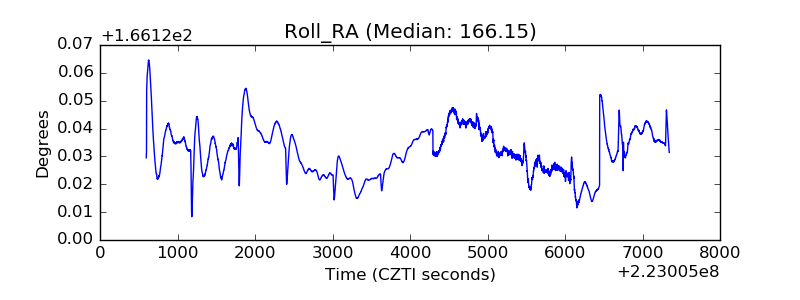 |
| Veto Counter | 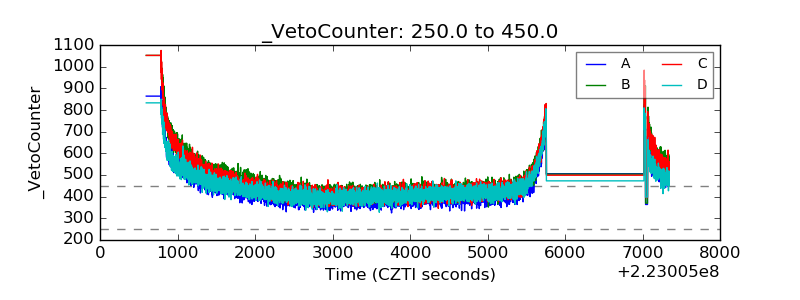 |