| Param | Original file | Final file |
|---|---|---|
| Filename | modeM0/AS1A02_073T02_9000000982cztM0_level2.fits | modeM0/AS1A02_073T02_9000000982cztM0_level2_quad_clean.evt |
| Size (bytes) | 450,506,880 | 410,088,960 |
| Size | 429.6 MB | 391.1 MB |
| Events in quadrant A | 2,712,688 | 2,371,562 |
| Events in quadrant B | 2,632,584 | 2,387,020 |
| Events in quadrant C | 2,699,006 | 2,286,166 |
| Events in quadrant D | 2,281,886 | 2,057,376 |
| Mode M9 | |||
|---|---|---|---|
| Quadrant | BADHDUFLAG | Total packets | Discarded packets |
| A | 0 | 85 | 0 |
| B | 0 | 84 | 0 |
| C | 0 | 84 | 0 |
| D | 0 | 84 | 0 |
| Mode SS | |||
|---|---|---|---|
| Quadrant | BADHDUFLAG | Total packets | Discarded packets |
| A | 0 | 984 | 0 |
| B | 0 | 986 | 0 |
| C | 0 | 984 | 0 |
| D | 0 | 984 | 0 |
| Mode M0 | |||
|---|---|---|---|
| Quadrant | BADHDUFLAG | Total packets | Discarded packets |
| A | 0 | 99974 | 0 |
| B | 0 | 103727 | 0 |
| C | 0 | 100307 | 0 |
| D | 0 | 125304 | 0 |
| Quadrant | Total seconds | Saturated seconds | Saturation percentage |
|---|---|---|---|
| A | 48338 | 732 | 1.514337% |
| B | 48334 | 782 | 1.617909% |
| C | 48330 | 494 | 1.022139% |
| D | 48334 | 1711 | 3.539951% |
Noise dominated data is calculated using 1-second bins in cleaned event files. If a bin has >2000 counts, and if more than 50% of those come from <1% of pixels, then it is considered to be noise-dominated and hence unusable.
| Quadrant | # 1 sec bins | Bins with >0 counts | Bins with >2000 counts | High rate bins dominated by noise | Noise dominated (total time) | Noise dominated (detector-on time) | Marked lightcurve |
|---|---|---|---|---|---|---|---|
| A | 68178 | 48386 | 0 | 0 | 0.00% | 0.00% |  |
| B | 68178 | 48371 | 0 | 0 | 0.00% | 0.00% |  |
| C | 68178 | 48373 | 0 | 0 | 0.00% | 0.00% | 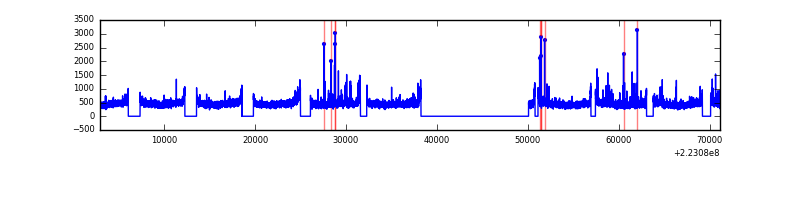 |
| D | 68177 | 48359 | 0 | 0 | 0.00% | 0.00% |  |
Top three noisy pixels from each quadrant. If the there are fewer than three noisy pixels in the level2.evt file, extra rows are filled as -1
| Pixel properties | Quadrant properties | ||||||
|---|---|---|---|---|---|---|---|
| Quadrant | DetID | PixID | Counts | Sigma | Mean | Median | Sigma |
| A | 0 | 29 | 2641 | 10.8 | 705 | 655 | 184.0 |
| A | 7 | 110 | 2290 | 8.89 | 705 | 655 | 184.0 |
| A | 0 | 30 | 2032 | 7.49 | 705 | 655 | 184.0 |
| B | 2 | 9 | 2343 | 11.94 | 694 | 658 | 141.1 |
| B | 5 | 128 | 1844 | 8.4 | 694 | 658 | 141.1 |
| B | 5 | 225 | 1779 | 7.94 | 694 | 658 | 141.1 |
| C | 1 | 80 | 2015 | 7.12 | 712 | 657 | 190.8 |
| C | 1 | 81 | 1987 | 6.97 | 712 | 657 | 190.8 |
| C | 12 | 241 | 1839 | 6.2 | 712 | 657 | 190.8 |
| D | 6 | 231 | 1672 | 6.19 | 652 | 591 | 174.7 |
| D | 4 | 160 | 1609 | 5.83 | 652 | 591 | 174.7 |
| D | 7 | 3 | 1582 | 5.67 | 652 | 591 | 174.7 |
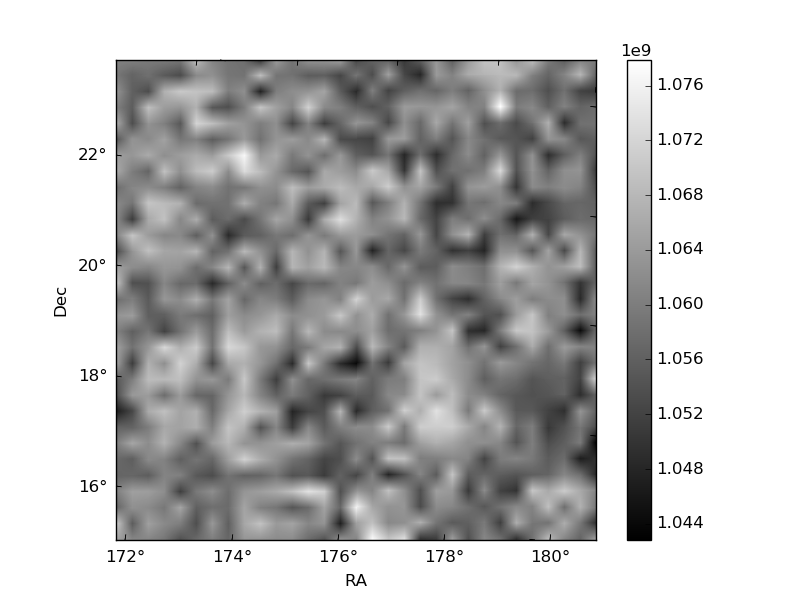
Histogram calculated using DETX and DETY for each event in the final _common_clean file
| Quadrant A | 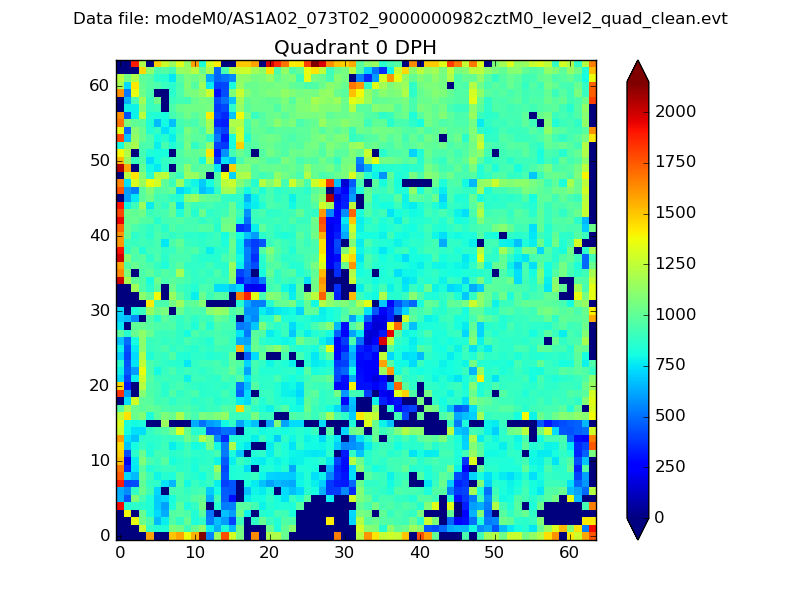 |
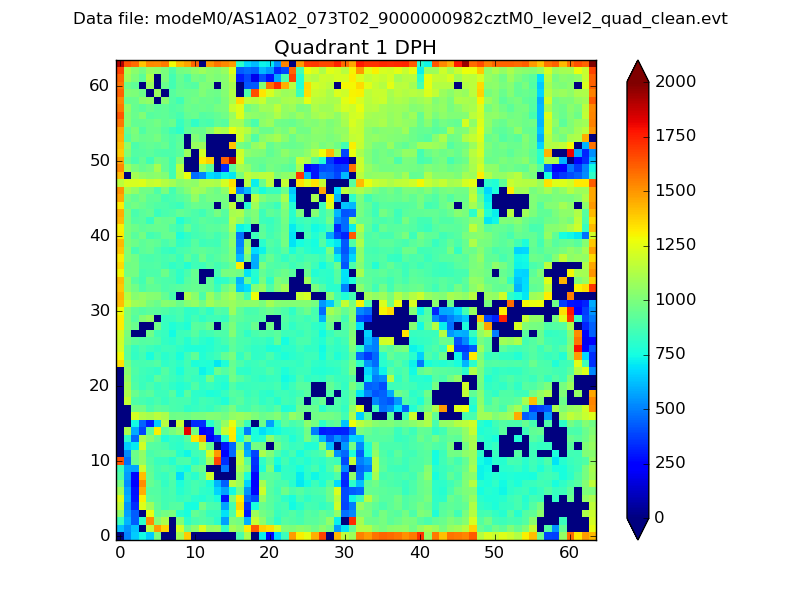 |
Quadrant B |
|---|---|---|---|
| Quadrant D |  |
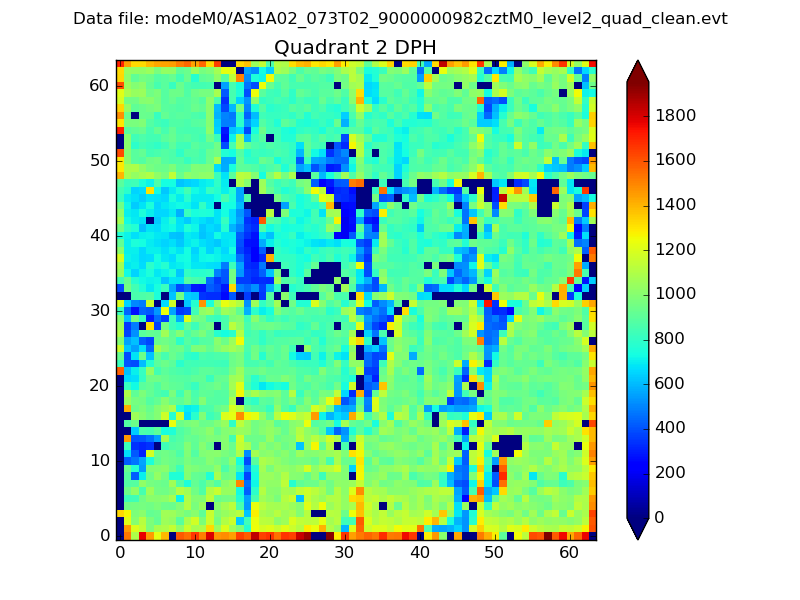 |
Quadrant C |
| Plot type | Count rate plots | Images |
|---|---|---|
| Comparison with Poisson distribution Blue bars denote a histogram of data divided into 1 sec bins. Red curve is a Poisson curve with rate = median count rate of data. |
 |
 |
| Quadrant-wise count rates Data is divided into 100 sec bins |
 |
|
| Module-wise count rates for Quadrant A Data is divided into 100 sec bins |
 |
 |
| Module-wise count rates for Quadrant B Data is divided into 100 sec bins |
 |
 |
| Module-wise count rates for Quadrant C Data is divided into 100 sec bins |
 |
 |
| Module-wise count rates for Quadrant D Data is divided into 100 sec bins |
 |
 |
| Parameter | Plot |
|---|---|
| CZT HV Monitor |  |
| D_VDD | 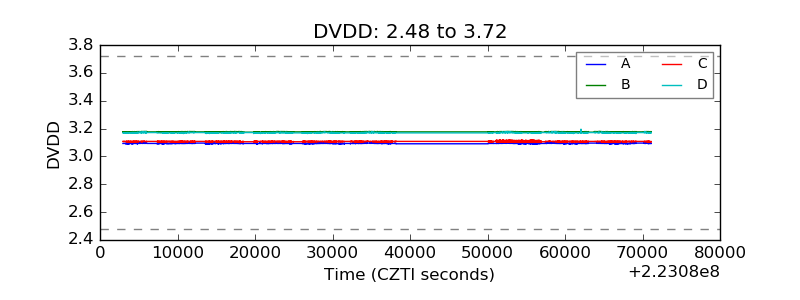 |
| Temperature 1 |  |
| Veto HV Monitor |  |
| Veto LLD |  |
| Alpha Counter |  |
| _CPM_Rate |  |
| CZT Counter |  |
| +2.5 Volts monitor |  |
| +5 Volts monitor |  |
| _ROLL_ROT |  |
| _Roll_DEC |  |
| _Roll_RA |  |
| Veto Counter |  |