| Param | Original file | Final file |
|---|---|---|
| Filename | modeM0/AS1A02_073T02_9000000982_07192cztM0_level2.evt | modeM0/AS1A02_073T02_9000000982_07192cztM0_level2_quad_clean.evt |
| Size (bytes) | 334,272,960 | 60,874,560 |
| Size | 318.8 MB | 58.1 MB |
| Events in quadrant A | 2,240,615 | 376,983 |
| Events in quadrant B | 2,324,968 | 393,375 |
| Events in quadrant C | 2,213,250 | 382,854 |
| Events in quadrant D | 3,023,799 | 359,266 |
| Mode M9 | |||
|---|---|---|---|
| Quadrant | BADHDUFLAG | Total packets | Discarded packets |
| A | 0 | 13 | 0 |
| B | 0 | 13 | 0 |
| C | 0 | 13 | 0 |
| D | 0 | 13 | 0 |
| Mode SS | |||
|---|---|---|---|
| Quadrant | BADHDUFLAG | Total packets | Discarded packets |
| A | 0 | 96 | 0 |
| B | 0 | 96 | 0 |
| C | 0 | 96 | 0 |
| D | 0 | 96 | 0 |
| Mode M0 | |||
|---|---|---|---|
| Quadrant | BADHDUFLAG | Total packets | Discarded packets |
| A | 0 | 9724 | 2 |
| B | 0 | 9973 | 1 |
| C | 0 | 9677 | 1 |
| D | 0 | 12108 | 1 |
| Quadrant | Total seconds | Saturated seconds | Saturation percentage |
|---|---|---|---|
| A | 4709 | 30 | 0.637078% |
| B | 4709 | 22 | 0.467190% |
| C | 4709 | 5 | 0.106180% |
| D | 4709 | 38 | 0.806965% |
Noise dominated data is calculated using 1-second bins in cleaned event files. If a bin has >2000 counts, and if more than 50% of those come from <1% of pixels, then it is considered to be noise-dominated and hence unusable.
| Quadrant | # 1 sec bins | Bins with >0 counts | Bins with >2000 counts | High rate bins dominated by noise | Noise dominated (total time) | Noise dominated (detector-on time) | Marked lightcurve |
|---|---|---|---|---|---|---|---|
| A | 6009 | 4710 | 1 | 1 | 0.02% | 0.02% | 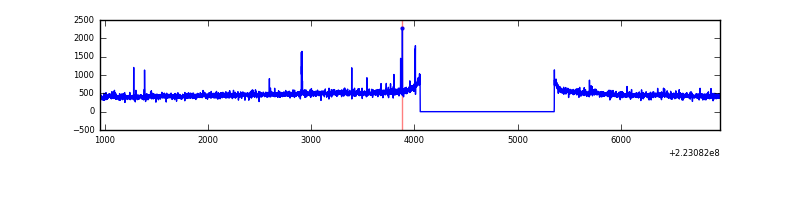 |
| B | 6009 | 4710 | 3 | 3 | 0.05% | 0.06% | 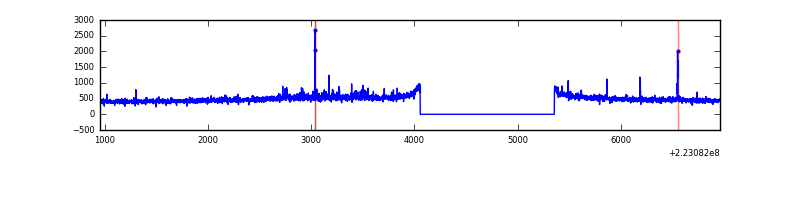 |
| C | 6009 | 4710 | 0 | 0 | 0.00% | 0.00% | 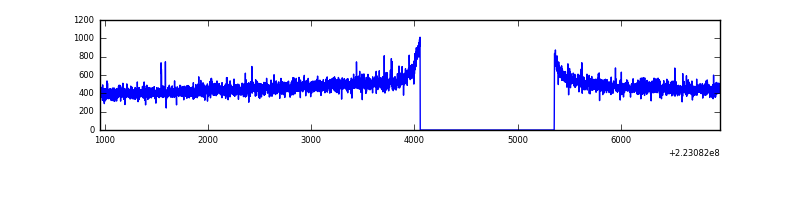 |
| D | 6009 | 4710 | 29 | 29 | 0.48% | 0.62% | 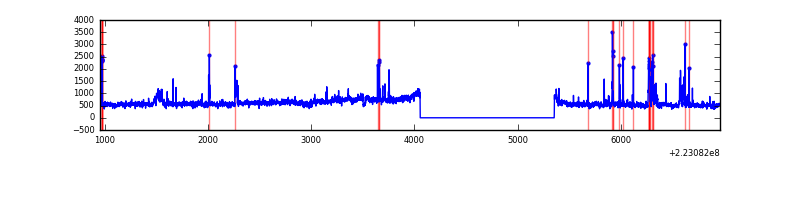 |
Top three noisy pixels from each quadrant. If the there are fewer than three noisy pixels in the level2.evt file, extra rows are filled as -1
| Pixel properties | Quadrant properties | ||||||
|---|---|---|---|---|---|---|---|
| Quadrant | DetID | PixID | Counts | Sigma | Mean | Median | Sigma |
| A | 14 | 111 | 20510 | 170.34 | 572 | 560 | 117.1 |
| A | 14 | 238 | 6988 | 54.88 | 572 | 560 | 117.1 |
| A | 0 | 226 | 5471 | 41.93 | 572 | 560 | 117.1 |
| B | 0 | 214 | 57034 | 504.07 | 580 | 568 | 112.0 |
| B | 4 | 239 | 12839 | 109.54 | 580 | 568 | 112.0 |
| B | 0 | 219 | 11147 | 94.44 | 580 | 568 | 112.0 |
| C | 9 | 68 | 26072 | 196.89 | 559 | 563 | 129.6 |
| C | 14 | 67 | 5232 | 36.04 | 559 | 563 | 129.6 |
| C | 13 | 61 | 4433 | 29.87 | 559 | 563 | 129.6 |
| D | 8 | 195 | 681430 | 4973.42 | 554 | 537 | 136.9 |
| D | 2 | 14 | 88759 | 644.4 | 554 | 537 | 136.9 |
| D | 2 | 216 | 57605 | 416.84 | 554 | 537 | 136.9 |
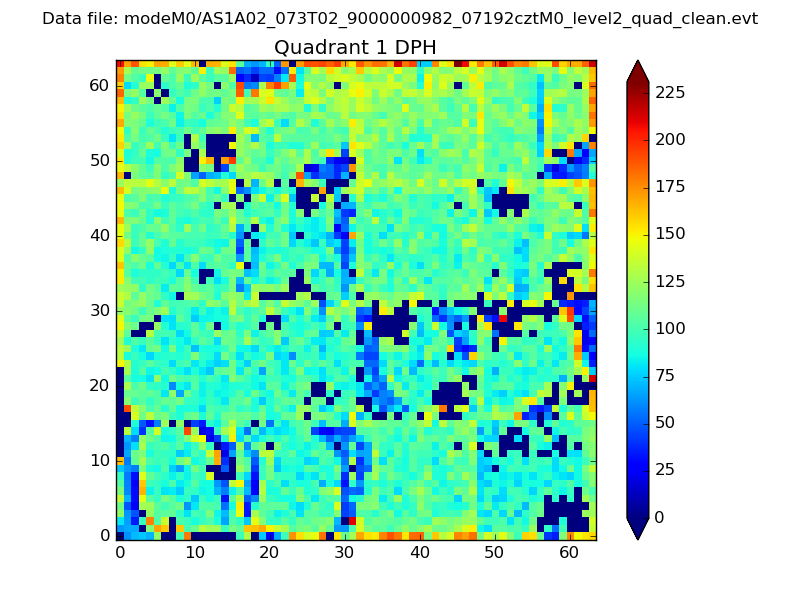
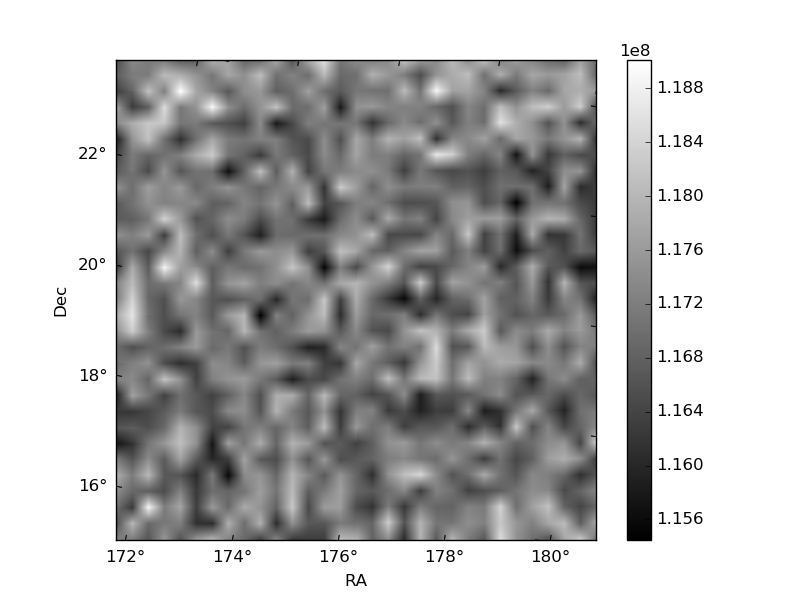
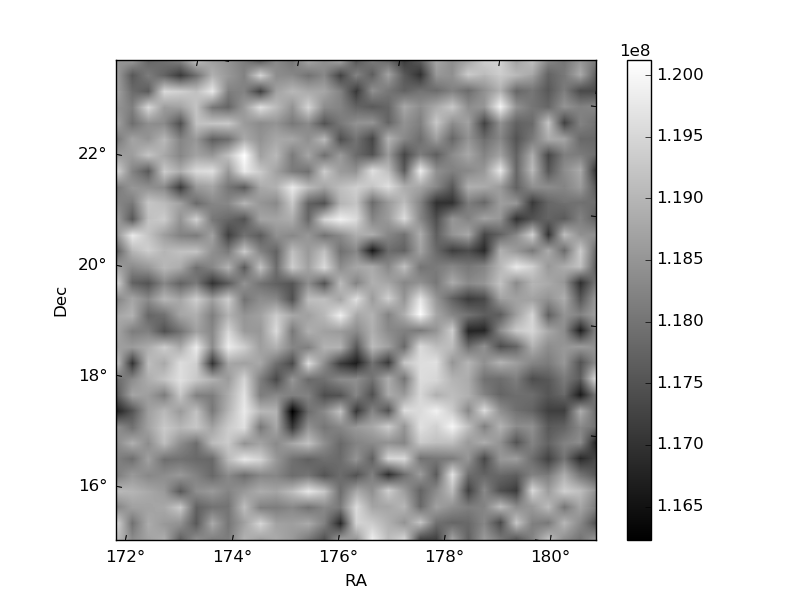
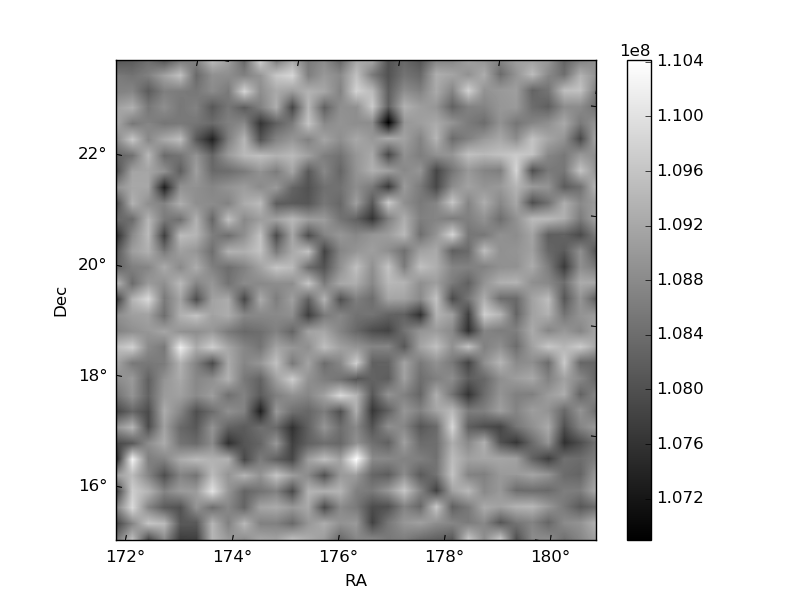
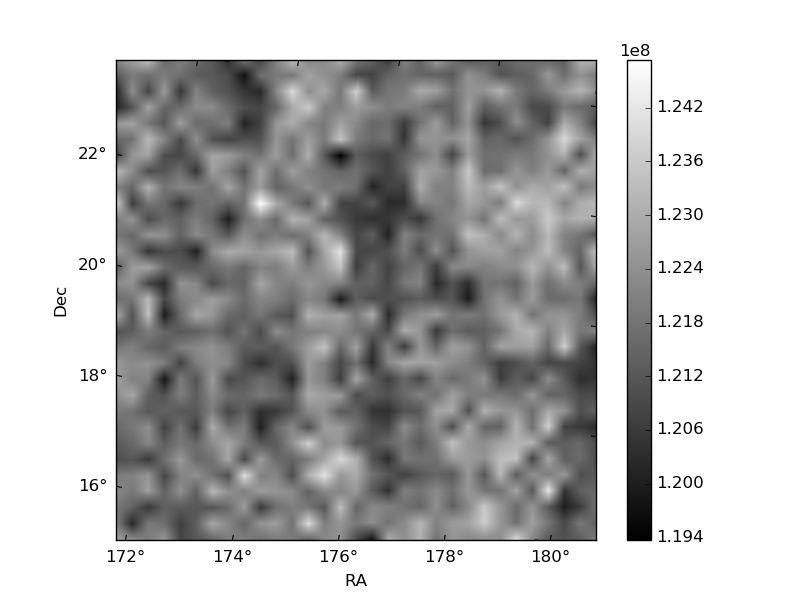
Histogram calculated using DETX and DETY for each event in the final _common_clean file
| Quadrant A |  |
 |
Quadrant B |
|---|---|---|---|
| Quadrant D | 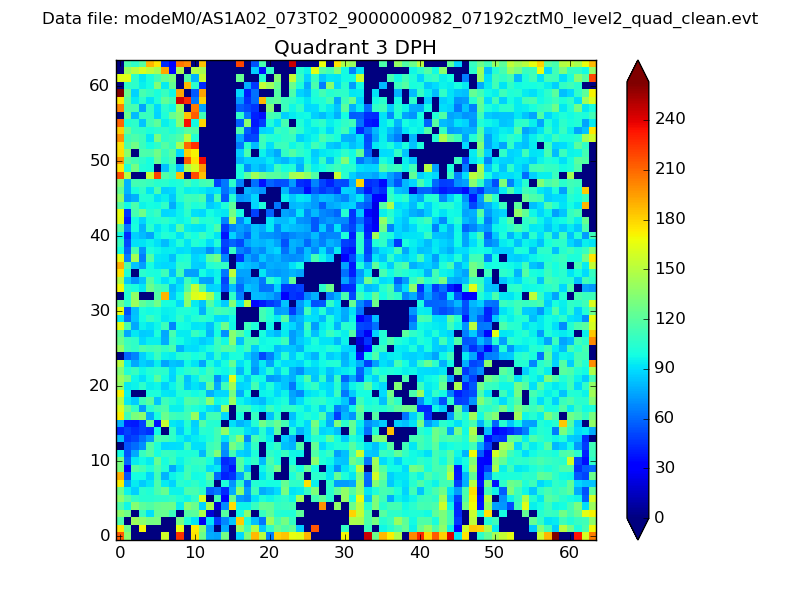 |
 |
Quadrant C |
| Plot type | Count rate plots | Images |
|---|---|---|
| Comparison with Poisson distribution Blue bars denote a histogram of data divided into 1 sec bins. Red curve is a Poisson curve with rate = median count rate of data. |
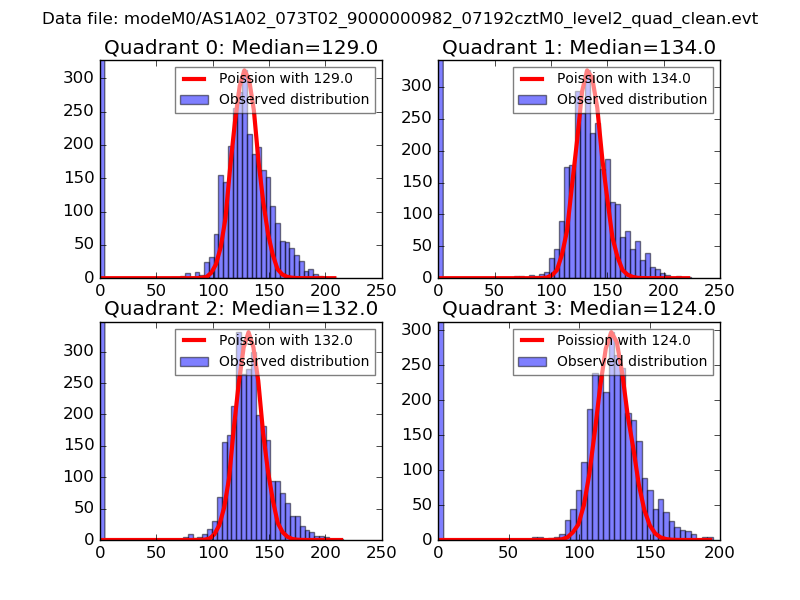 |
 |
| Quadrant-wise count rates Data is divided into 100 sec bins |
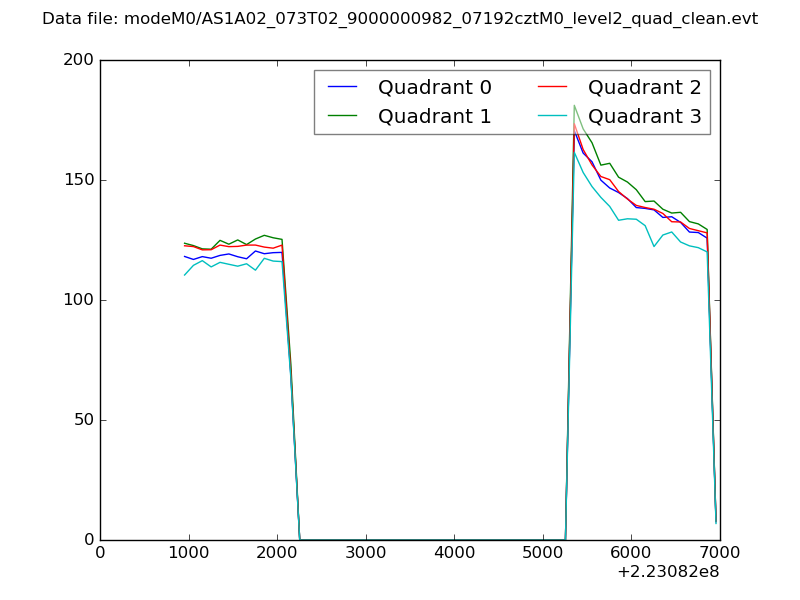 |
|
| Module-wise count rates for Quadrant A Data is divided into 100 sec bins |
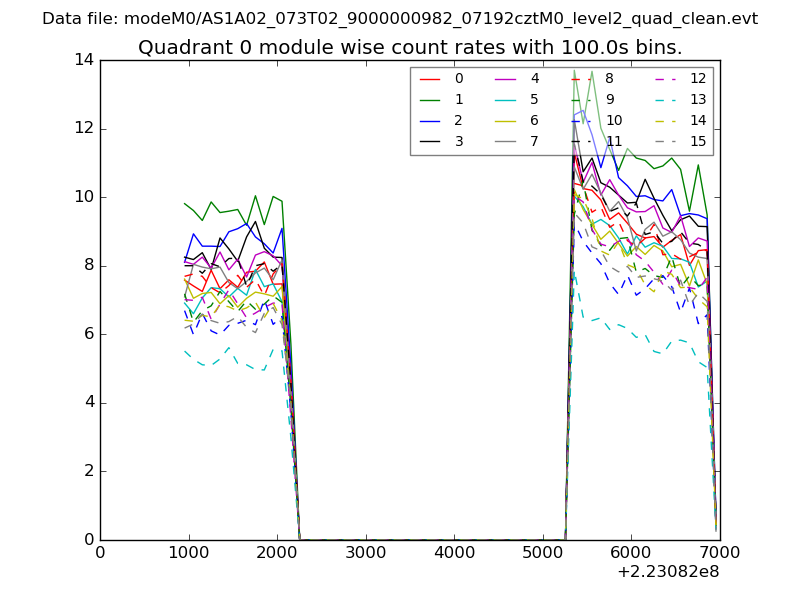 |
 |
| Module-wise count rates for Quadrant B Data is divided into 100 sec bins |
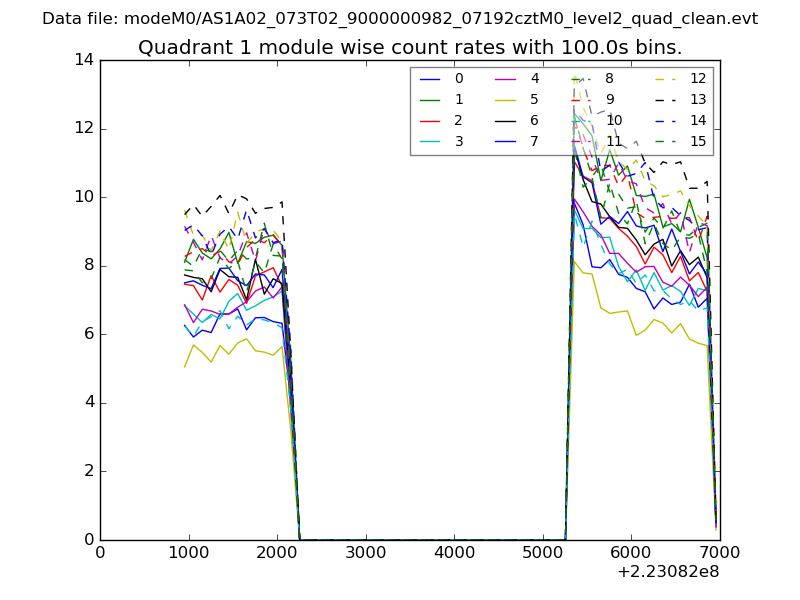 |
 |
| Module-wise count rates for Quadrant C Data is divided into 100 sec bins |
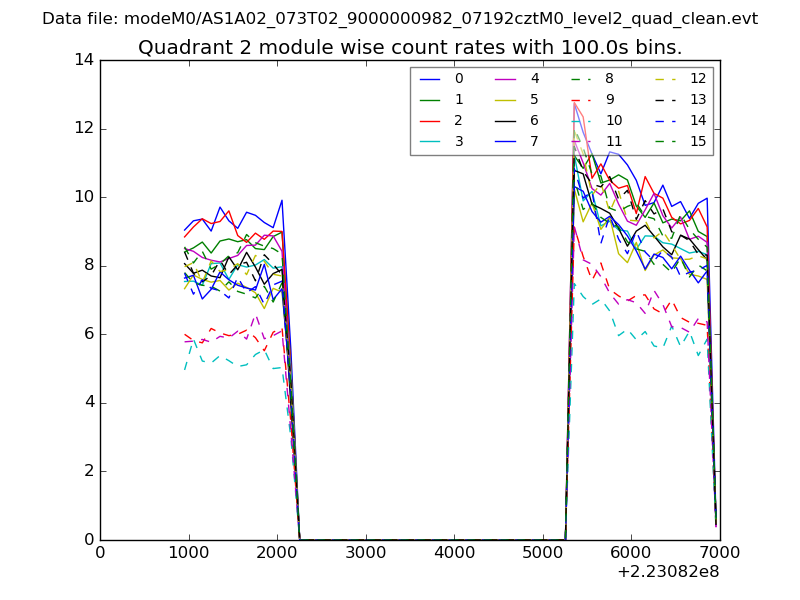 |
 |
| Module-wise count rates for Quadrant D Data is divided into 100 sec bins |
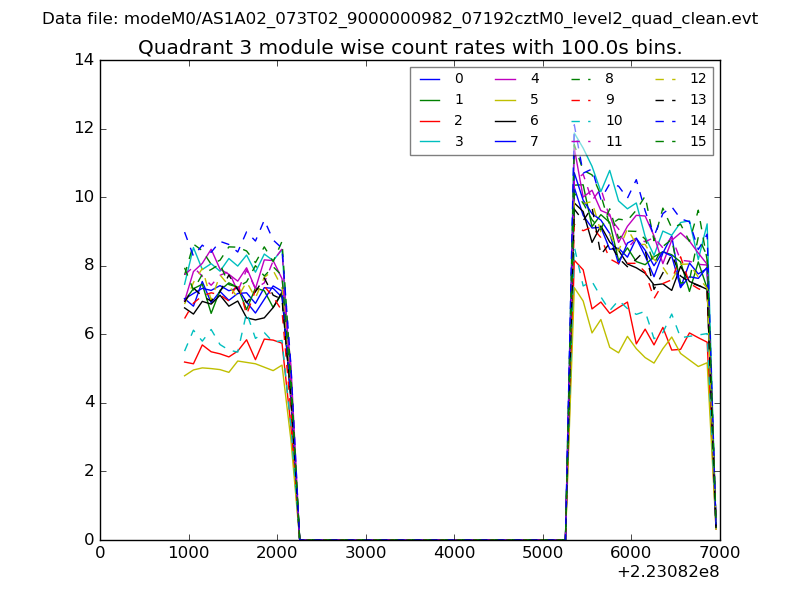 |
 |
| Parameter | Plot |
|---|---|
| CZT HV Monitor | 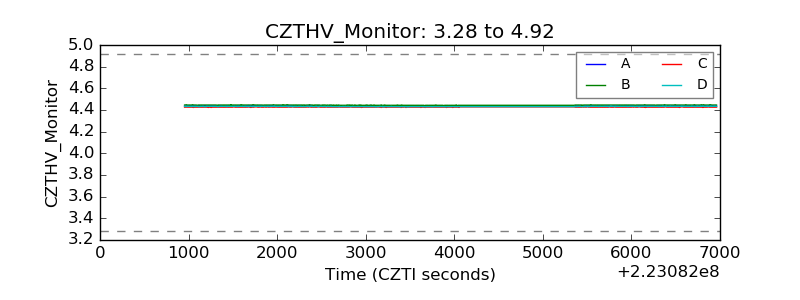 |
| D_VDD | 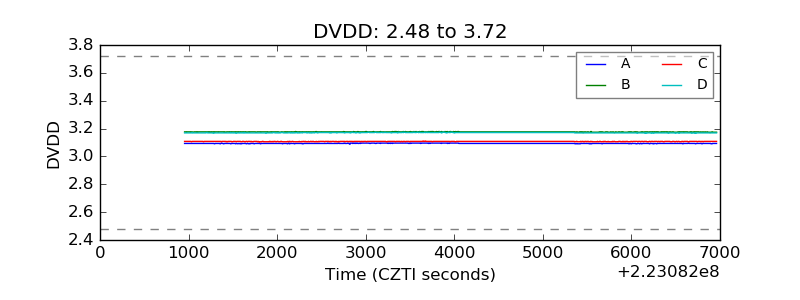 |
| Temperature 1 | 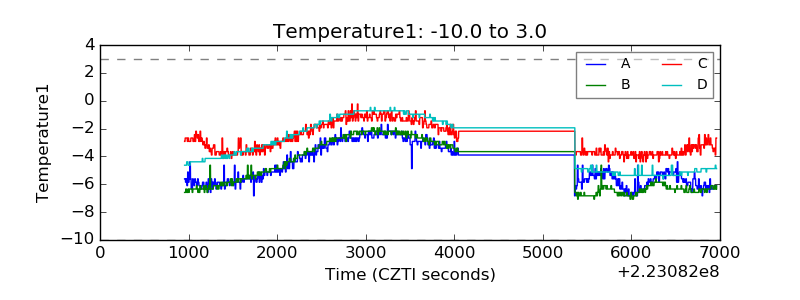 |
| Veto HV Monitor | 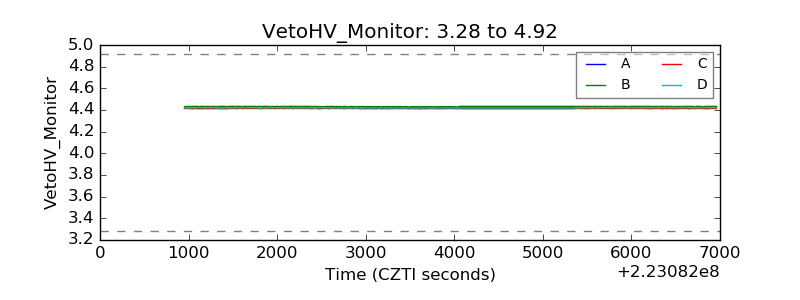 |
| Veto LLD | 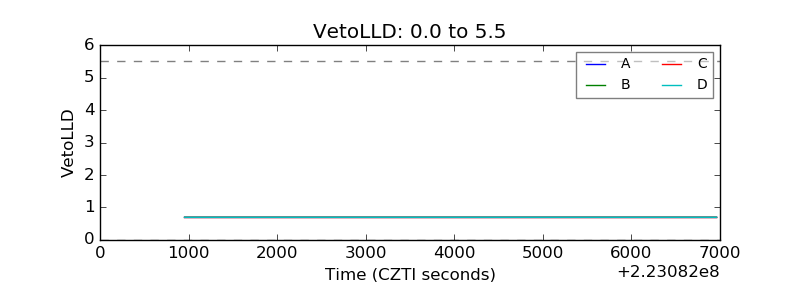 |
| Alpha Counter | 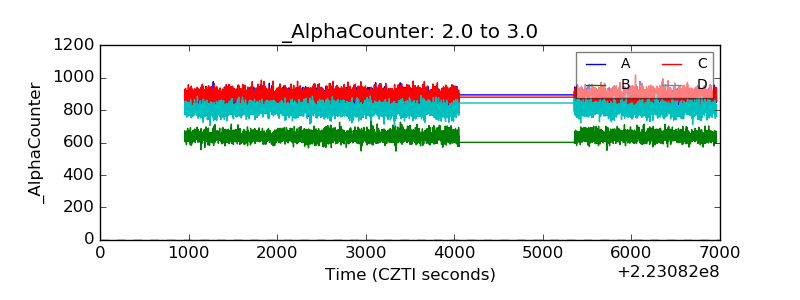 |
| _CPM_Rate | 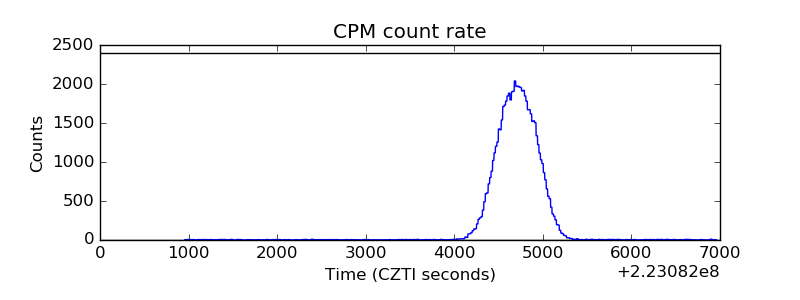 |
| CZT Counter | 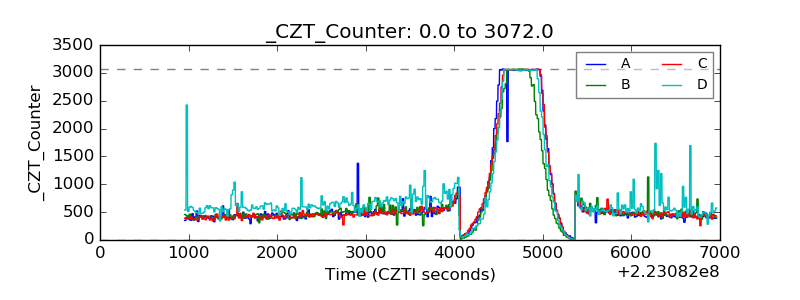 |
| +2.5 Volts monitor |  |
| +5 Volts monitor |  |
| _ROLL_ROT | 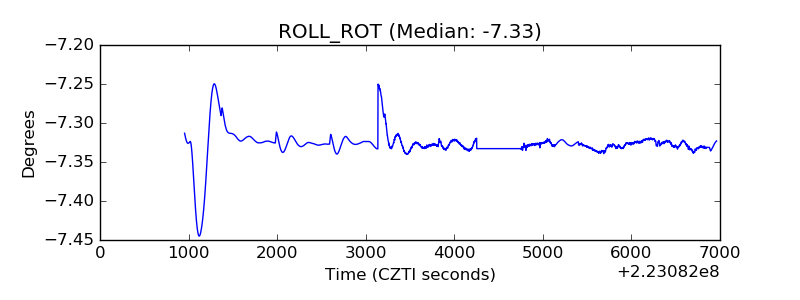 |
| _Roll_DEC | 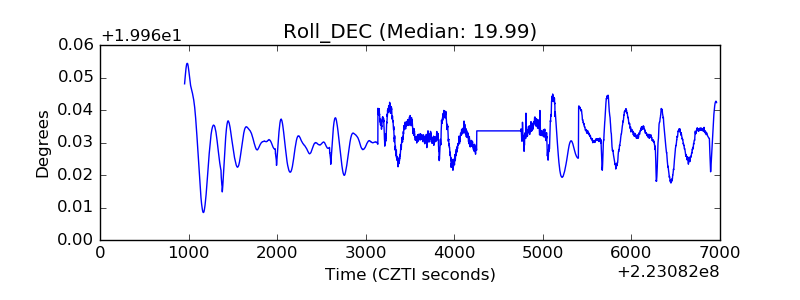 |
| _Roll_RA | 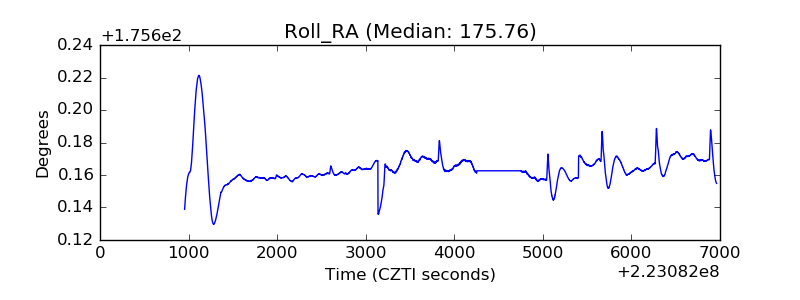 |
| Veto Counter | 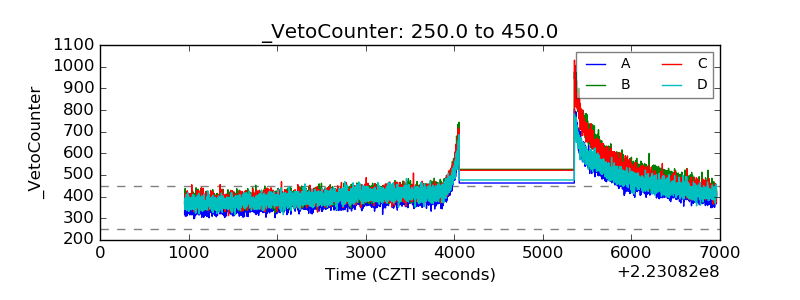 |