| Param | Original file | Final file |
|---|---|---|
| Filename | modeM0/AS1A02_073T02_9000000982_07194cztM0_level2.evt | modeM0/AS1A02_073T02_9000000982_07194cztM0_level2_quad_clean.evt |
| Size (bytes) | 467,452,800 | 91,926,720 |
| Size | 445.8 MB | 87.7 MB |
| Events in quadrant A | 3,161,422 | 585,226 |
| Events in quadrant B | 3,293,083 | 601,951 |
| Events in quadrant C | 3,082,539 | 587,163 |
| Events in quadrant D | 4,171,164 | 549,108 |
| Mode M9 | |||
|---|---|---|---|
| Quadrant | BADHDUFLAG | Total packets | Discarded packets |
| A | 0 | 22 | 0 |
| B | 0 | 22 | 0 |
| C | 0 | 22 | 0 |
| D | 0 | 23 | 0 |
| Mode SS | |||
|---|---|---|---|
| Quadrant | BADHDUFLAG | Total packets | Discarded packets |
| A | 0 | 134 | 0 |
| B | 0 | 134 | 0 |
| C | 0 | 134 | 0 |
| D | 0 | 134 | 0 |
| Mode M0 | |||
|---|---|---|---|
| Quadrant | BADHDUFLAG | Total packets | Discarded packets |
| A | 0 | 13684 | 3 |
| B | 0 | 13986 | 2 |
| C | 0 | 13651 | 2 |
| D | 0 | 17054 | 2 |
| Quadrant | Total seconds | Saturated seconds | Saturation percentage |
|---|---|---|---|
| A | 6604 | 63 | 0.953967% |
| B | 6604 | 73 | 1.105391% |
| C | 6604 | 38 | 0.575409% |
| D | 6604 | 172 | 2.604482% |
Noise dominated data is calculated using 1-second bins in cleaned event files. If a bin has >2000 counts, and if more than 50% of those come from <1% of pixels, then it is considered to be noise-dominated and hence unusable.
| Quadrant | # 1 sec bins | Bins with >0 counts | Bins with >2000 counts | High rate bins dominated by noise | Noise dominated (total time) | Noise dominated (detector-on time) | Marked lightcurve |
|---|---|---|---|---|---|---|---|
| A | 7864 | 6605 | 0 | 0 | 0.00% | 0.00% | 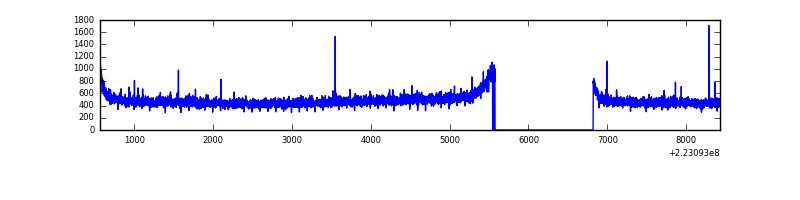 |
| B | 7864 | 6604 | 6 | 6 | 0.08% | 0.09% | 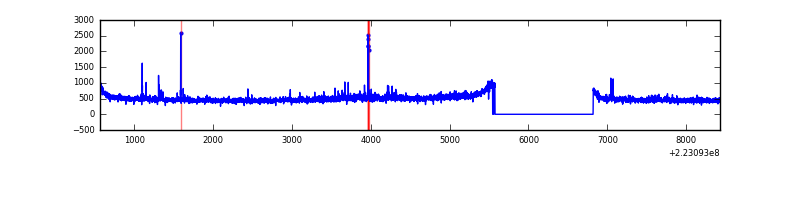 |
| C | 7864 | 6606 | 0 | 0 | 0.00% | 0.00% | 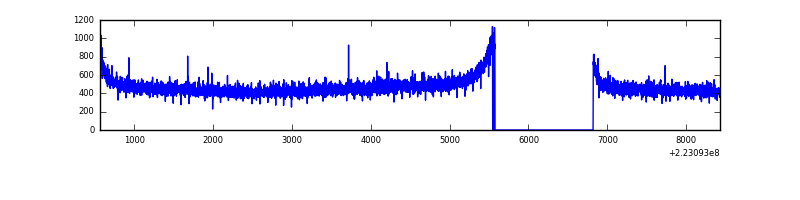 |
| D | 7864 | 6605 | 128 | 128 | 1.63% | 1.94% | 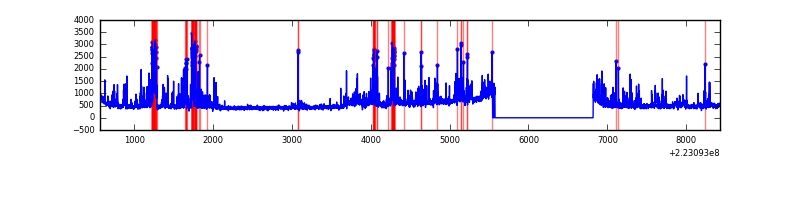 |
Top three noisy pixels from each quadrant. If the there are fewer than three noisy pixels in the level2.evt file, extra rows are filled as -1
| Pixel properties | Quadrant properties | ||||||
|---|---|---|---|---|---|---|---|
| Quadrant | DetID | PixID | Counts | Sigma | Mean | Median | Sigma |
| A | 13 | 14 | 10704 | 60.03 | 815 | 797 | 165.0 |
| A | 14 | 111 | 7771 | 42.26 | 815 | 797 | 165.0 |
| A | 0 | 226 | 7617 | 41.33 | 815 | 797 | 165.0 |
| B | 0 | 214 | 65081 | 413.42 | 820 | 803 | 155.5 |
| B | 0 | 187 | 16155 | 98.74 | 820 | 803 | 155.5 |
| B | 12 | 111 | 15458 | 94.26 | 820 | 803 | 155.5 |
| C | 13 | 61 | 6058 | 28.76 | 789 | 792 | 183.1 |
| C | 9 | 68 | 3484 | 14.7 | 789 | 792 | 183.1 |
| C | 14 | 67 | 2857 | 11.28 | 789 | 792 | 183.1 |
| D | 2 | 216 | 334712 | 1753.81 | 778 | 757 | 190.4 |
| D | 8 | 195 | 318720 | 1669.82 | 778 | 757 | 190.4 |
| D | 14 | 34 | 309767 | 1622.8 | 778 | 757 | 190.4 |
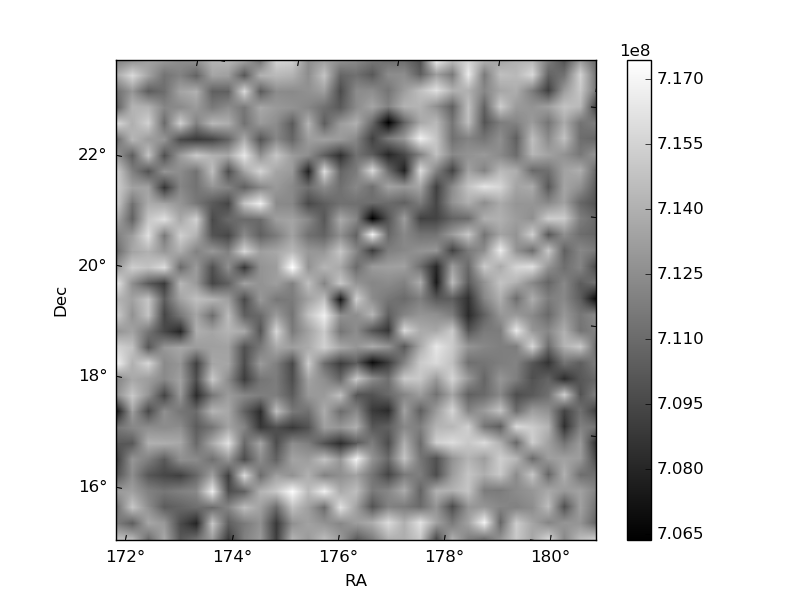
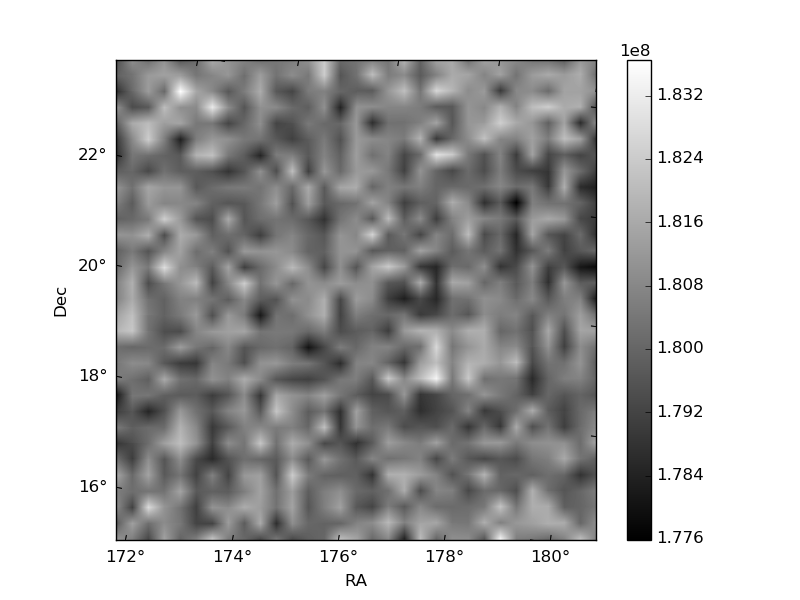
Histogram calculated using DETX and DETY for each event in the final _common_clean file
| Quadrant A | 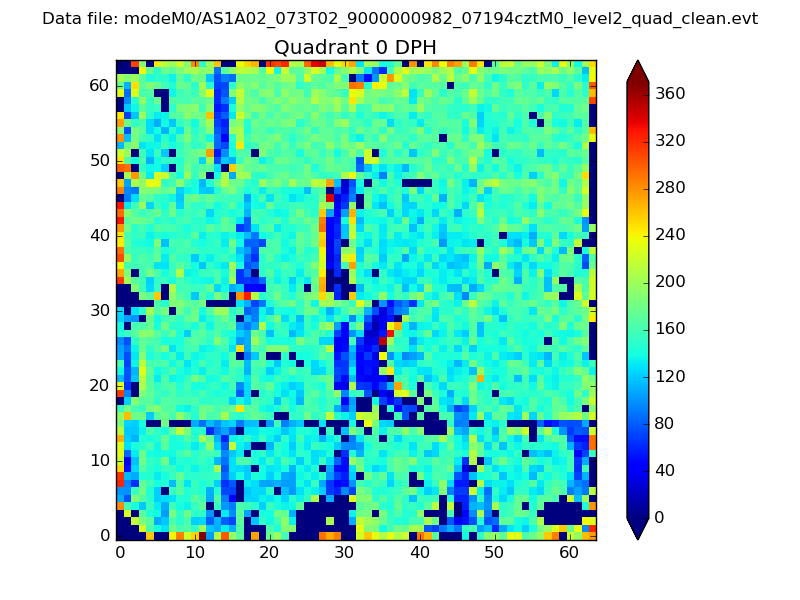 |
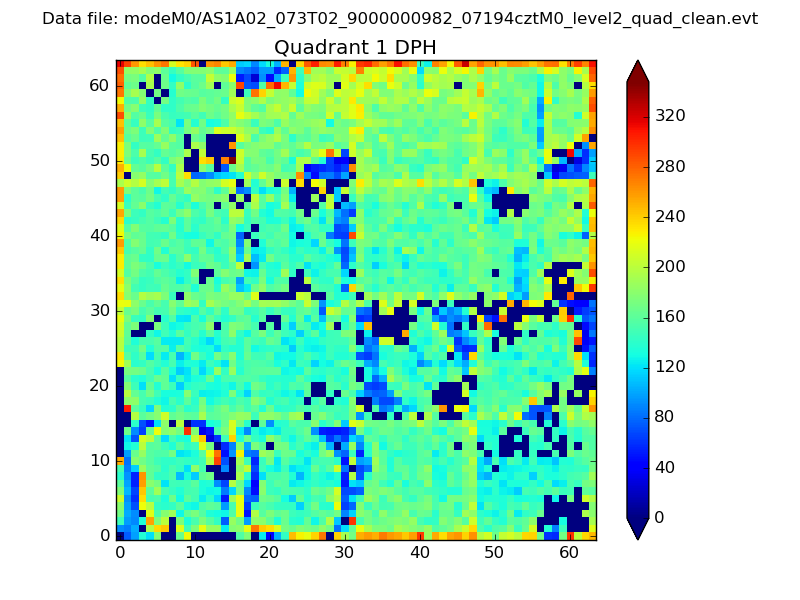 |
Quadrant B |
|---|---|---|---|
| Quadrant D | 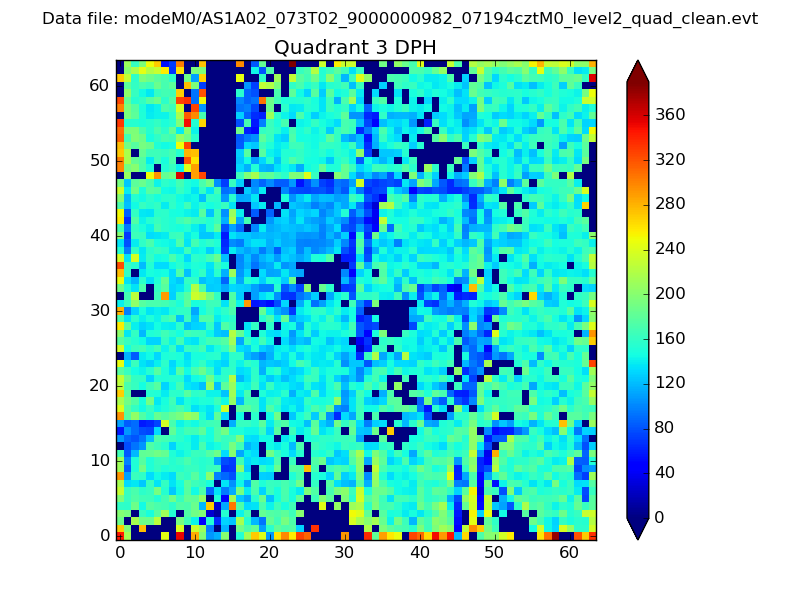 |
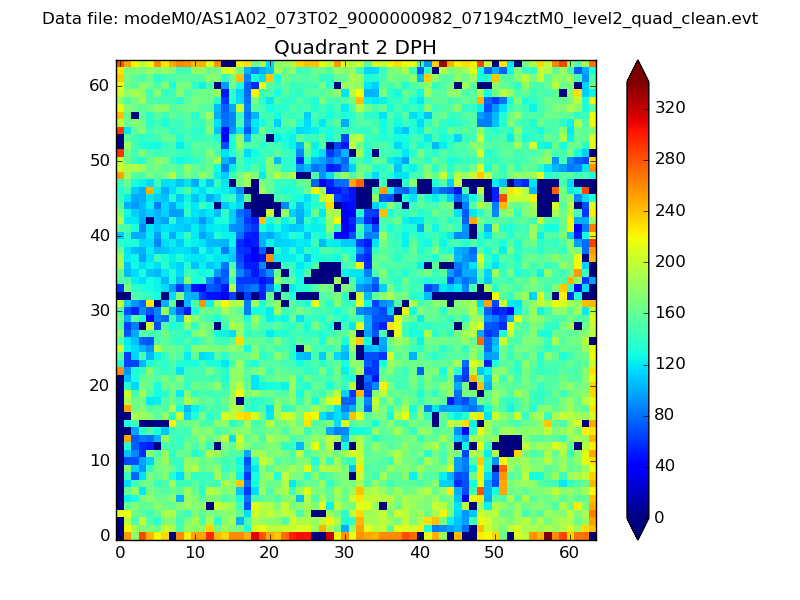 |
Quadrant C |
| Plot type | Count rate plots | Images |
|---|---|---|
| Comparison with Poisson distribution Blue bars denote a histogram of data divided into 1 sec bins. Red curve is a Poisson curve with rate = median count rate of data. |
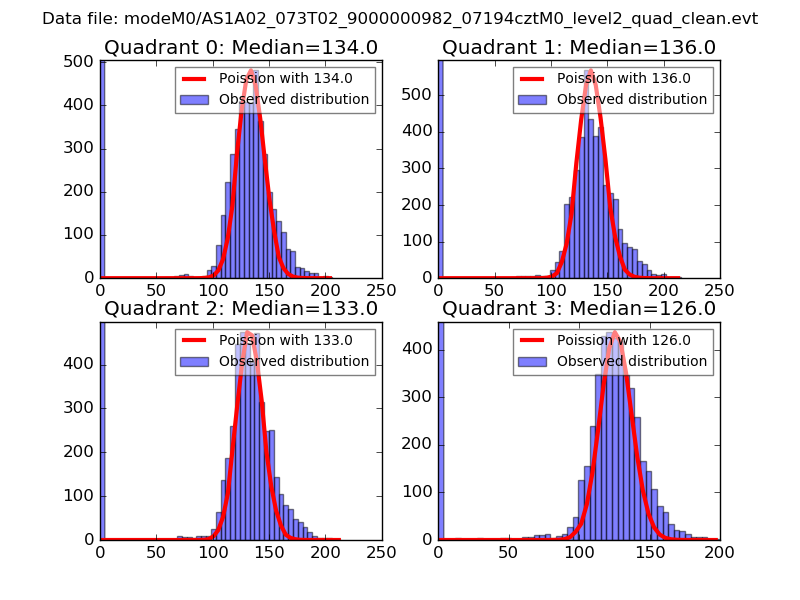 |
 |
| Quadrant-wise count rates Data is divided into 100 sec bins |
 |
|
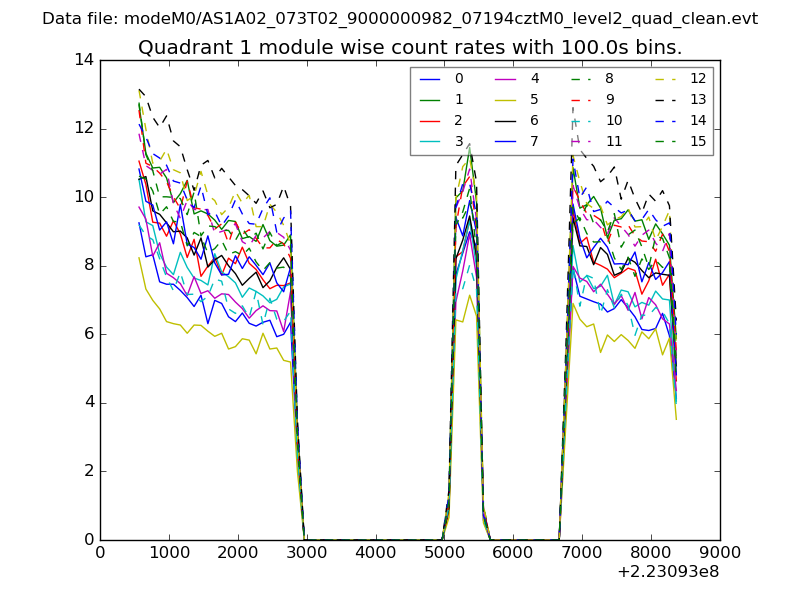
| Module-wise count rates for Quadrant A Data is divided into 100 sec bins |
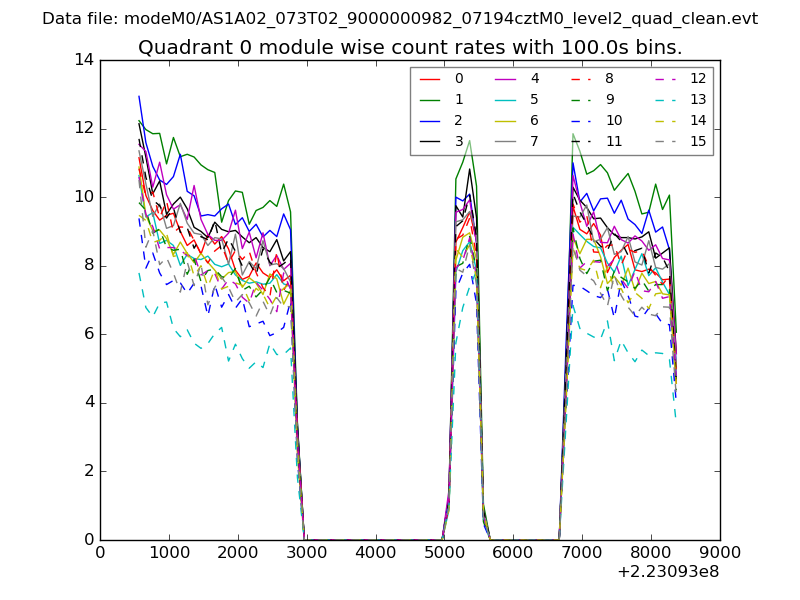 |
 |
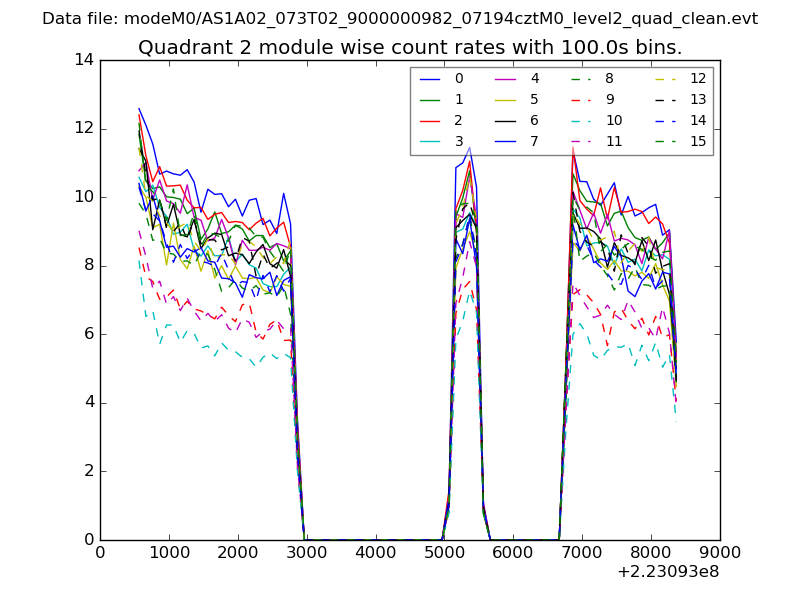
| Module-wise count rates for Quadrant B Data is divided into 100 sec bins |
 |
 |
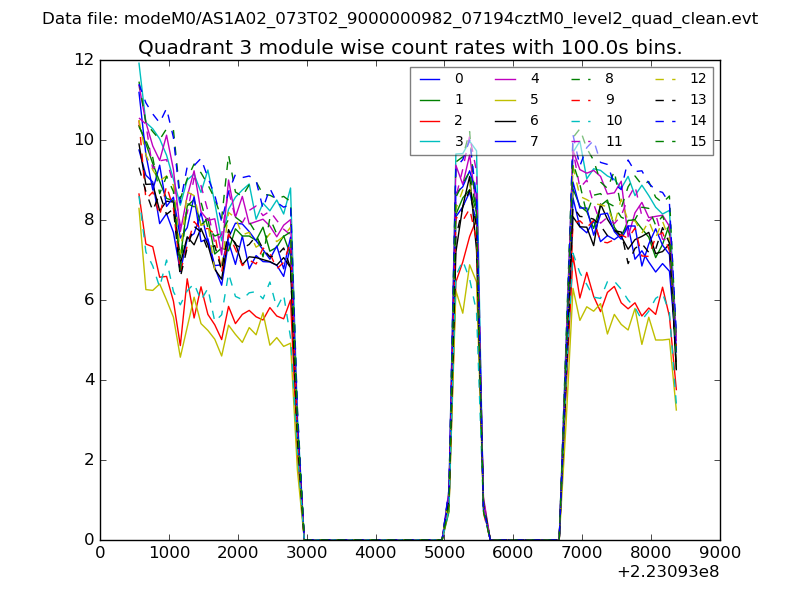
| Module-wise count rates for Quadrant C Data is divided into 100 sec bins |
 |
 |
| Module-wise count rates for Quadrant D Data is divided into 100 sec bins |
 |
 |
| Parameter | Plot |
|---|---|
| CZT HV Monitor | 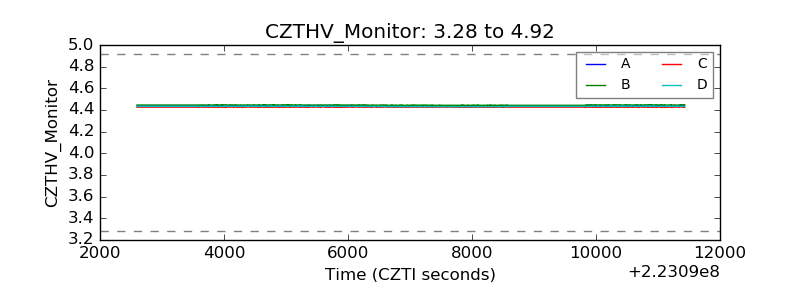 |
| D_VDD | 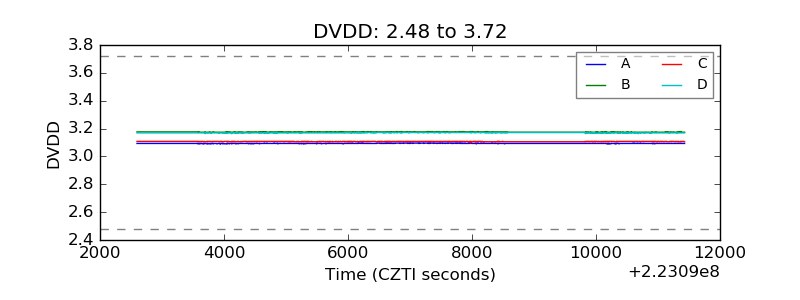 |
| Temperature 1 | 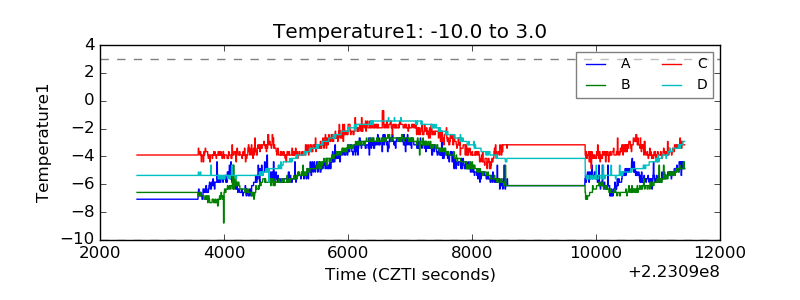 |
| Veto HV Monitor | 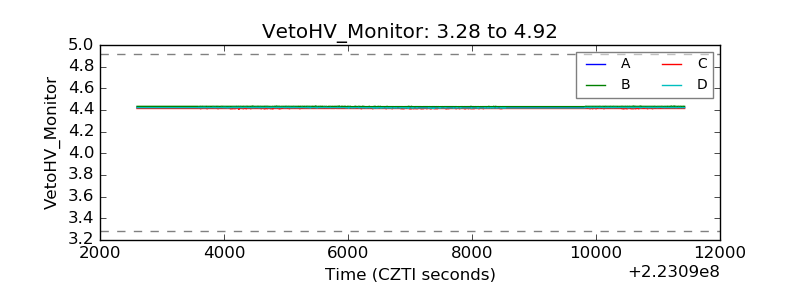 |
| Veto LLD | 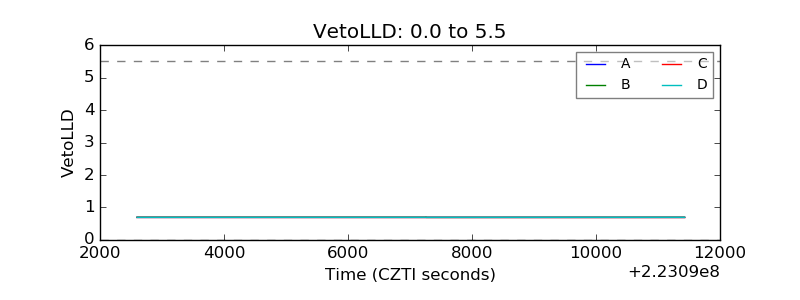 |
| Alpha Counter | 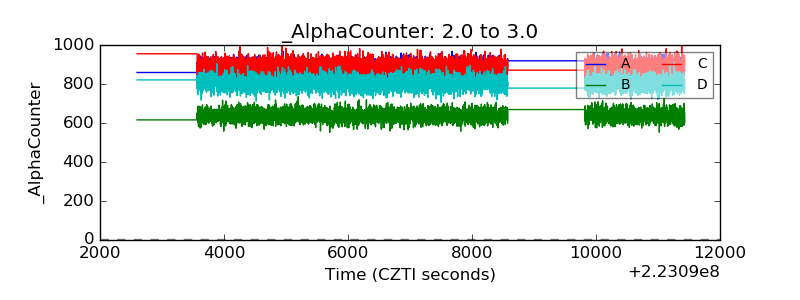 |
| _CPM_Rate | 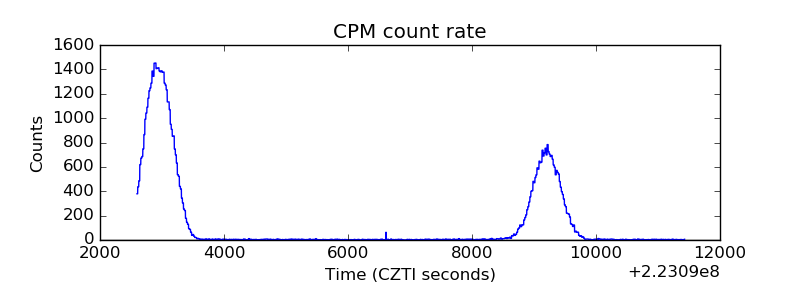 |
| CZT Counter | 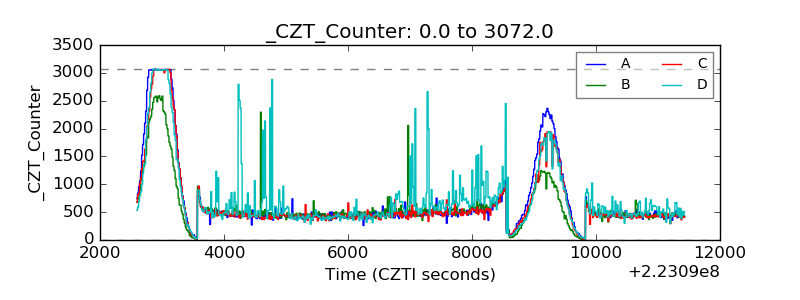 |
| +2.5 Volts monitor |  |
| +5 Volts monitor |  |
| _ROLL_ROT | 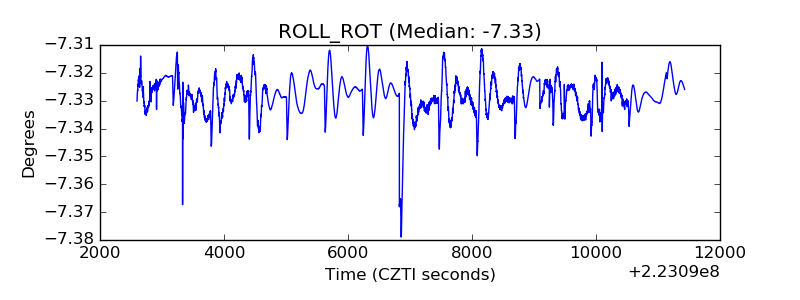 |
| _Roll_DEC | 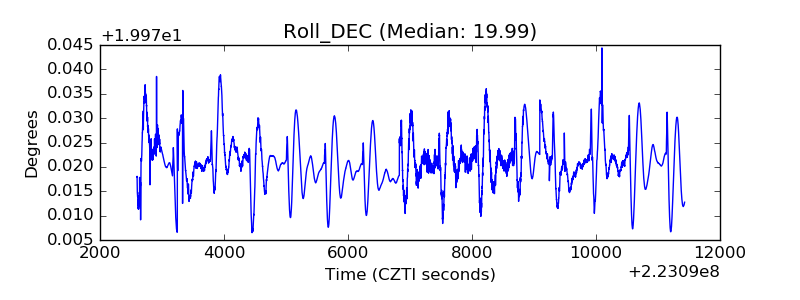 |
| _Roll_RA | 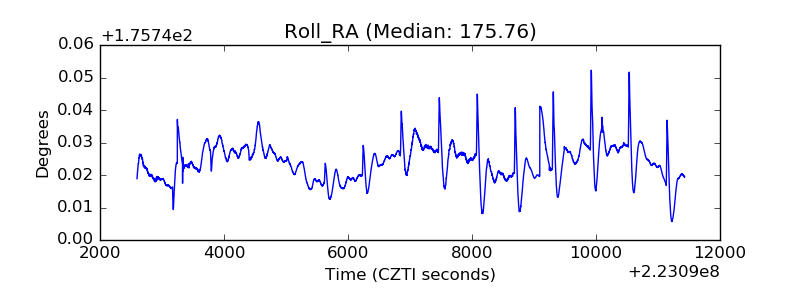 |
| Veto Counter | 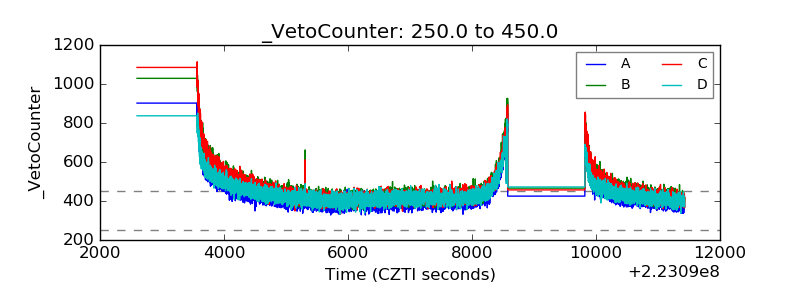 |