| Param | Original file | Final file |
|---|---|---|
| Filename | modeM0/AS1A02_073T02_9000000982_07195cztM0_level2.evt | modeM0/AS1A02_073T02_9000000982_07195cztM0_level2_quad_clean.evt |
| Size (bytes) | 455,250,240 | 88,341,120 |
| Size | 434.2 MB | 84.2 MB |
| Events in quadrant A | 3,118,203 | 556,182 |
| Events in quadrant B | 3,371,828 | 566,911 |
| Events in quadrant C | 3,103,052 | 558,717 |
| Events in quadrant D | 3,746,514 | 534,174 |
| Mode M9 | |||
|---|---|---|---|
| Quadrant | BADHDUFLAG | Total packets | Discarded packets |
| A | 0 | 24 | 0 |
| B | 0 | 24 | 0 |
| C | 0 | 24 | 0 |
| D | 0 | 24 | 0 |
| Mode SS | |||
|---|---|---|---|
| Quadrant | BADHDUFLAG | Total packets | Discarded packets |
| A | 0 | 134 | 0 |
| B | 0 | 134 | 0 |
| C | 0 | 134 | 0 |
| D | 0 | 134 | 0 |
| Mode M0 | |||
|---|---|---|---|
| Quadrant | BADHDUFLAG | Total packets | Discarded packets |
| A | 0 | 13617 | 3 |
| B | 0 | 14227 | 2 |
| C | 0 | 13824 | 2 |
| D | 0 | 15536 | 2 |
| Quadrant | Total seconds | Saturated seconds | Saturation percentage |
|---|---|---|---|
| A | 6593 | 103 | 1.562263% |
| B | 6593 | 122 | 1.850447% |
| C | 6593 | 45 | 0.682542% |
| D | 6593 | 112 | 1.698771% |
Noise dominated data is calculated using 1-second bins in cleaned event files. If a bin has >2000 counts, and if more than 50% of those come from <1% of pixels, then it is considered to be noise-dominated and hence unusable.
| Quadrant | # 1 sec bins | Bins with >0 counts | Bins with >2000 counts | High rate bins dominated by noise | Noise dominated (total time) | Noise dominated (detector-on time) | Marked lightcurve |
|---|---|---|---|---|---|---|---|
| A | 8953 | 6594 | 0 | 0 | 0.00% | 0.00% |  |
| B | 8953 | 6593 | 13 | 13 | 0.15% | 0.20% | 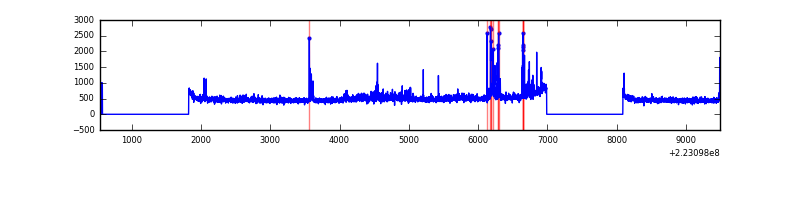 |
| C | 8953 | 6595 | 0 | 0 | 0.00% | 0.00% | 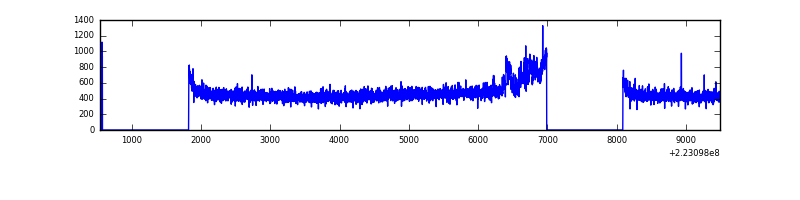 |
| D | 8953 | 6594 | 40 | 40 | 0.45% | 0.61% | 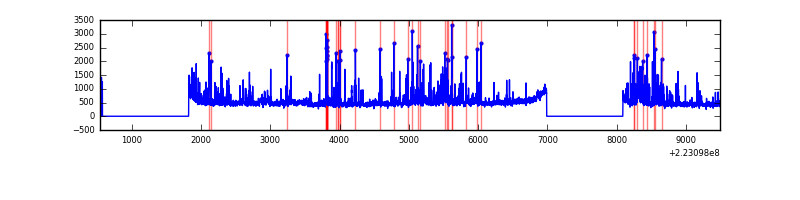 |
Top three noisy pixels from each quadrant. If the there are fewer than three noisy pixels in the level2.evt file, extra rows are filled as -1
| Pixel properties | Quadrant properties | ||||||
|---|---|---|---|---|---|---|---|
| Quadrant | DetID | PixID | Counts | Sigma | Mean | Median | Sigma |
| A | 14 | 111 | 12722 | 72.4 | 801 | 785 | 164.9 |
| A | 13 | 248 | 11099 | 62.56 | 801 | 785 | 164.9 |
| A | 13 | 14 | 7665 | 41.73 | 801 | 785 | 164.9 |
| B | 0 | 214 | 131740 | 851.42 | 801 | 784 | 153.8 |
| B | 4 | 81 | 64492 | 414.2 | 801 | 784 | 153.8 |
| B | 0 | 219 | 34142 | 216.88 | 801 | 784 | 153.8 |
| C | 13 | 250 | 81071 | 447.31 | 772 | 777 | 179.5 |
| C | 13 | 61 | 5869 | 28.37 | 772 | 777 | 179.5 |
| C | 9 | 68 | 5497 | 26.29 | 772 | 777 | 179.5 |
| D | 2 | 216 | 376605 | 1963.39 | 774 | 751 | 191.4 |
| D | 14 | 34 | 136569 | 709.49 | 774 | 751 | 191.4 |
| D | 8 | 195 | 121286 | 629.65 | 774 | 751 | 191.4 |
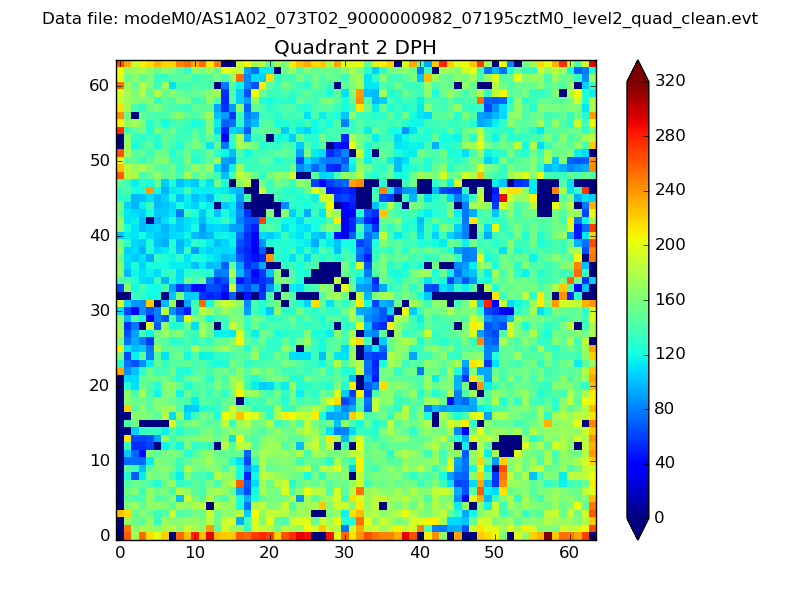
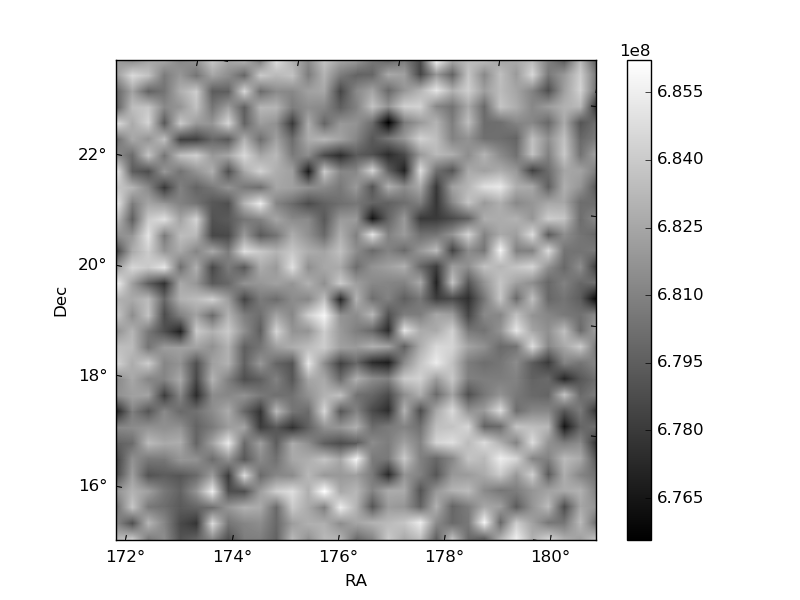
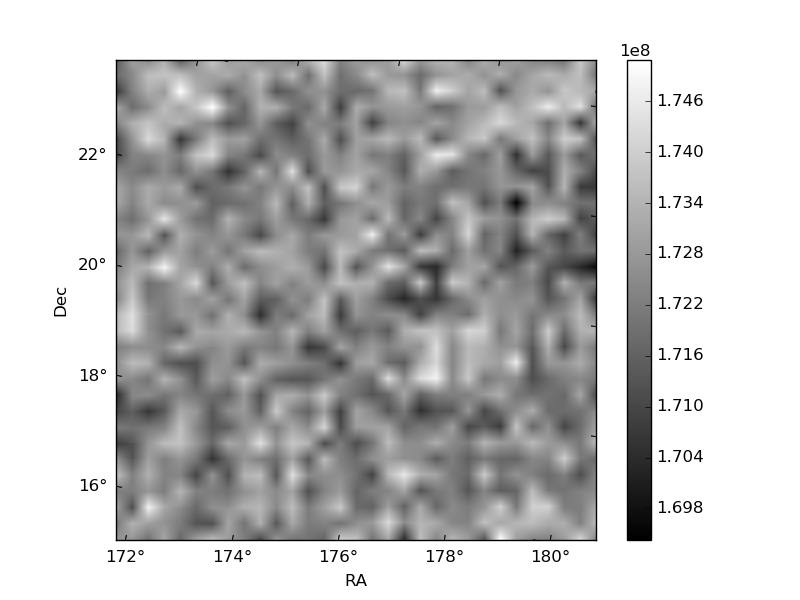
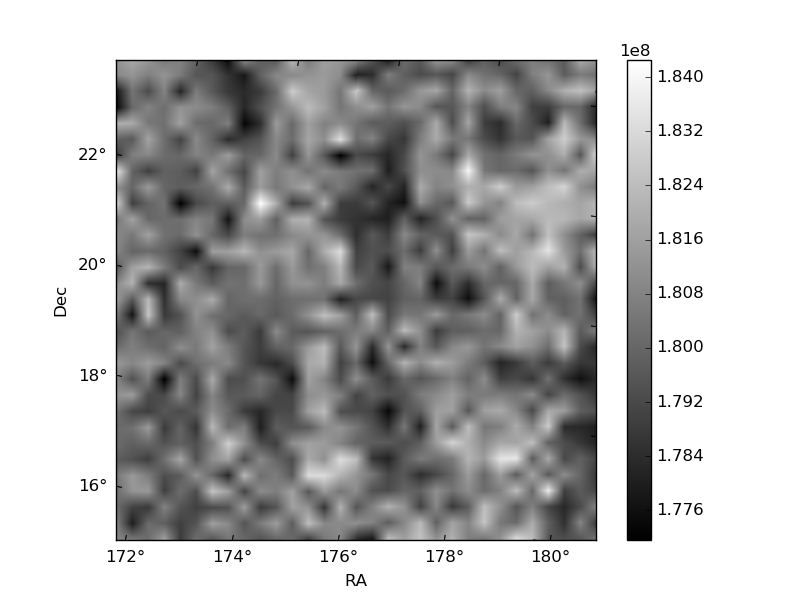
Histogram calculated using DETX and DETY for each event in the final _common_clean file
| Quadrant A | 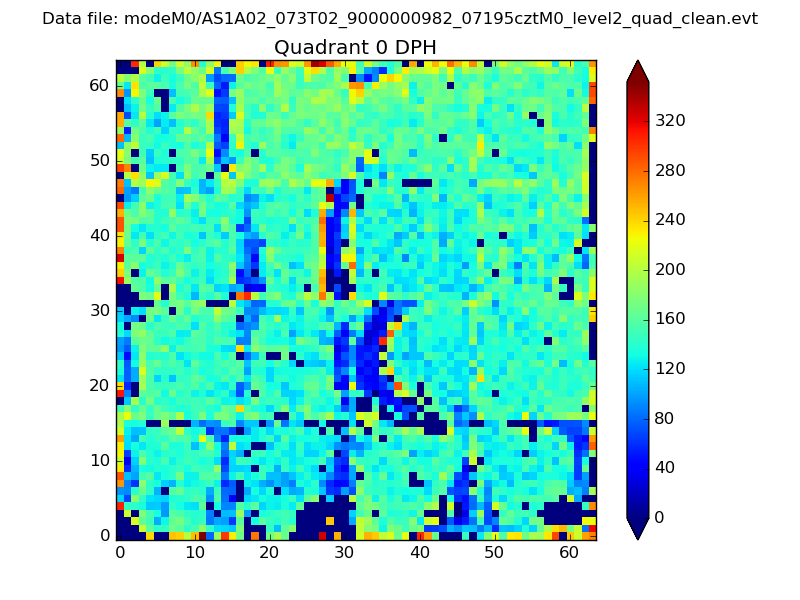 |
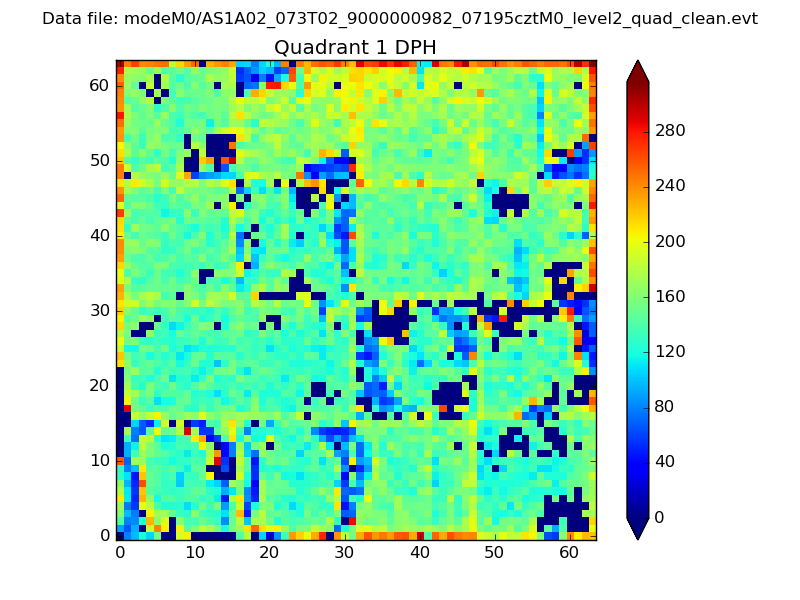 |
Quadrant B |
|---|---|---|---|
| Quadrant D | 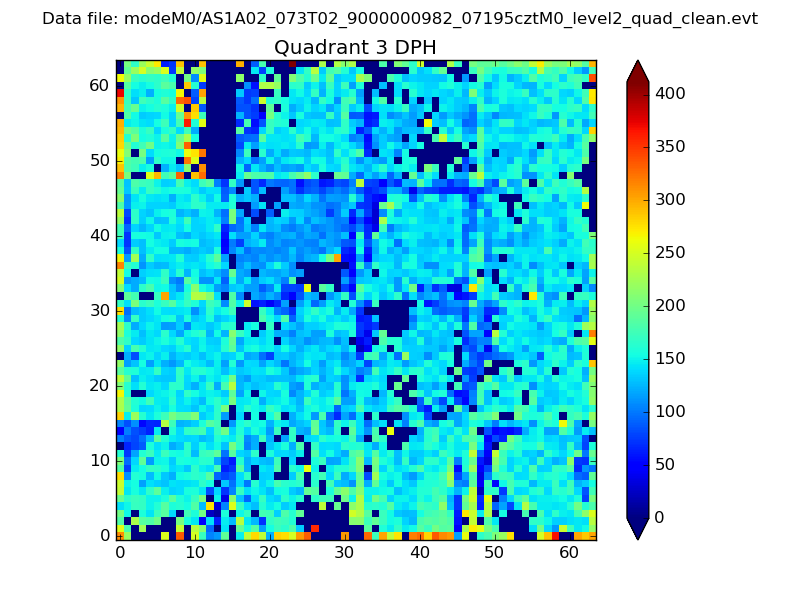 |
 |
Quadrant C |
| Plot type | Count rate plots | Images |
|---|---|---|
| Comparison with Poisson distribution Blue bars denote a histogram of data divided into 1 sec bins. Red curve is a Poisson curve with rate = median count rate of data. |
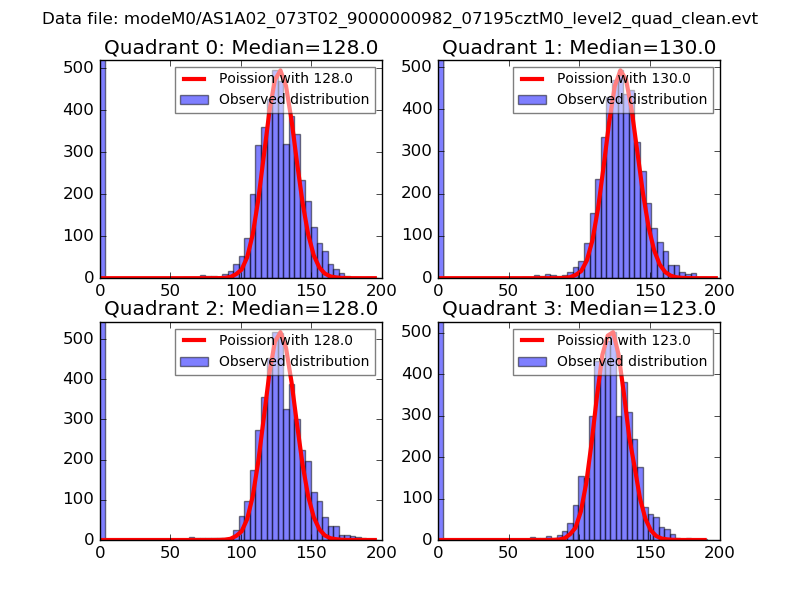 |
 |
| Quadrant-wise count rates Data is divided into 100 sec bins |
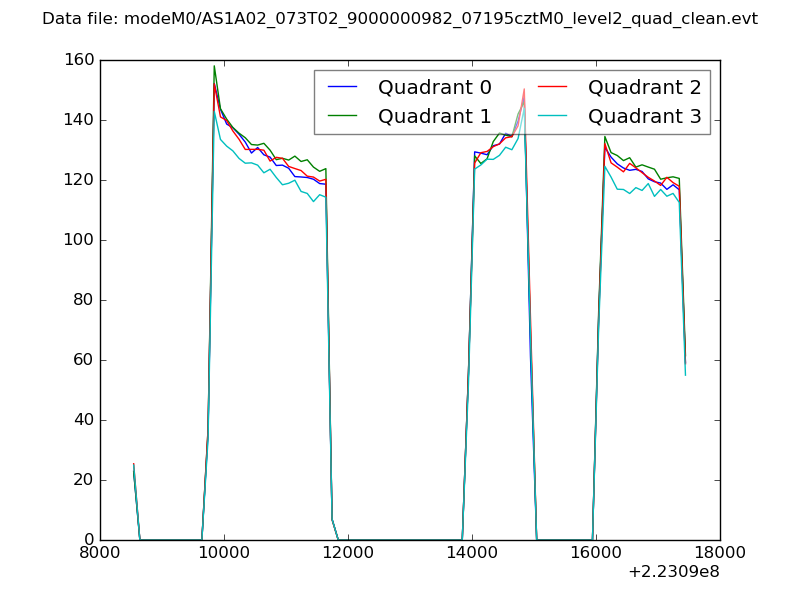 |
|
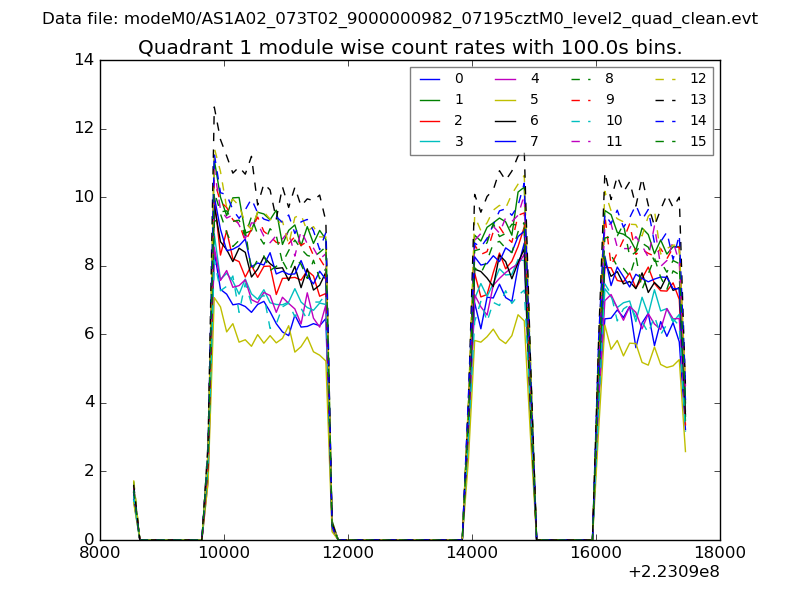
| Module-wise count rates for Quadrant A Data is divided into 100 sec bins |
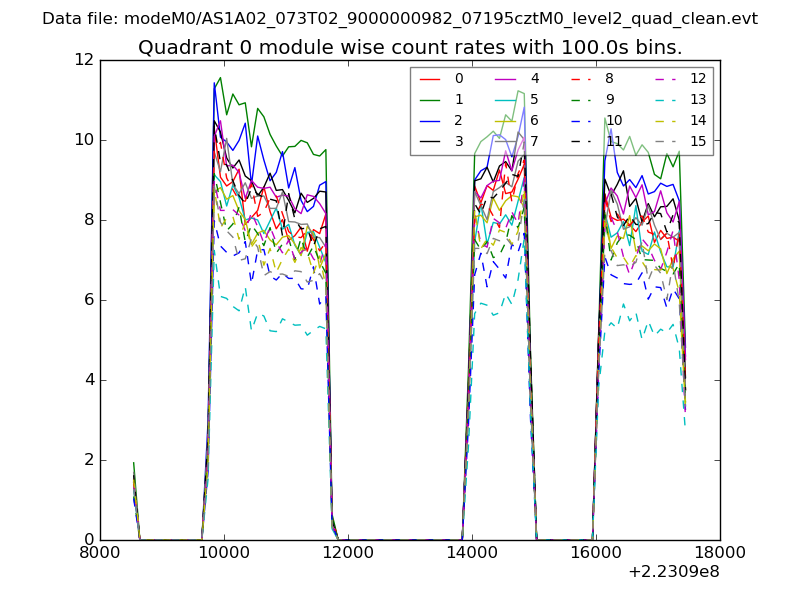 |
 |
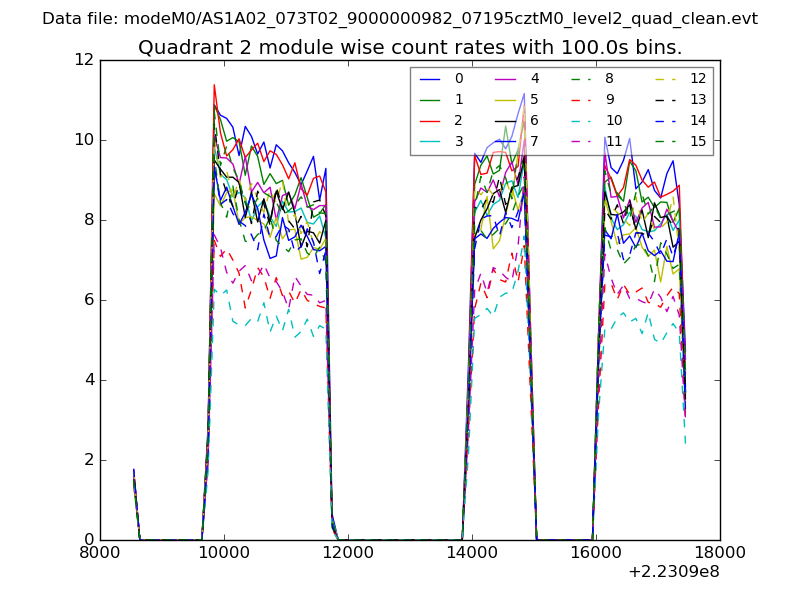
| Module-wise count rates for Quadrant B Data is divided into 100 sec bins |
 |
 |
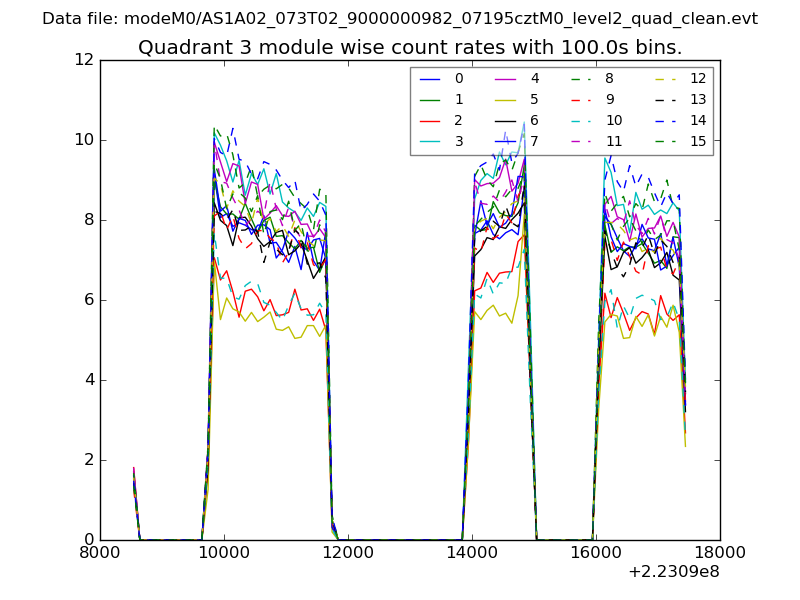
| Module-wise count rates for Quadrant C Data is divided into 100 sec bins |
 |
 |
| Module-wise count rates for Quadrant D Data is divided into 100 sec bins |
 |
 |
| Parameter | Plot |
|---|---|
| CZT HV Monitor | 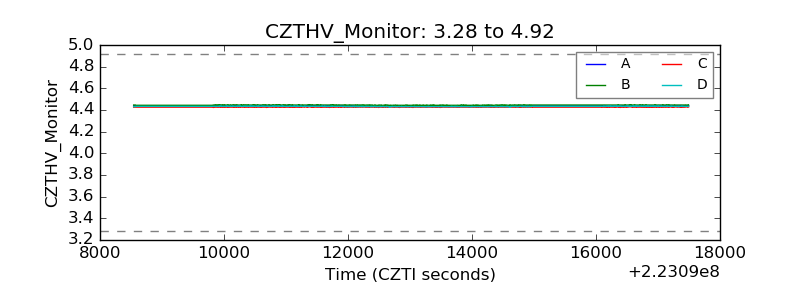 |
| D_VDD | 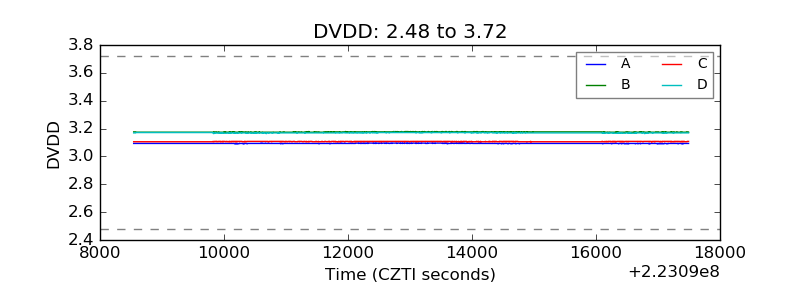 |
| Temperature 1 | 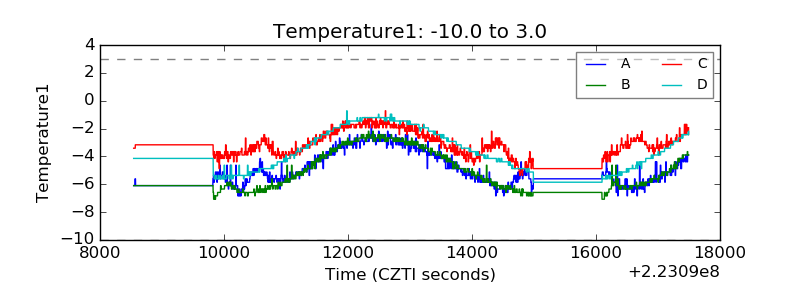 |
| Veto HV Monitor | 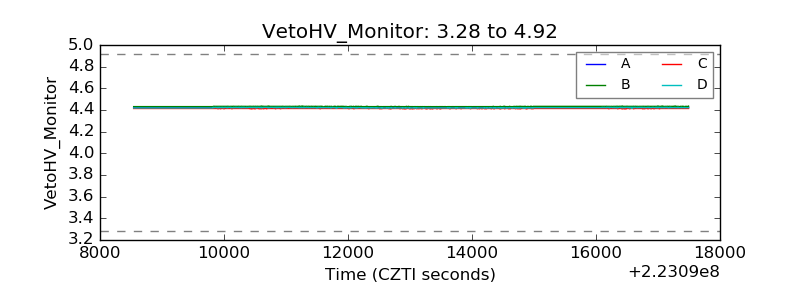 |
| Veto LLD | 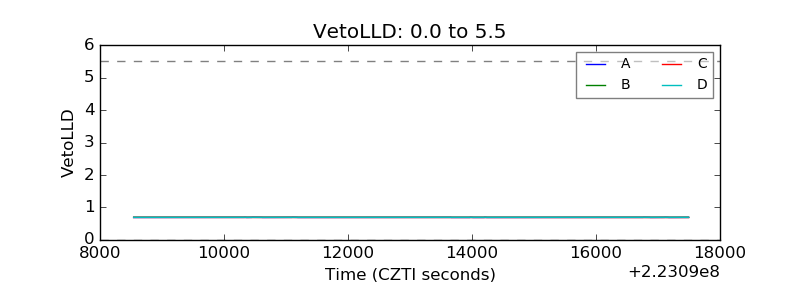 |
| Alpha Counter | 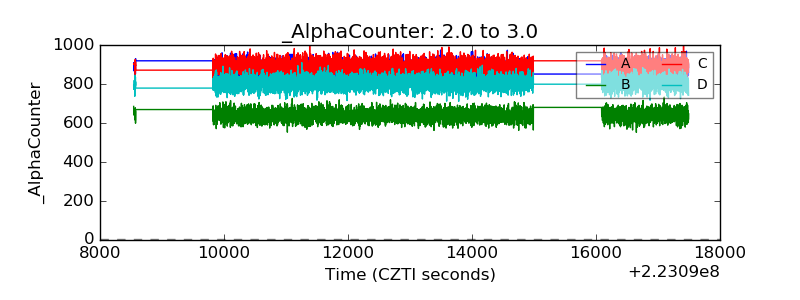 |
| _CPM_Rate | 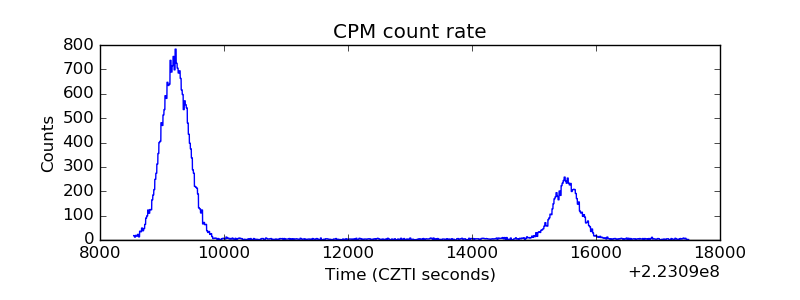 |
| CZT Counter | 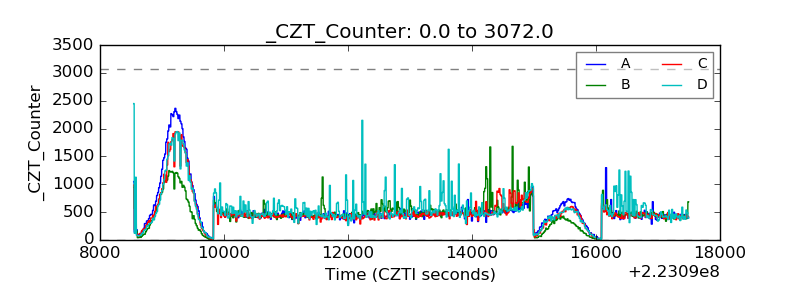 |
| +2.5 Volts monitor |  |
| +5 Volts monitor |  |
| _ROLL_ROT | 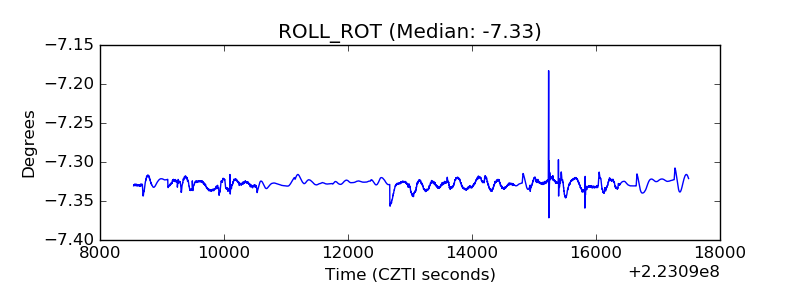 |
| _Roll_DEC | 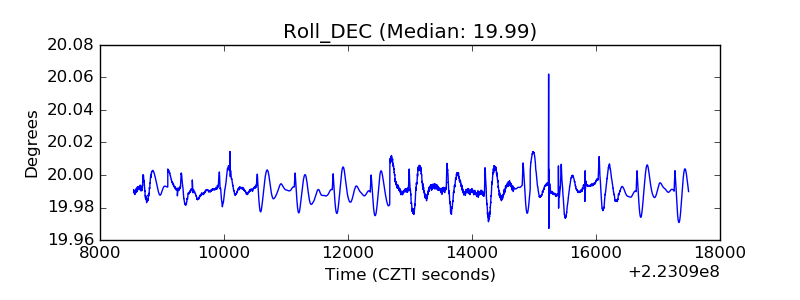 |
| _Roll_RA | 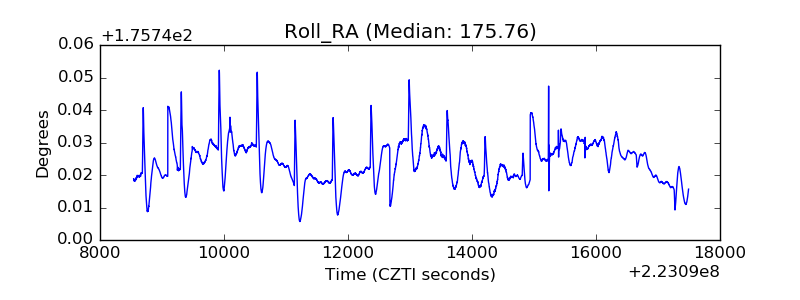 |
| Veto Counter | 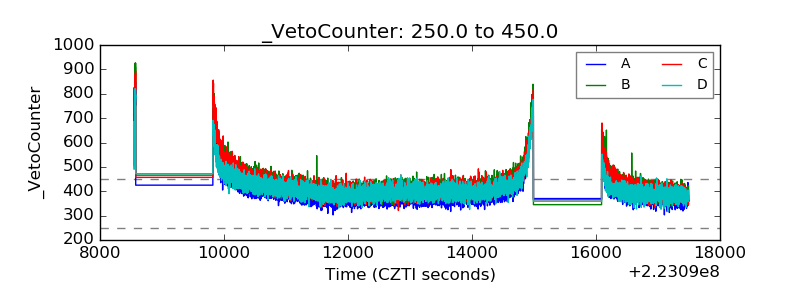 |