| Param | Original file | Final file |
|---|---|---|
| Filename | modeM0/AS1A02_073T02_9000000982_07198cztM0_level2.evt | modeM0/AS1A02_073T02_9000000982_07198cztM0_level2_quad_clean.evt |
| Size (bytes) | 565,156,800 | 87,744,960 |
| Size | 539.0 MB | 83.7 MB |
| Events in quadrant A | 3,737,309 | 529,940 |
| Events in quadrant B | 4,058,343 | 541,198 |
| Events in quadrant C | 3,789,294 | 533,594 |
| Events in quadrant D | 4,995,564 | 503,400 |
| Mode SS | |||
|---|---|---|---|
| Quadrant | BADHDUFLAG | Total packets | Discarded packets |
| A | 0 | 158 | 0 |
| B | 0 | 158 | 0 |
| C | 0 | 158 | 0 |
| D | 0 | 158 | 0 |
| Mode M0 | |||
|---|---|---|---|
| Quadrant | BADHDUFLAG | Total packets | Discarded packets |
| A | 0 | 16512 | 3 |
| B | 0 | 17099 | 2 |
| C | 0 | 16695 | 2 |
| D | 0 | 20192 | 2 |
| Quadrant | Total seconds | Saturated seconds | Saturation percentage |
|---|---|---|---|
| A | 7887 | 233 | 2.954228% |
| B | 7887 | 263 | 3.334601% |
| C | 7887 | 220 | 2.789400% |
| D | 7887 | 445 | 5.642196% |
Noise dominated data is calculated using 1-second bins in cleaned event files. If a bin has >2000 counts, and if more than 50% of those come from <1% of pixels, then it is considered to be noise-dominated and hence unusable.
| Quadrant | # 1 sec bins | Bins with >0 counts | Bins with >2000 counts | High rate bins dominated by noise | Noise dominated (total time) | Noise dominated (detector-on time) | Marked lightcurve |
|---|---|---|---|---|---|---|---|
| A | 7917 | 7887 | 0 | 0 | 0.00% | 0.00% | 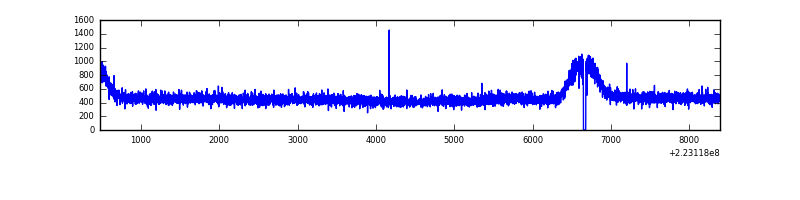 |
| B | 7917 | 7887 | 8 | 8 | 0.10% | 0.10% | 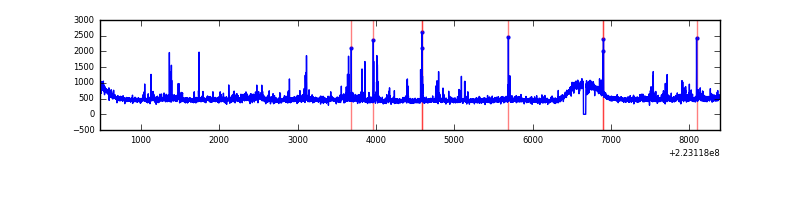 |
| C | 7917 | 7887 | 2 | 2 | 0.03% | 0.03% | 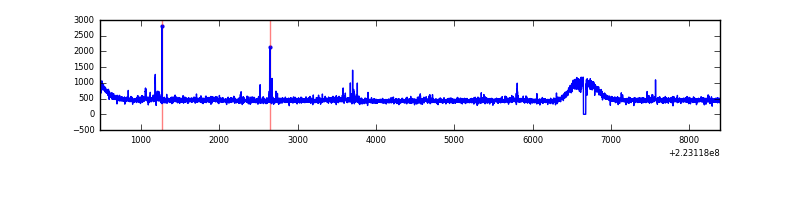 |
| D | 7917 | 7887 | 157 | 157 | 1.98% | 1.99% | 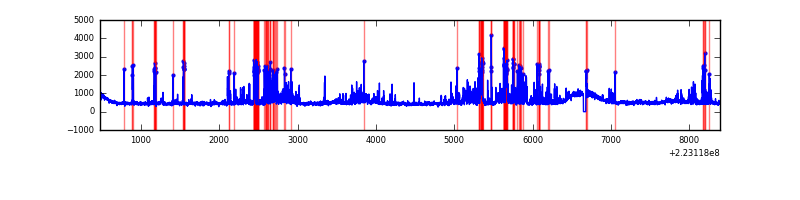 |
Top three noisy pixels from each quadrant. If the there are fewer than three noisy pixels in the level2.evt file, extra rows are filled as -1
| Pixel properties | Quadrant properties | ||||||
|---|---|---|---|---|---|---|---|
| Quadrant | DetID | PixID | Counts | Sigma | Mean | Median | Sigma |
| A | 13 | 14 | 11382 | 52.08 | 965 | 941 | 200.5 |
| A | 0 | 226 | 9218 | 41.29 | 965 | 941 | 200.5 |
| A | 12 | 194 | 8693 | 38.67 | 965 | 941 | 200.5 |
| B | 0 | 214 | 89626 | 464.93 | 969 | 945 | 190.7 |
| B | 0 | 219 | 84704 | 439.12 | 969 | 945 | 190.7 |
| B | 4 | 239 | 62420 | 322.3 | 969 | 945 | 190.7 |
| C | 9 | 68 | 78262 | 348.49 | 942 | 946 | 221.9 |
| C | 14 | 67 | 16567 | 70.41 | 942 | 946 | 221.9 |
| C | 8 | 128 | 13939 | 58.56 | 942 | 946 | 221.9 |
| D | 2 | 216 | 943524 | 4038.05 | 932 | 898 | 233.4 |
| D | 8 | 195 | 213965 | 912.74 | 932 | 898 | 233.4 |
| D | 2 | 136 | 120025 | 510.32 | 932 | 898 | 233.4 |
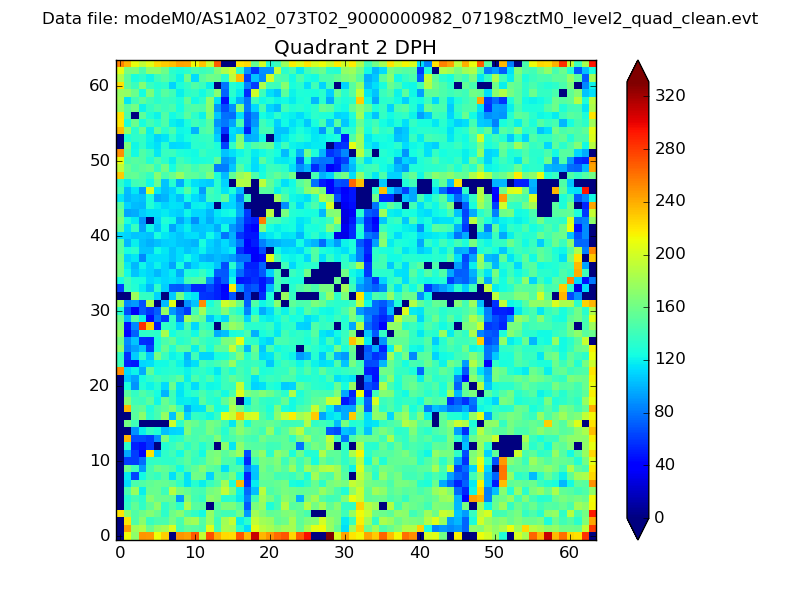
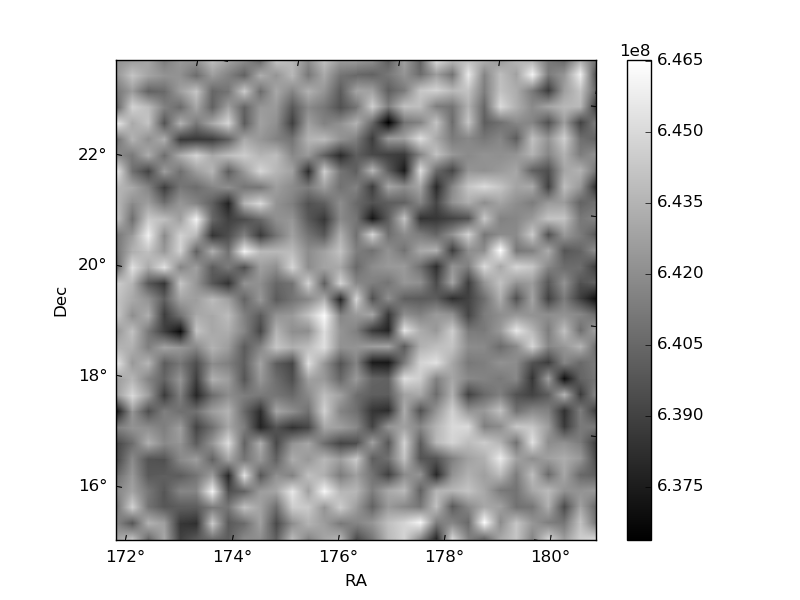
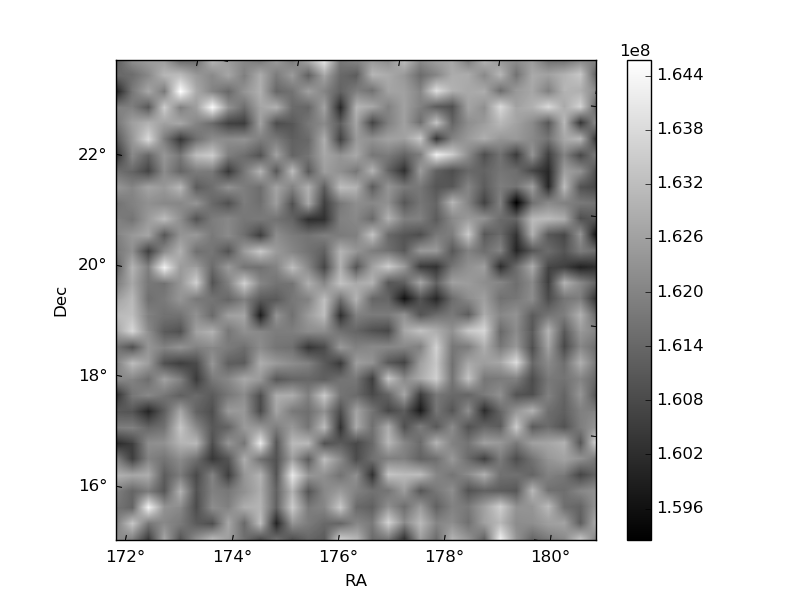
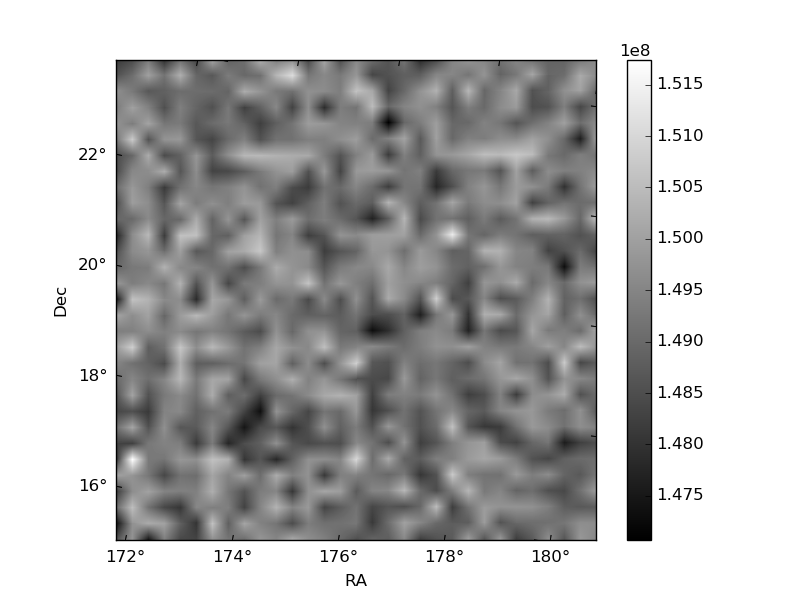
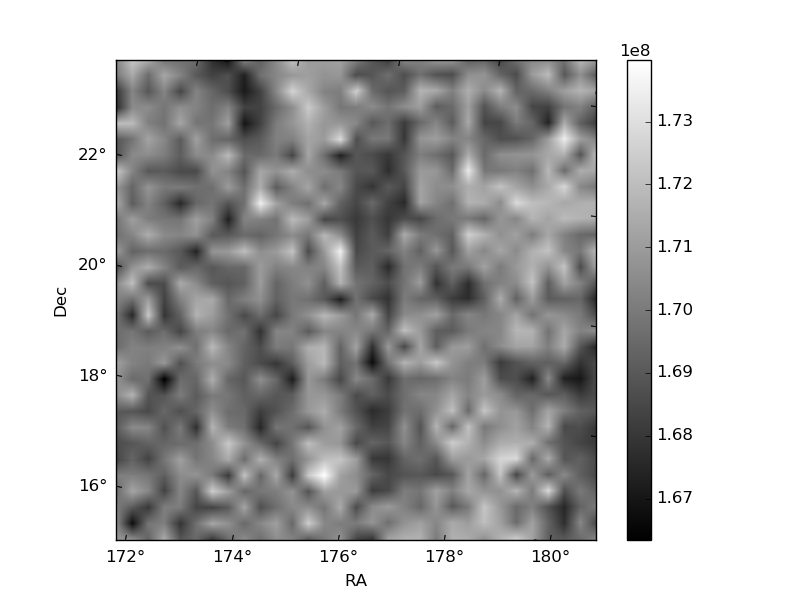
Histogram calculated using DETX and DETY for each event in the final _common_clean file
| Quadrant A | 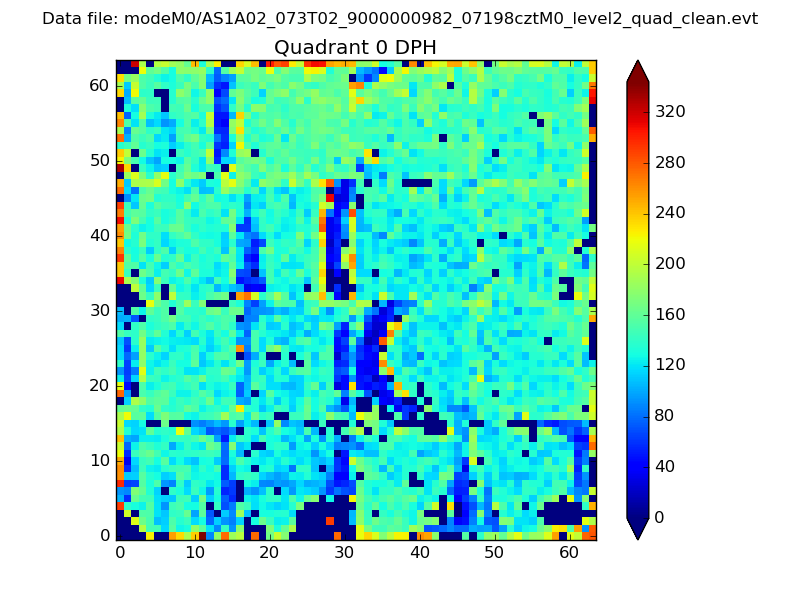 |
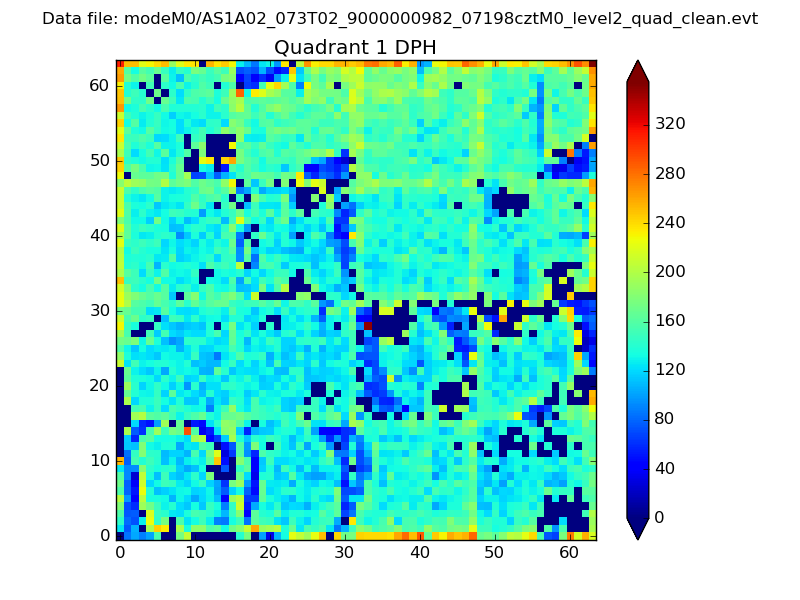 |
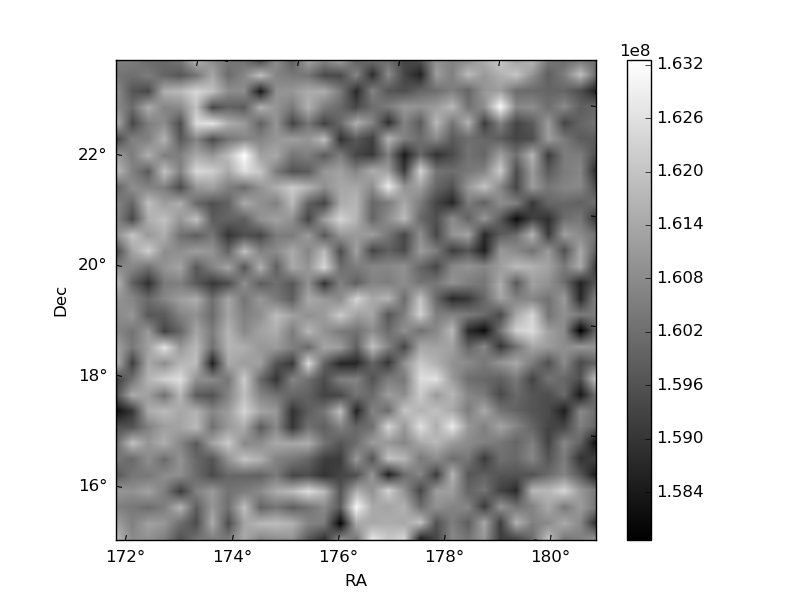
Quadrant B |
|---|---|---|---|
| Quadrant D | 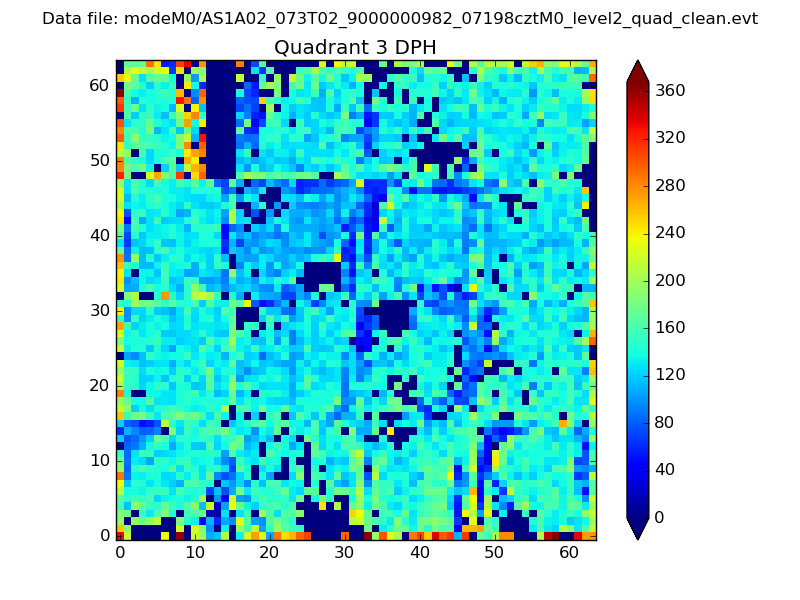 |
 |
Quadrant C |
| Plot type | Count rate plots | Images |
|---|---|---|
| Comparison with Poisson distribution Blue bars denote a histogram of data divided into 1 sec bins. Red curve is a Poisson curve with rate = median count rate of data. |
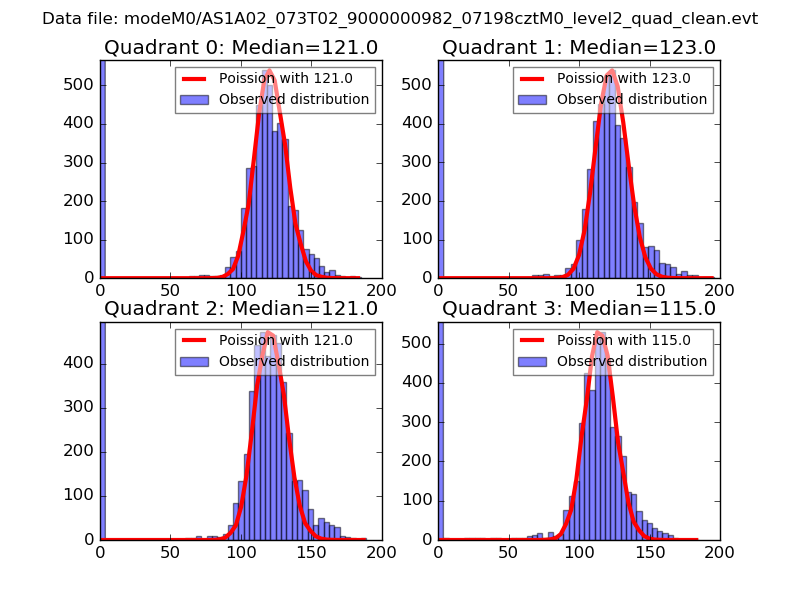 |
 |
| Quadrant-wise count rates Data is divided into 100 sec bins |
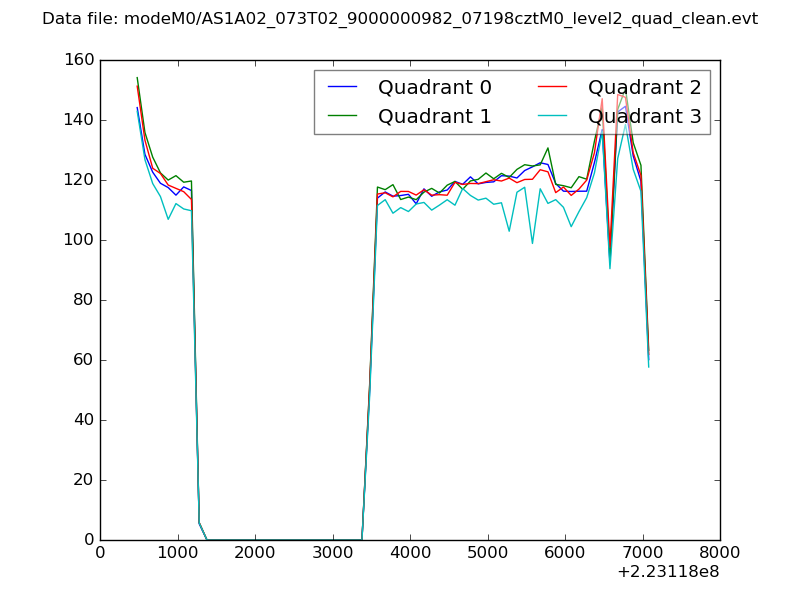 |
|
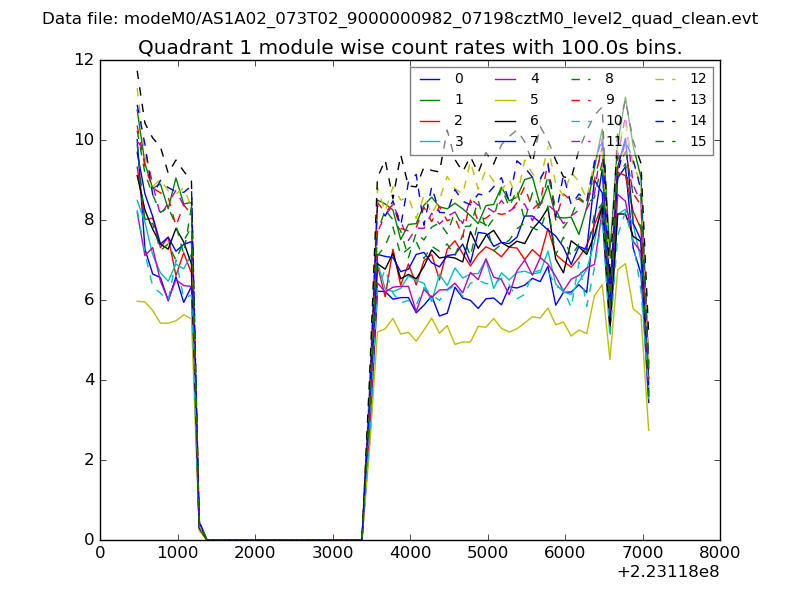
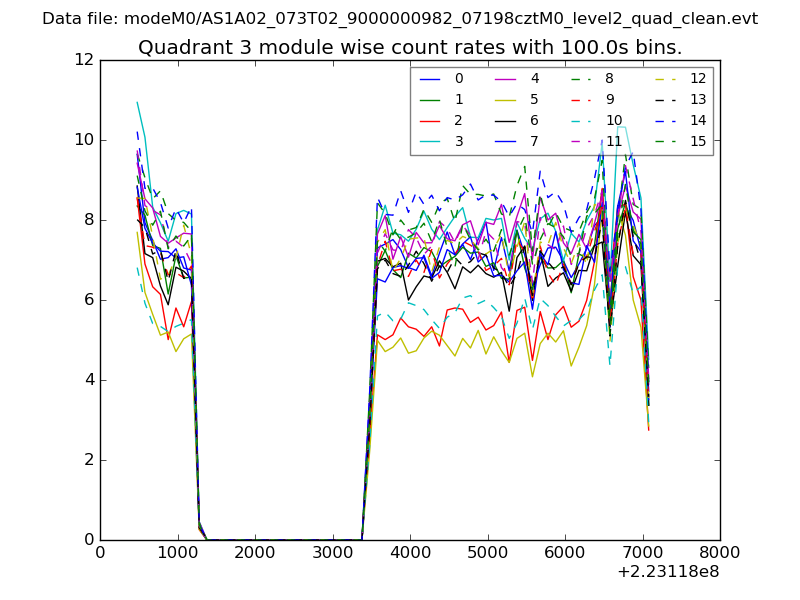
| Module-wise count rates for Quadrant A Data is divided into 100 sec bins |
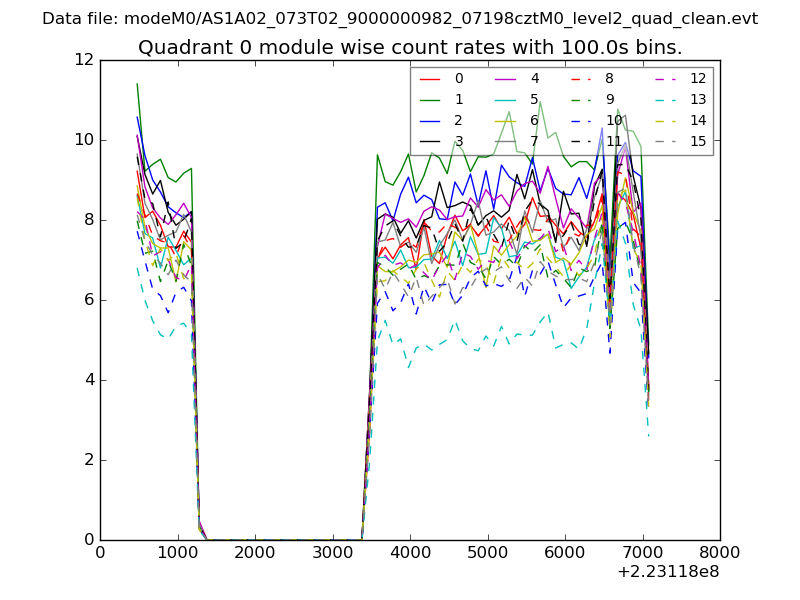 |
 |
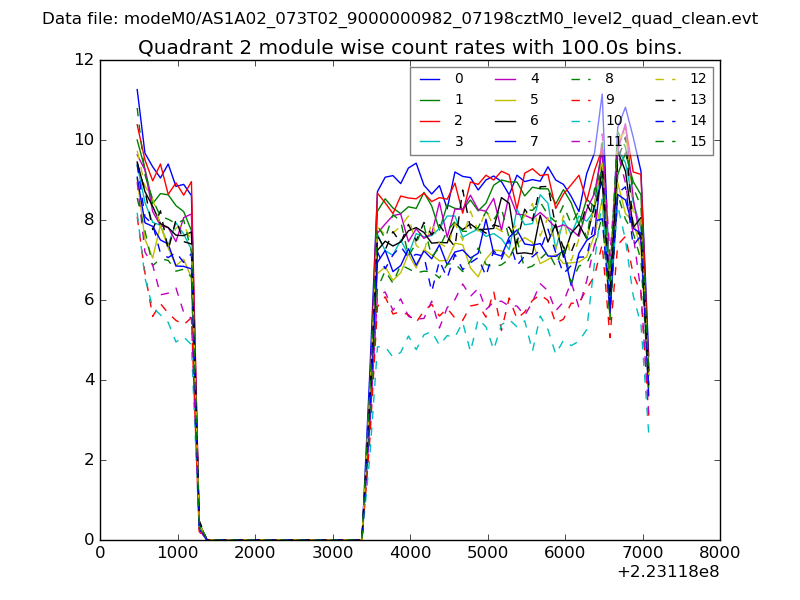
| Module-wise count rates for Quadrant B Data is divided into 100 sec bins |
 |
 |
| Module-wise count rates for Quadrant C Data is divided into 100 sec bins |
 |
 |
| Module-wise count rates for Quadrant D Data is divided into 100 sec bins |
 |
 |
| Parameter | Plot |
|---|---|
| CZT HV Monitor | 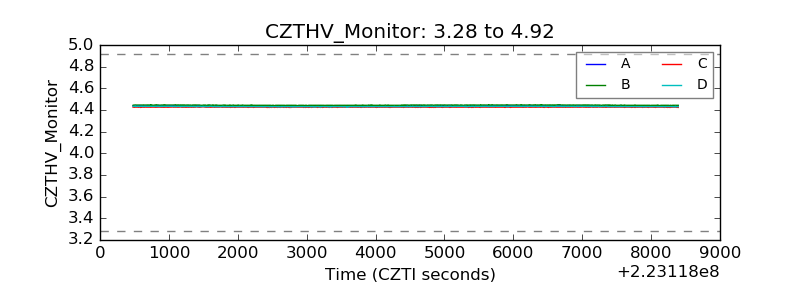 |
| D_VDD | 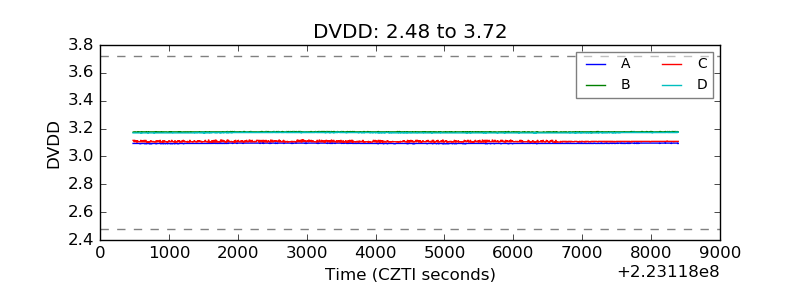 |
| Temperature 1 | 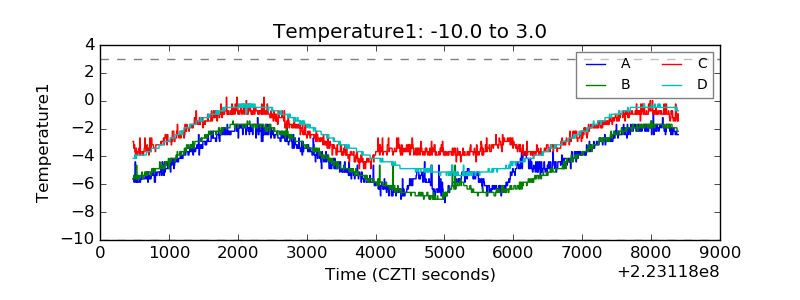 |
| Veto HV Monitor | 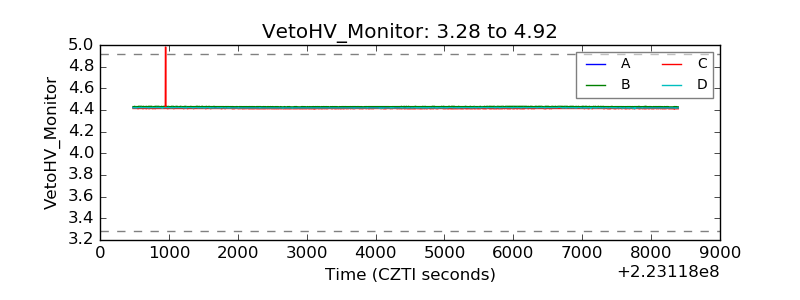 |
| Veto LLD |  |
| Alpha Counter | 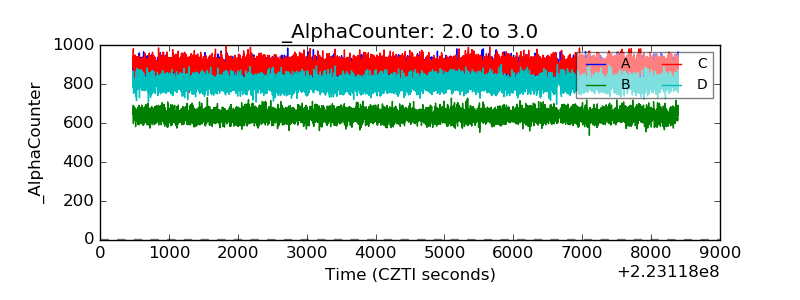 |
| _CPM_Rate | 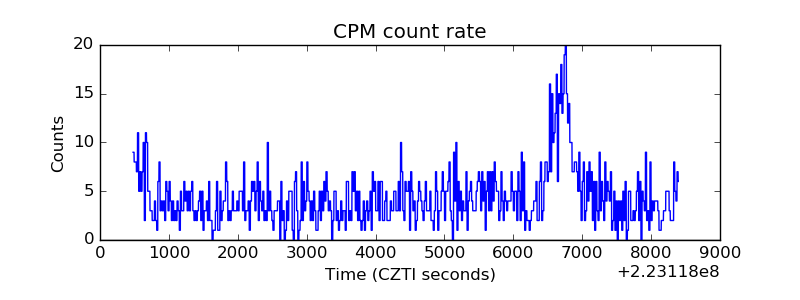 |
| CZT Counter | 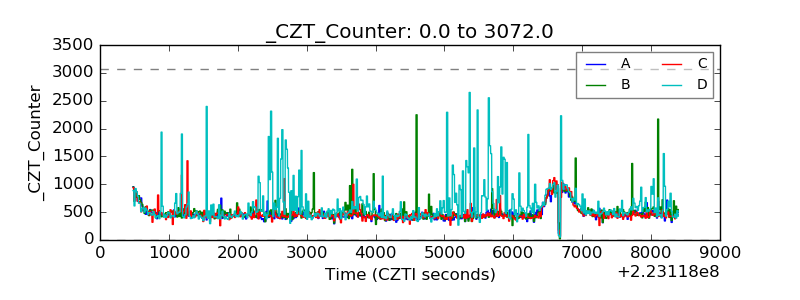 |
| +2.5 Volts monitor | 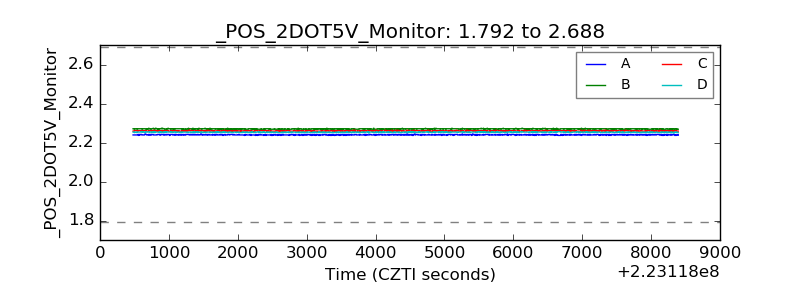 |
| +5 Volts monitor | 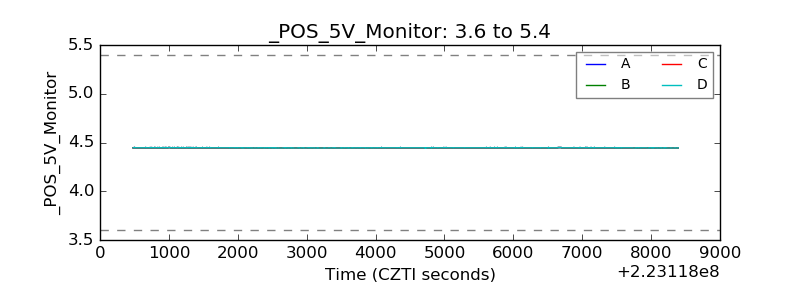 |
| _ROLL_ROT | 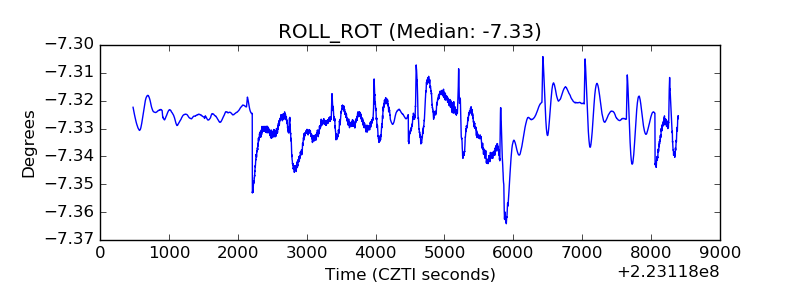 |
| _Roll_DEC | 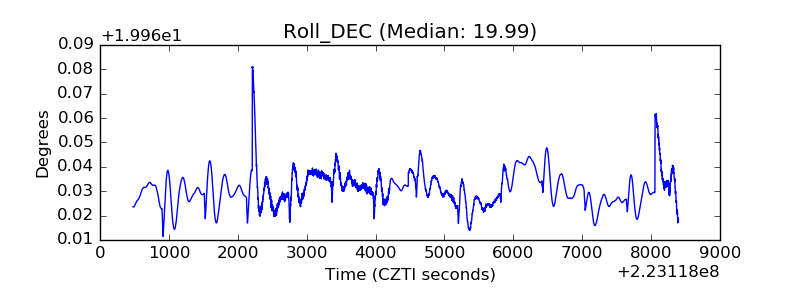 |
| _Roll_RA | 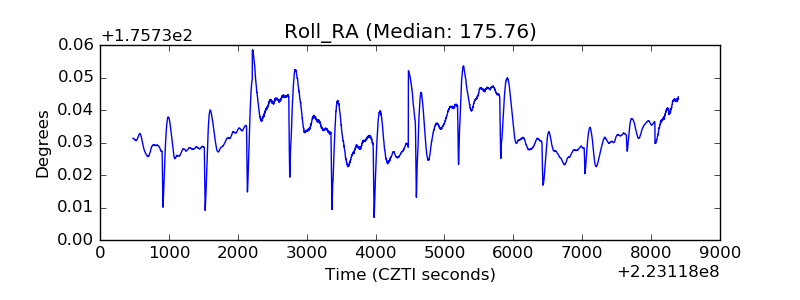 |
| Veto Counter | 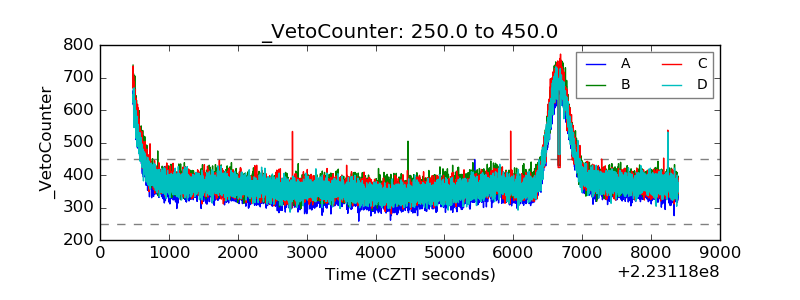 |