| Param | Original file | Final file |
|---|---|---|
| Filename | modeM0/AS1A02_073T02_9000000982_07379cztM0_level2.evt | modeM0/AS1A02_073T02_9000000982_07379cztM0_level2_quad_clean.evt |
| Size (bytes) | 7,145,280 | 2,473,920 |
| Size | 6.8 MB | 2.4 MB |
| Events in quadrant A | 54,484 | 14,634 |
| Events in quadrant B | 52,111 | 14,454 |
| Events in quadrant C | 48,419 | 14,052 |
| Events in quadrant D | 49,482 | 14,321 |
| Mode M9 | |||
|---|---|---|---|
| Quadrant | BADHDUFLAG | Total packets | Discarded packets |
| A | 0 | 1 | 1 |
| B | 0 | 1 | 1 |
| C | 1 | 1 | 1 |
| D | 1 | -1 | -1 |
| Mode SS | |||
|---|---|---|---|
| Quadrant | BADHDUFLAG | Total packets | Discarded packets |
| A | 0 | 8 | 6 |
| B | 0 | 8 | 4 |
| C | 0 | 8 | 6 |
| D | 0 | 7 | 5 |
| Mode M0 | |||
|---|---|---|---|
| Quadrant | BADHDUFLAG | Total packets | Discarded packets |
| A | 0 | 705 | 463 |
| B | 0 | 711 | 476 |
| C | 0 | 708 | 482 |
| D | 0 | 709 | 473 |
| Quadrant | Total seconds | Saturated seconds | Saturation percentage |
|---|---|---|---|
| A | 121 | 0 | 0.000000% |
| B | 117 | 0 | 0.000000% |
| C | 113 | 0 | 0.000000% |
| D | 118 | 0 | 0.000000% |
Noise dominated data is calculated using 1-second bins in cleaned event files. If a bin has >2000 counts, and if more than 50% of those come from <1% of pixels, then it is considered to be noise-dominated and hence unusable.
| Quadrant | # 1 sec bins | Bins with >0 counts | Bins with >2000 counts | High rate bins dominated by noise | Noise dominated (total time) | Noise dominated (detector-on time) | Marked lightcurve |
|---|---|---|---|---|---|---|---|
| A | 231 | 175 | 0 | 0 | 0.00% | 0.00% | 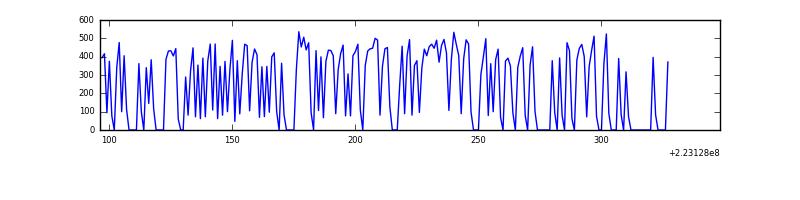 |
| B | 248 | 162 | 0 | 0 | 0.00% | 0.00% | 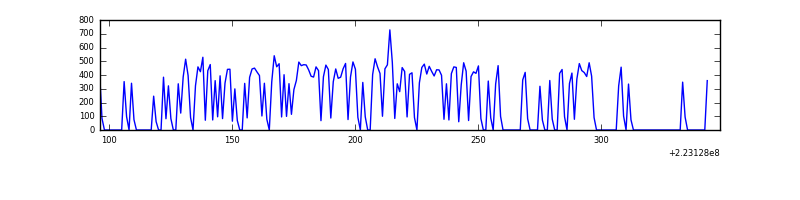 |
| C | 252 | 160 | 0 | 0 | 0.00% | 0.00% | 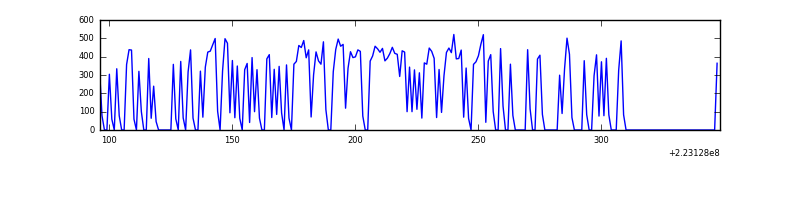 |
| D | 240 | 167 | 0 | 0 | 0.00% | 0.00% | 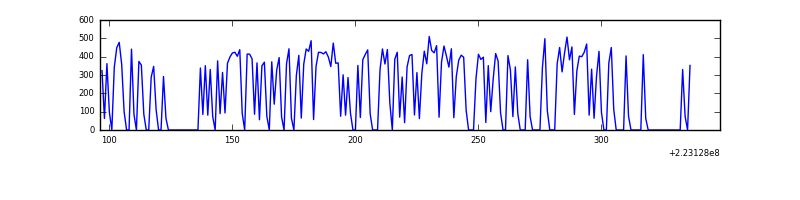 |
Top three noisy pixels from each quadrant. If the there are fewer than three noisy pixels in the level2.evt file, extra rows are filled as -1
| Pixel properties | Quadrant properties | ||||||
|---|---|---|---|---|---|---|---|
| Quadrant | DetID | PixID | Counts | Sigma | Mean | Median | Sigma |
| A | 13 | 14 | 664 | 135.49 | 13 | 13 | 4.8 |
| A | 0 | 226 | 128 | 23.93 | 13 | 13 | 4.8 |
| A | 12 | 194 | 123 | 22.89 | 13 | 13 | 4.8 |
| B | 12 | 111 | 293 | 62.42 | 13 | 13 | 4.5 |
| B | 11 | 111 | 204 | 42.58 | 13 | 13 | 4.5 |
| B | 14 | 111 | 158 | 32.32 | 13 | 13 | 4.5 |
| C | 8 | 222 | 150 | 30.65 | 12 | 12 | 4.5 |
| C | 13 | 61 | 101 | 19.77 | 12 | 12 | 4.5 |
| C | 9 | 68 | 46 | 7.55 | 12 | 12 | 4.5 |
| D | 2 | 216 | 964 | 196.27 | 12 | 12 | 4.9 |
| D | 14 | 226 | 139 | 26.18 | 12 | 12 | 4.9 |
| D | 1 | 52 | 61 | 10.1 | 12 | 12 | 4.9 |
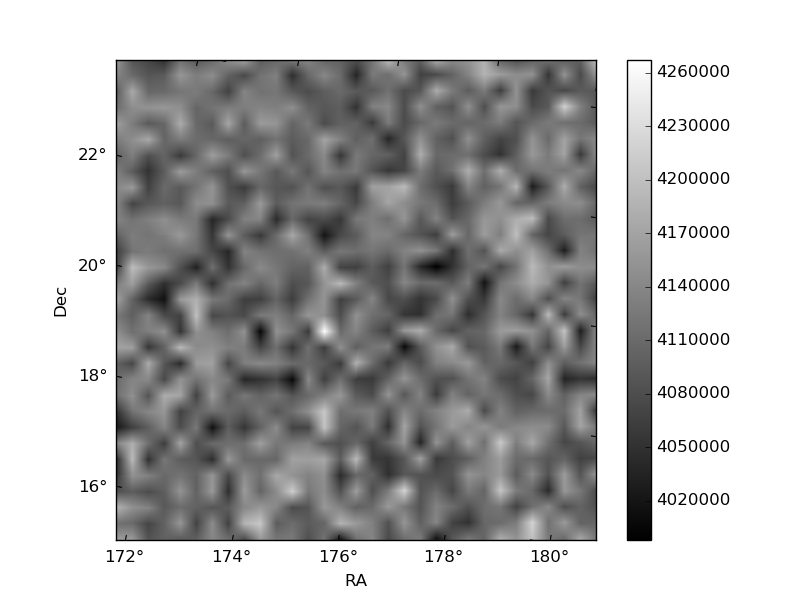
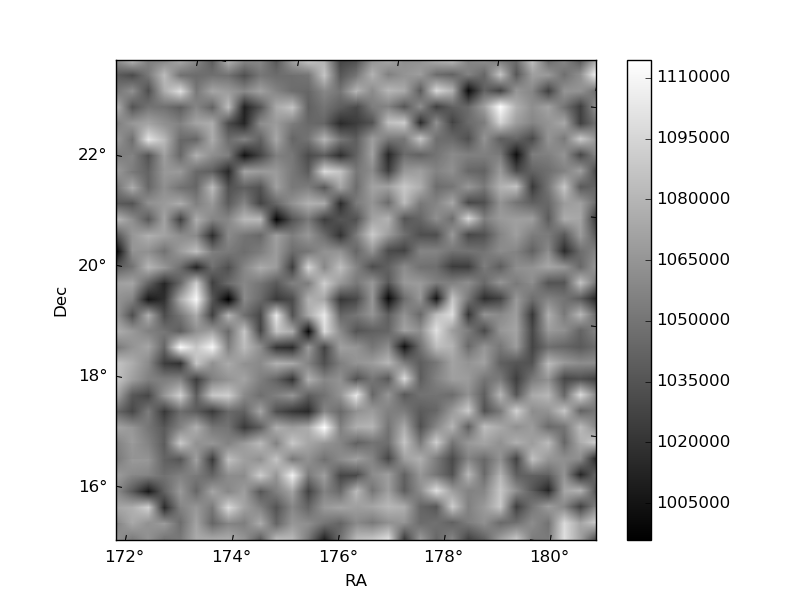
Histogram calculated using DETX and DETY for each event in the final _common_clean file
| Quadrant A | 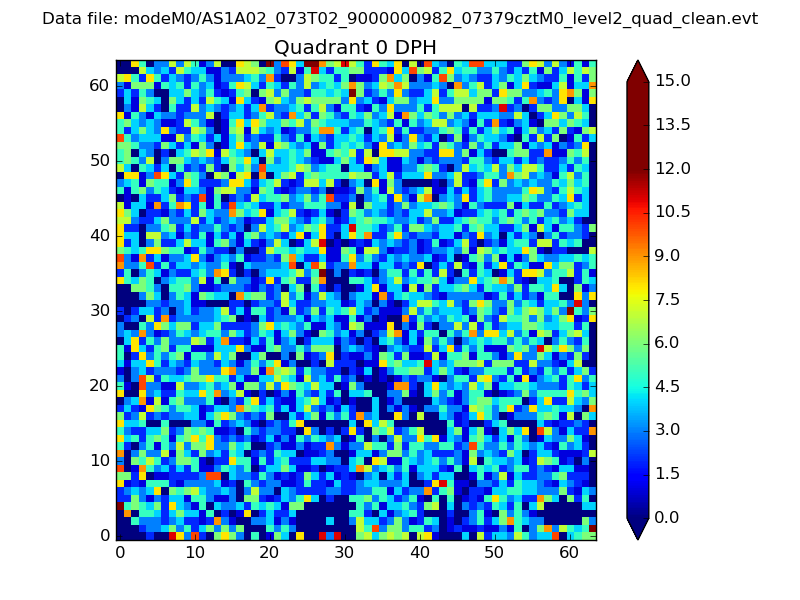 |
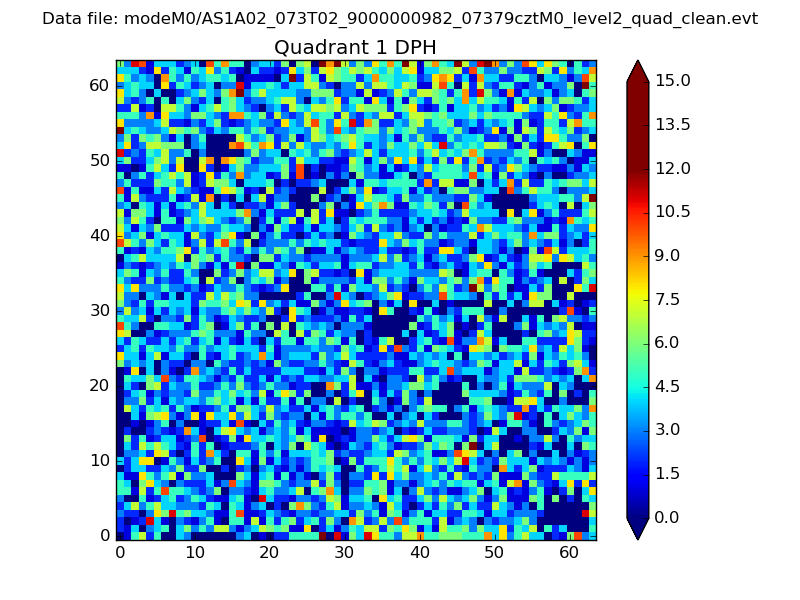 |
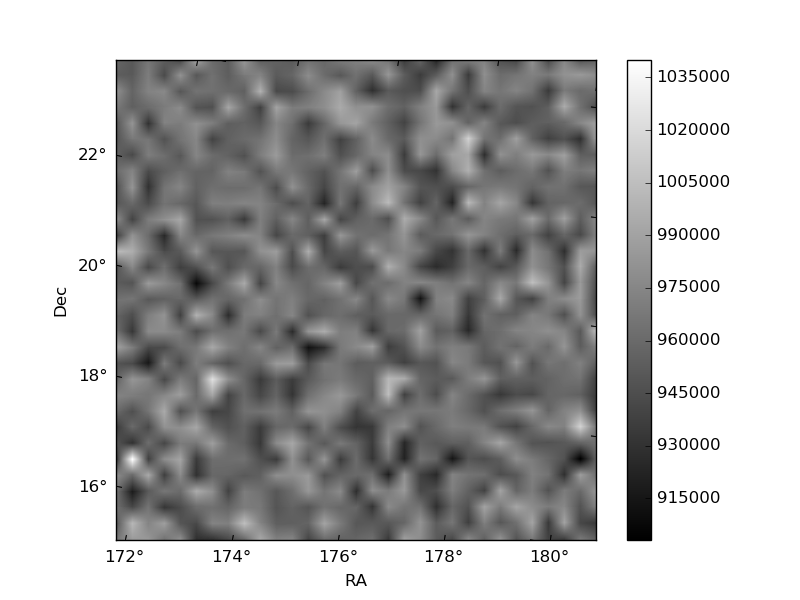
Quadrant B |
|---|---|---|---|
| Quadrant D | 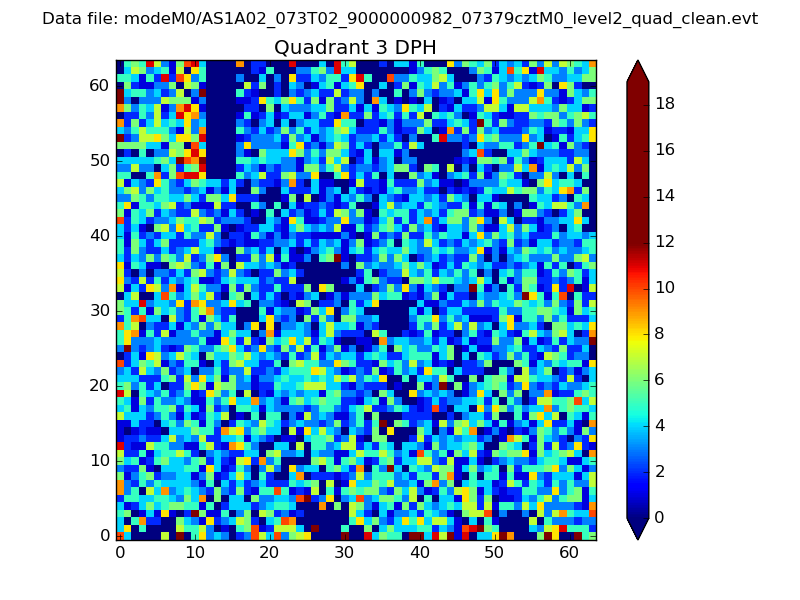 |
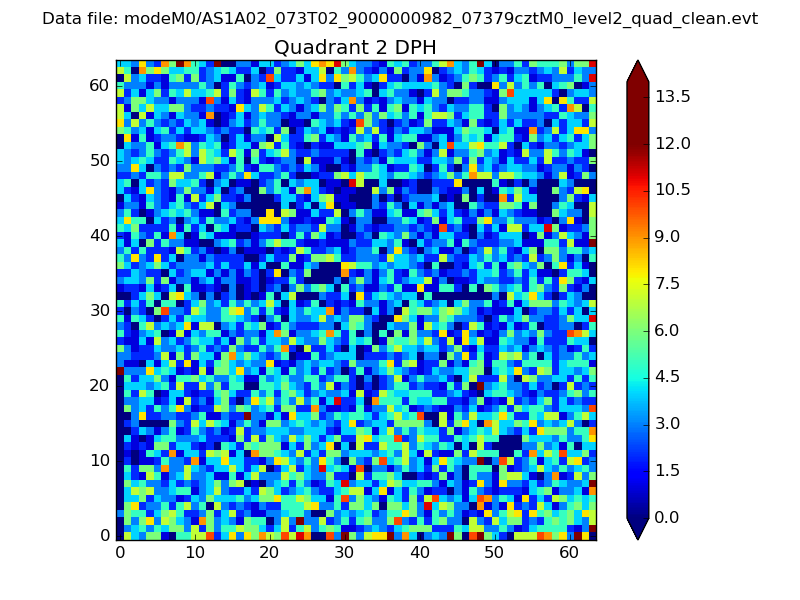 |
Quadrant C |
| Plot type | Count rate plots | Images |
|---|---|---|
| Comparison with Poisson distribution Blue bars denote a histogram of data divided into 1 sec bins. Red curve is a Poisson curve with rate = median count rate of data. |
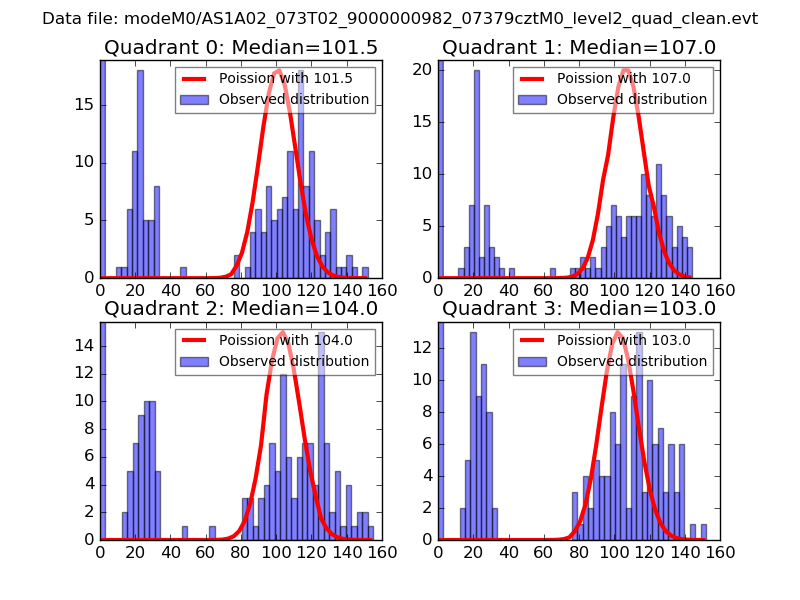 |
 |
| Quadrant-wise count rates Data is divided into 100 sec bins |
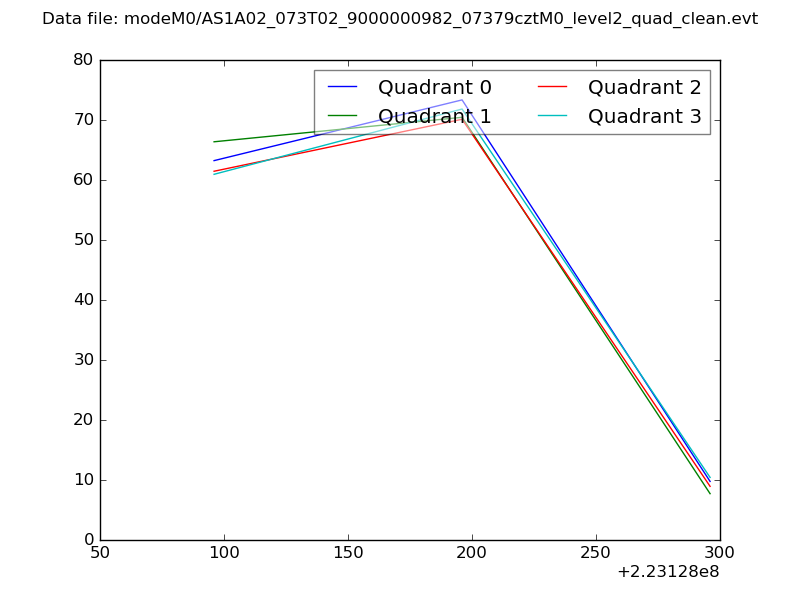 |
|
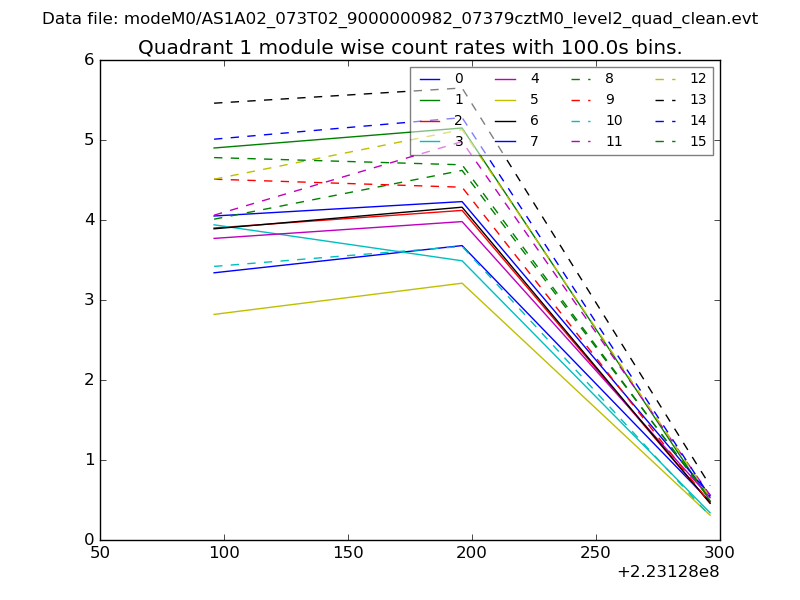
| Module-wise count rates for Quadrant A Data is divided into 100 sec bins |
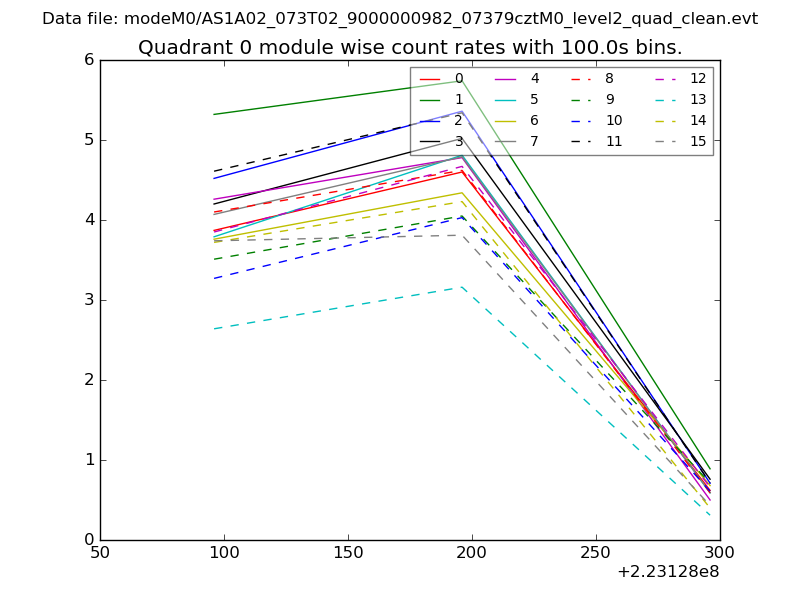 |
 |
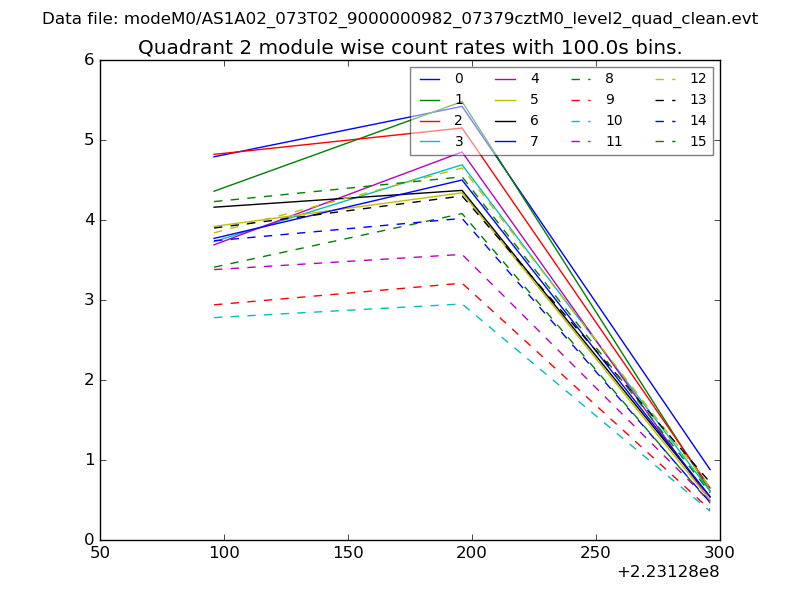
| Module-wise count rates for Quadrant B Data is divided into 100 sec bins |
 |
 |
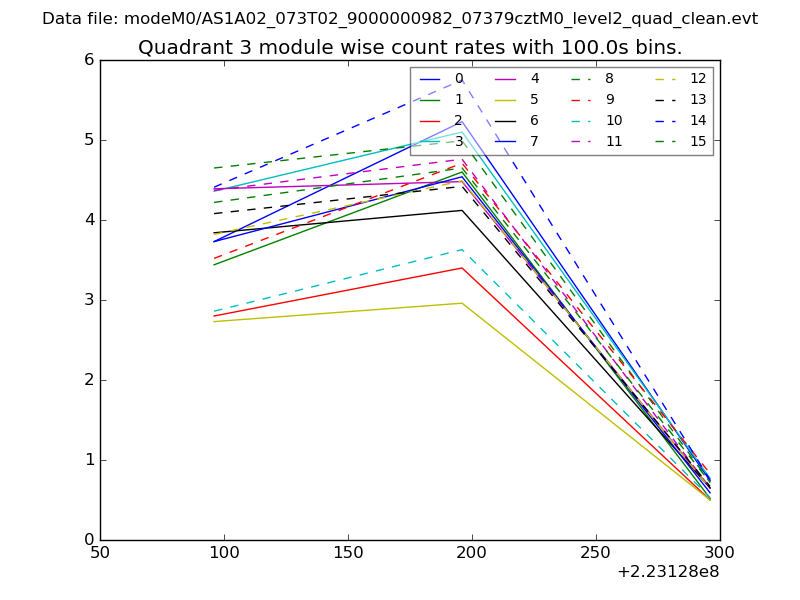
| Module-wise count rates for Quadrant C Data is divided into 100 sec bins |
 |
 |
| Module-wise count rates for Quadrant D Data is divided into 100 sec bins |
 |
 |
| Parameter | Plot |
|---|---|
| CZT HV Monitor | 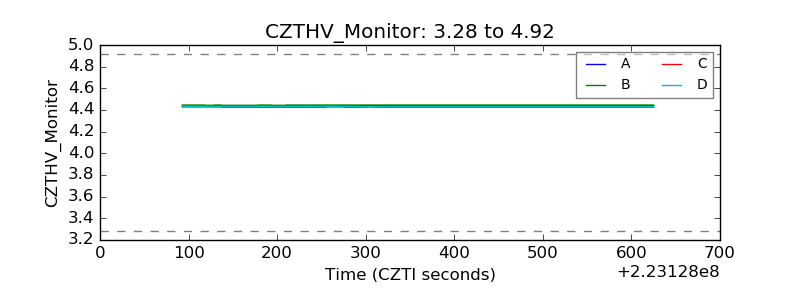 |
| D_VDD | 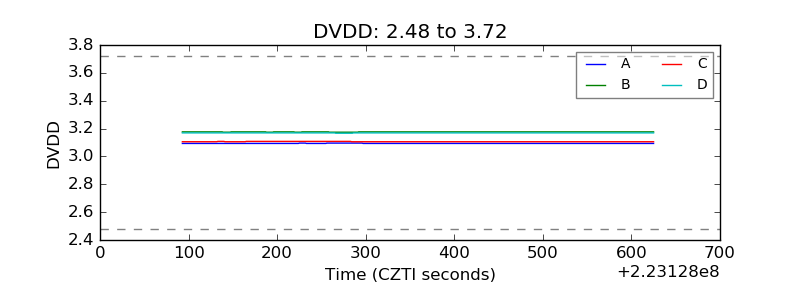 |
| Temperature 1 | 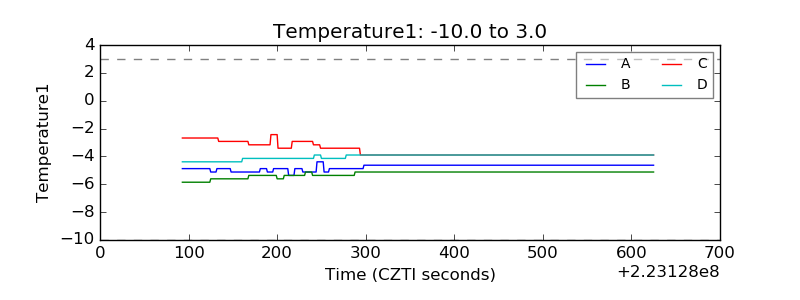 |
| Veto HV Monitor | 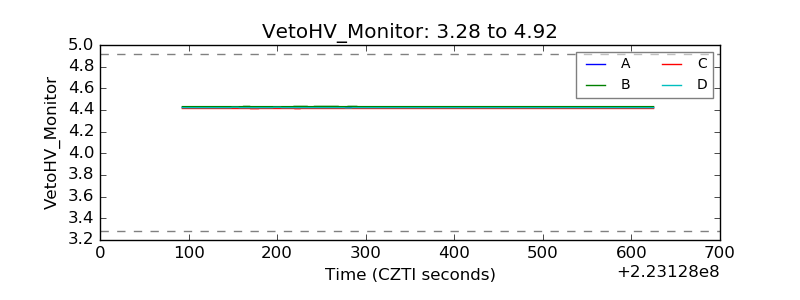 |
| Veto LLD | 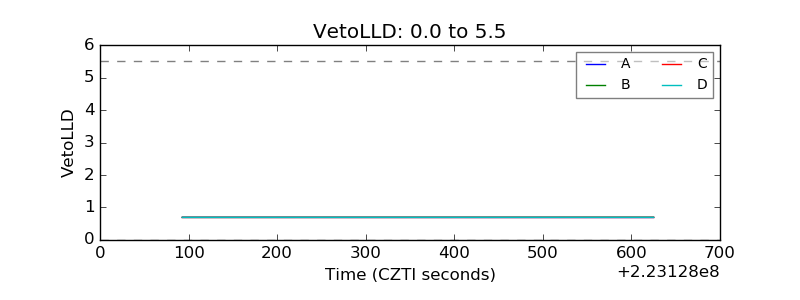 |
| Alpha Counter | 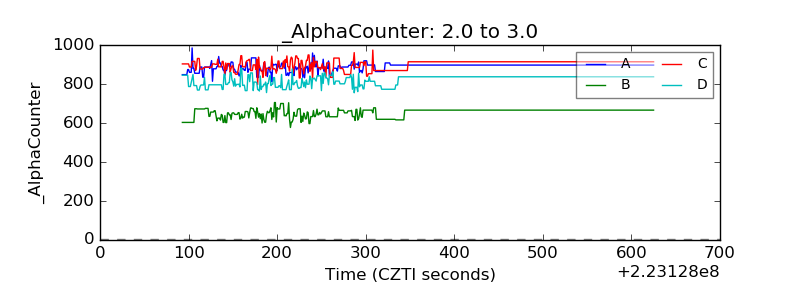 |
| _CPM_Rate | 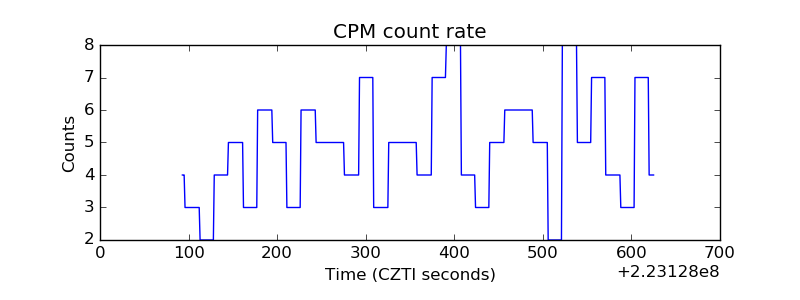 |
| CZT Counter | 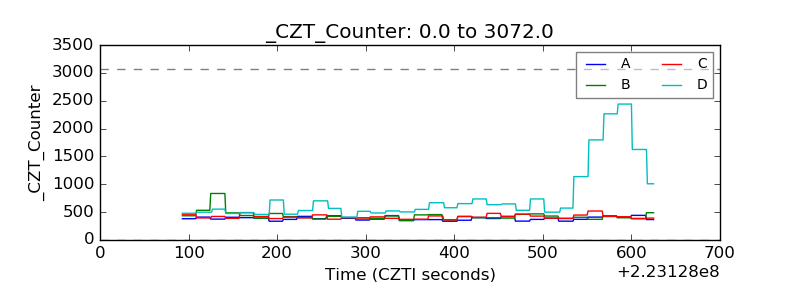 |
| +2.5 Volts monitor |  |
| +5 Volts monitor |  |
| _ROLL_ROT | 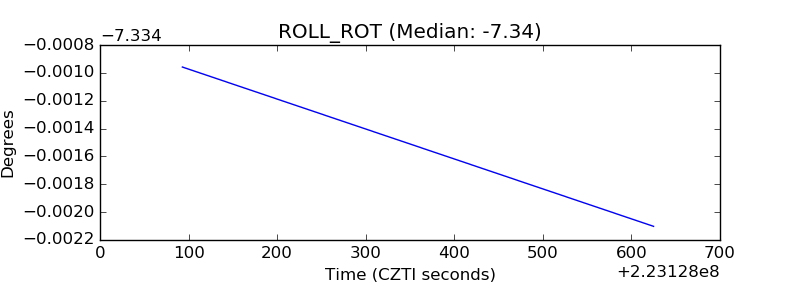 |
| _Roll_DEC | 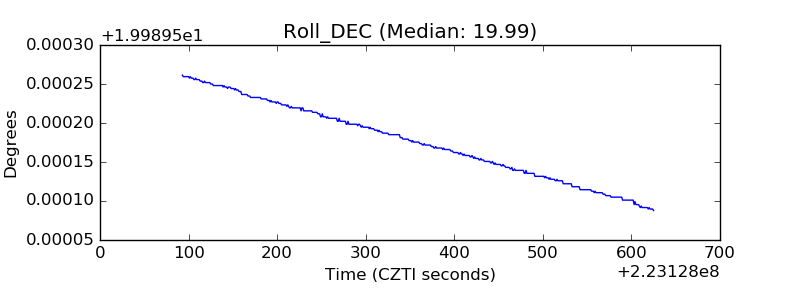 |
| _Roll_RA | 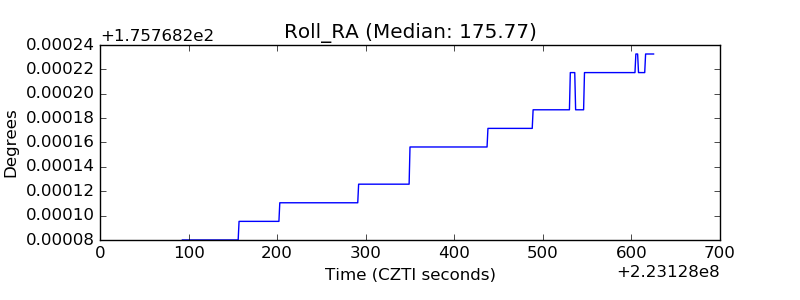 |
| Veto Counter | 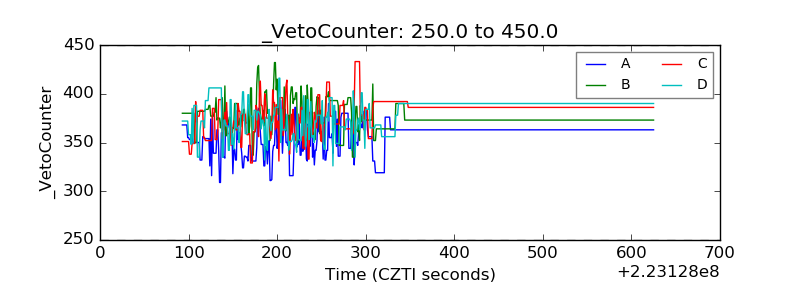 |