| Param | Original file | Final file |
|---|---|---|
| Filename | modeM0/AS1A02_176T01_9000000980cztM0_level2.fits | modeM0/AS1A02_176T01_9000000980cztM0_level2_quad_clean.evt |
| Size (bytes) | 543,617,280 | 751,521,600 |
| Size | 518.4 MB | 716.7 MB |
| Events in quadrant A | 3,235,050 | 4,856,653 |
| Events in quadrant B | 3,144,562 | 4,922,152 |
| Events in quadrant C | 3,220,138 | 4,669,119 |
| Events in quadrant D | 2,707,754 | 4,160,805 |
| Mode M9 | |||
|---|---|---|---|
| Quadrant | BADHDUFLAG | Total packets | Discarded packets |
| A | 0 | 77 | 0 |
| B | 0 | 77 | 0 |
| C | 0 | 77 | 0 |
| D | 0 | 77 | 0 |
| Mode M0 | |||
|---|---|---|---|
| Quadrant | BADHDUFLAG | Total packets | Discarded packets |
| A | 0 | 125455 | 0 |
| B | 0 | 128330 | 0 |
| C | 0 | 123528 | 0 |
| D | 0 | 164584 | 0 |
| Mode SS | |||
|---|---|---|---|
| Quadrant | BADHDUFLAG | Total packets | Discarded packets |
| A | 0 | 1234 | 0 |
| B | 0 | 1234 | 0 |
| C | 0 | 1234 | 0 |
| D | 0 | 1234 | 0 |
| Quadrant | Total seconds | Saturated seconds | Saturation percentage |
|---|---|---|---|
| A | 60553 | 1258 | 2.077519% |
| B | 60553 | 1107 | 1.828151% |
| C | 60553 | 719 | 1.187390% |
| D | 60553 | 2533 | 4.183112% |
Noise dominated data is calculated using 1-second bins in cleaned event files. If a bin has >2000 counts, and if more than 50% of those come from <1% of pixels, then it is considered to be noise-dominated and hence unusable.
| Quadrant | # 1 sec bins | Bins with >0 counts | Bins with >2000 counts | High rate bins dominated by noise | Noise dominated (total time) | Noise dominated (detector-on time) | Marked lightcurve |
|---|---|---|---|---|---|---|---|
| A | 68419 | 60544 | 0 | 0 | 0.00% | 0.00% |  |
| B | 68419 | 60544 | 0 | 0 | 0.00% | 0.00% |  |
| C | 68419 | 60547 | 0 | 0 | 0.00% | 0.00% |  |
| D | 68419 | 60521 | 0 | 0 | 0.00% | 0.00% |  |
Top three noisy pixels from each quadrant. If the there are fewer than three noisy pixels in the level2.evt file, extra rows are filled as -1
| Pixel properties | Quadrant properties | ||||||
|---|---|---|---|---|---|---|---|
| Quadrant | DetID | PixID | Counts | Sigma | Mean | Median | Sigma |
| A | 14 | 188 | 3338 | 12.0 | 840 | 785 | 212.7 |
| A | 0 | 29 | 3059 | 10.69 | 840 | 785 | 212.7 |
| A | 14 | 204 | 2817 | 9.55 | 840 | 785 | 212.7 |
| B | 2 | 9 | 2727 | 11.79 | 830 | 791 | 164.2 |
| B | 14 | 254 | 2223 | 8.72 | 830 | 791 | 164.2 |
| B | 12 | 226 | 2196 | 8.56 | 830 | 791 | 164.2 |
| C | 1 | 80 | 2497 | 7.61 | 848 | 784 | 225.2 |
| C | 1 | 81 | 2484 | 7.55 | 848 | 784 | 225.2 |
| C | 12 | 241 | 2295 | 6.71 | 848 | 784 | 225.2 |
| D | 3 | 14 | 2035 | 6.41 | 770 | 698 | 208.4 |
| D | 6 | 231 | 1978 | 6.14 | 770 | 698 | 208.4 |
| D | 11 | 82 | 1976 | 6.13 | 770 | 698 | 208.4 |
Histogram calculated using DETX and DETY for each event in the final _common_clean file
| Quadrant A | 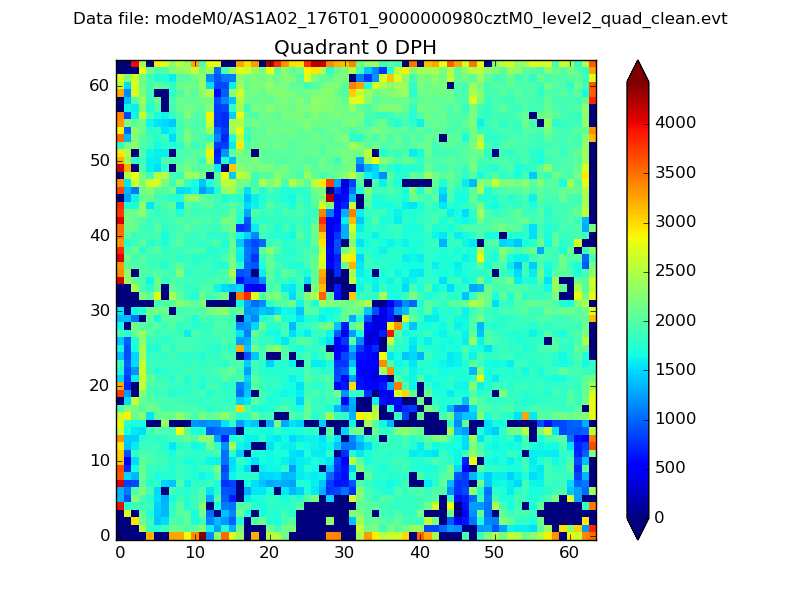 |
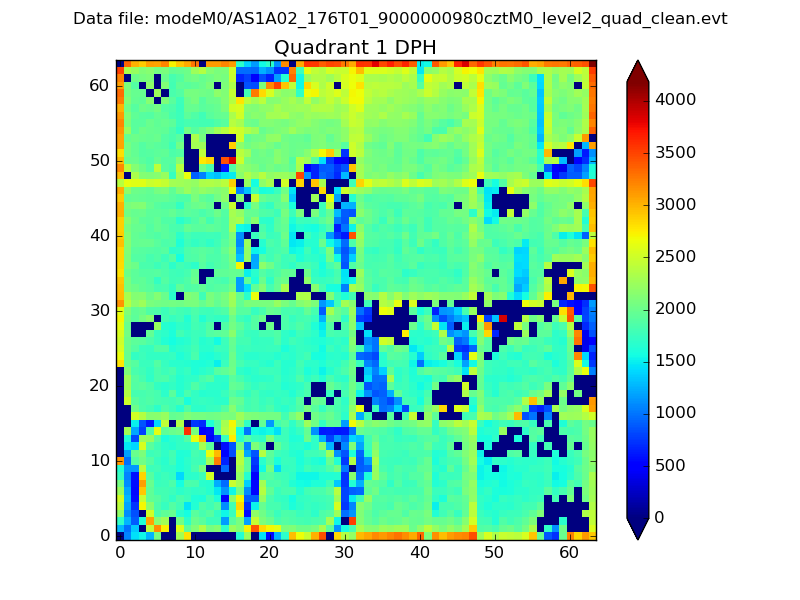 |
Quadrant B |
|---|---|---|---|
| Quadrant D |  |
 |
Quadrant C |
| Plot type | Count rate plots | Images |
|---|---|---|
| Comparison with Poisson distribution Blue bars denote a histogram of data divided into 1 sec bins. Red curve is a Poisson curve with rate = median count rate of data. |
 |
 |
| Quadrant-wise count rates Data is divided into 100 sec bins |
 |
|
| Module-wise count rates for Quadrant A Data is divided into 100 sec bins |
 |
 |
| Module-wise count rates for Quadrant B Data is divided into 100 sec bins |
 |
 |
| Module-wise count rates for Quadrant C Data is divided into 100 sec bins |
 |
 |
| Module-wise count rates for Quadrant D Data is divided into 100 sec bins |
 |
 |
| Parameter | Plot |
|---|---|
| CZT HV Monitor |  |
| D_VDD |  |
| Temperature 1 |  |
| Veto HV Monitor |  |
| Veto LLD |  |
| Alpha Counter |  |
| _CPM_Rate |  |
| CZT Counter |  |
| +2.5 Volts monitor |  |
| +5 Volts monitor |  |
| _ROLL_ROT |  |
| _Roll_DEC |  |
| _Roll_RA |  |
| Veto Counter |  |