| Param | Original file | Final file |
|---|---|---|
| Filename | modeM0/AS1A02_176T01_9000000980_07180cztM0_level2.evt | modeM0/AS1A02_176T01_9000000980_07180cztM0_level2_quad_clean.evt |
| Size (bytes) | 332,176,320 | 89,588,160 |
| Size | 316.8 MB | 85.4 MB |
| Events in quadrant A | 2,450,912 | 589,487 |
| Events in quadrant B | 2,422,173 | 616,656 |
| Events in quadrant C | 2,186,574 | 598,471 |
| Events in quadrant D | 2,668,420 | 567,108 |
| Mode M9 | |||
|---|---|---|---|
| Quadrant | BADHDUFLAG | Total packets | Discarded packets |
| A | 0 | 12 | 0 |
| B | 0 | 12 | 0 |
| C | 0 | 12 | 0 |
| D | 0 | 12 | 0 |
| Mode M0 | |||
|---|---|---|---|
| Quadrant | BADHDUFLAG | Total packets | Discarded packets |
| A | 0 | 10578 | 2 |
| B | 0 | 10417 | 1 |
| C | 0 | 9894 | 1 |
| D | 0 | 11120 | 1 |
| Mode SS | |||
|---|---|---|---|
| Quadrant | BADHDUFLAG | Total packets | Discarded packets |
| A | 0 | 100 | 0 |
| B | 0 | 100 | 0 |
| C | 0 | 100 | 0 |
| D | 0 | 100 | 0 |
| Quadrant | Total seconds | Saturated seconds | Saturation percentage |
|---|---|---|---|
| A | 4863 | 254 | 5.223113% |
| B | 4863 | 36 | 0.740284% |
| C | 4863 | 13 | 0.267325% |
| D | 4863 | 36 | 0.740284% |
Noise dominated data is calculated using 1-second bins in cleaned event files. If a bin has >2000 counts, and if more than 50% of those come from <1% of pixels, then it is considered to be noise-dominated and hence unusable.
| Quadrant | # 1 sec bins | Bins with >0 counts | Bins with >2000 counts | High rate bins dominated by noise | Noise dominated (total time) | Noise dominated (detector-on time) | Marked lightcurve |
|---|---|---|---|---|---|---|---|
| A | 6098 | 4864 | 2 | 2 | 0.03% | 0.04% | 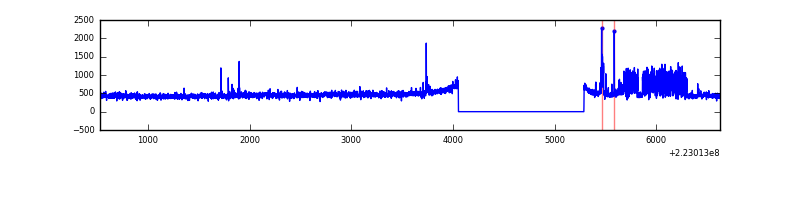 |
| B | 6098 | 4864 | 19 | 19 | 0.31% | 0.39% | 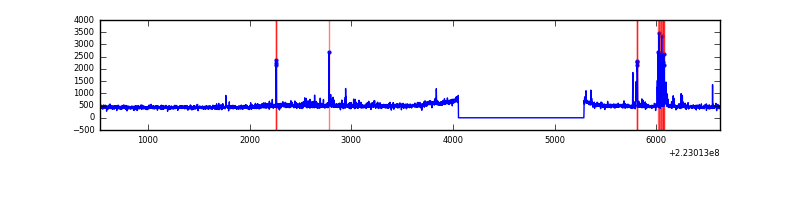 |
| C | 6098 | 4864 | 0 | 0 | 0.00% | 0.00% | 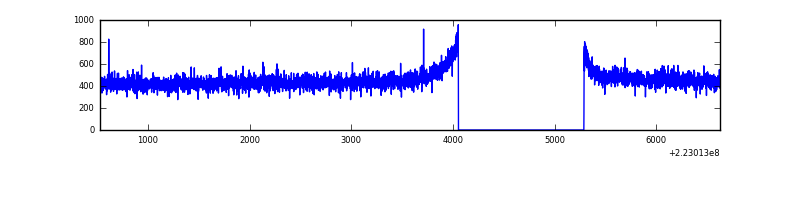 |
| D | 6098 | 4864 | 17 | 17 | 0.28% | 0.35% | 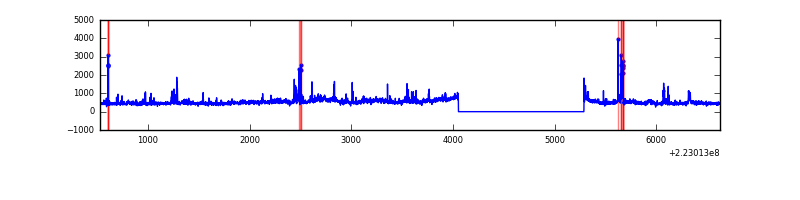 |
Top three noisy pixels from each quadrant. If the there are fewer than three noisy pixels in the level2.evt file, extra rows are filled as -1
| Pixel properties | Quadrant properties | ||||||
|---|---|---|---|---|---|---|---|
| Quadrant | DetID | PixID | Counts | Sigma | Mean | Median | Sigma |
| A | 14 | 111 | 256935 | 2254.12 | 561 | 551 | 113.7 |
| A | 14 | 238 | 17429 | 148.39 | 561 | 551 | 113.7 |
| A | 8 | 15 | 12620 | 106.11 | 561 | 551 | 113.7 |
| B | 4 | 81 | 98551 | 907.63 | 574 | 561 | 108.0 |
| B | 0 | 214 | 74836 | 687.97 | 574 | 561 | 108.0 |
| B | 0 | 219 | 16348 | 146.23 | 574 | 561 | 108.0 |
| C | 8 | 128 | 5100 | 35.05 | 558 | 558 | 129.6 |
| C | 13 | 61 | 4214 | 28.21 | 558 | 558 | 129.6 |
| C | 8 | 112 | 2508 | 15.05 | 558 | 558 | 129.6 |
| D | 8 | 195 | 233139 | 1736.87 | 553 | 535 | 133.9 |
| D | 2 | 216 | 129310 | 961.57 | 553 | 535 | 133.9 |
| D | 2 | 14 | 48707 | 359.7 | 553 | 535 | 133.9 |
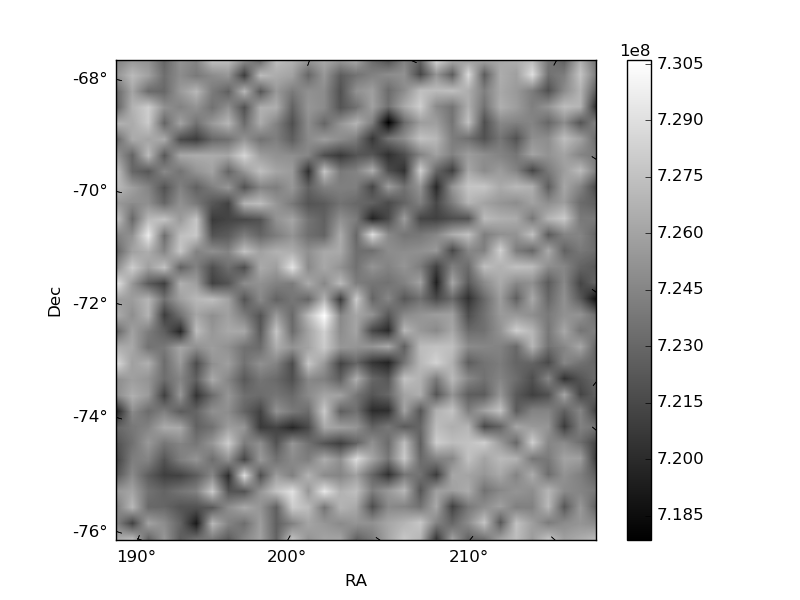
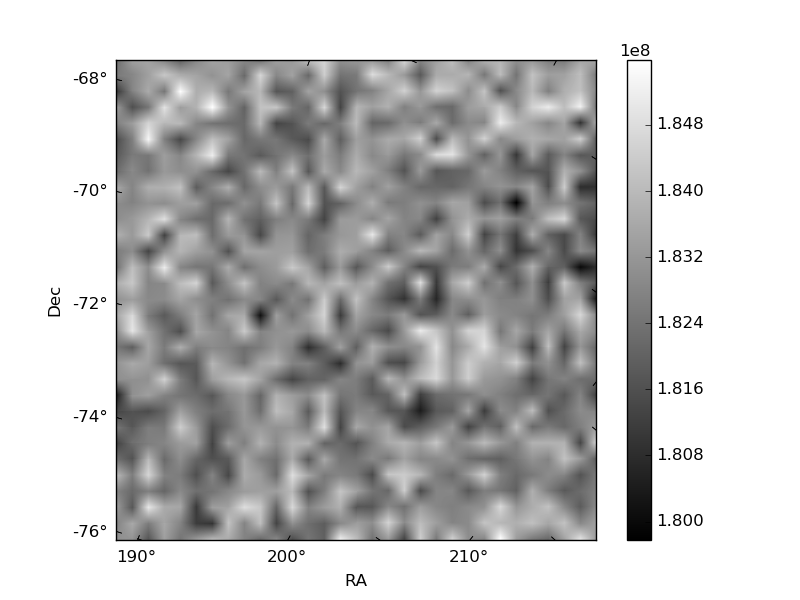
Histogram calculated using DETX and DETY for each event in the final _common_clean file
| Quadrant A | 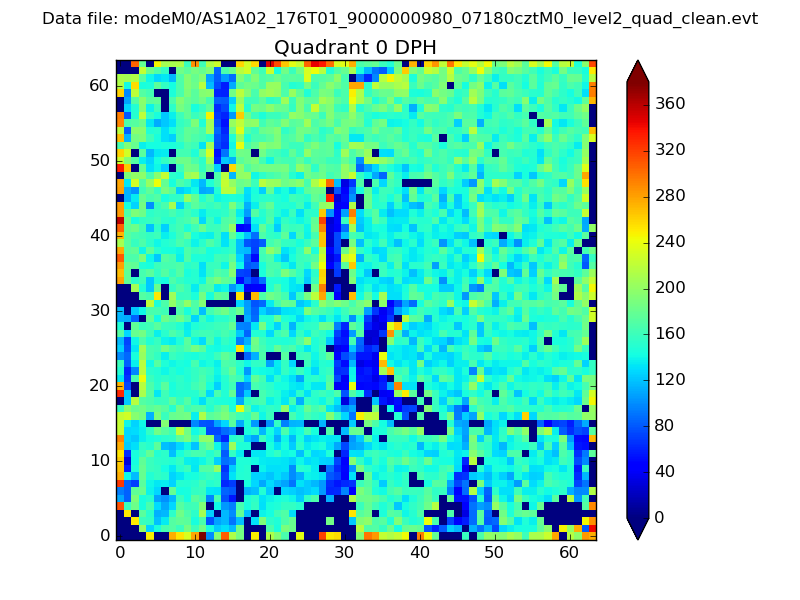 |
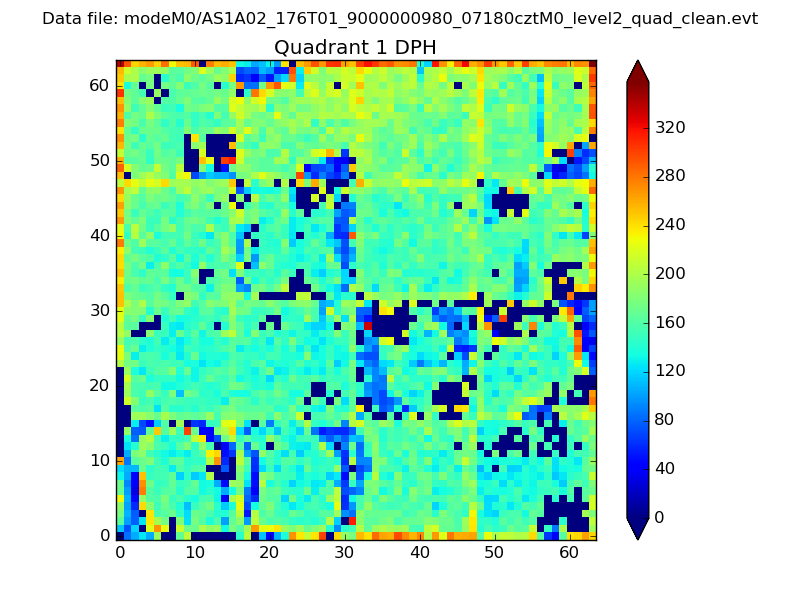 |
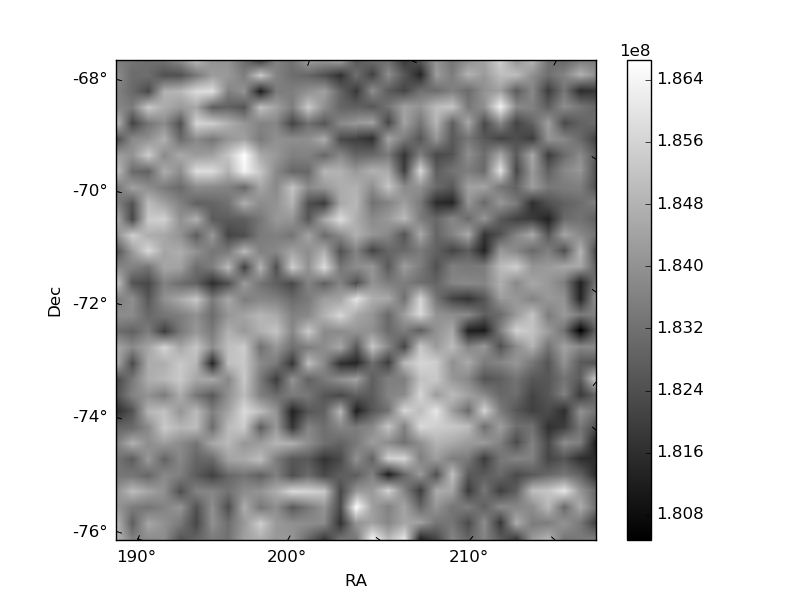
Quadrant B |
|---|---|---|---|
| Quadrant D | 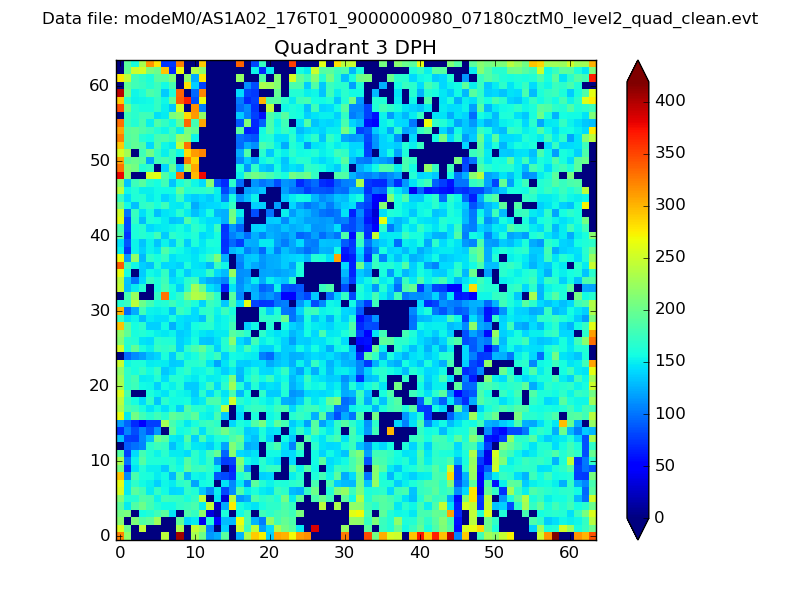 |
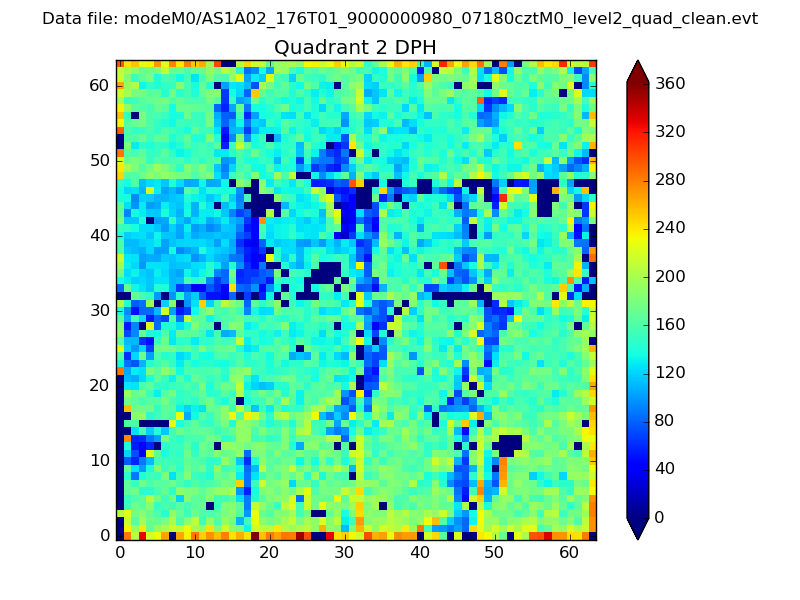 |
Quadrant C |
| Plot type | Count rate plots | Images |
|---|---|---|
| Comparison with Poisson distribution Blue bars denote a histogram of data divided into 1 sec bins. Red curve is a Poisson curve with rate = median count rate of data. |
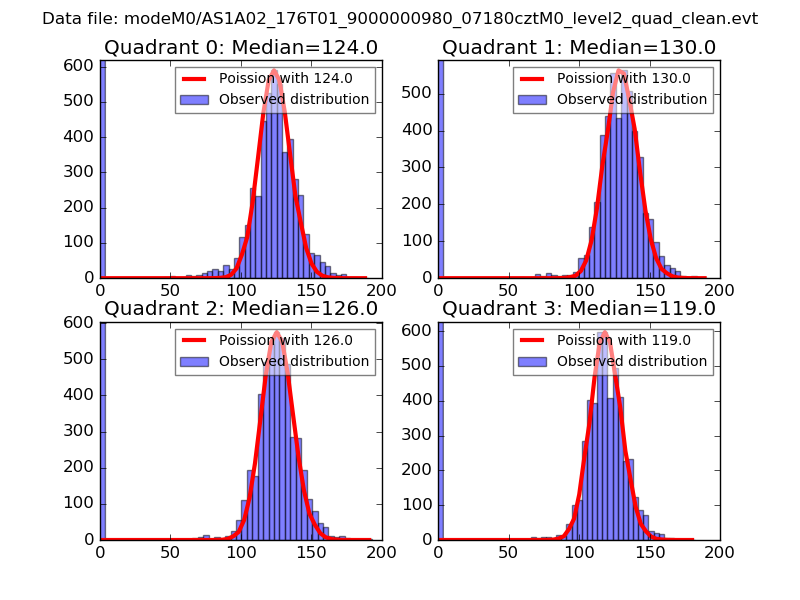 |
 |
| Quadrant-wise count rates Data is divided into 100 sec bins |
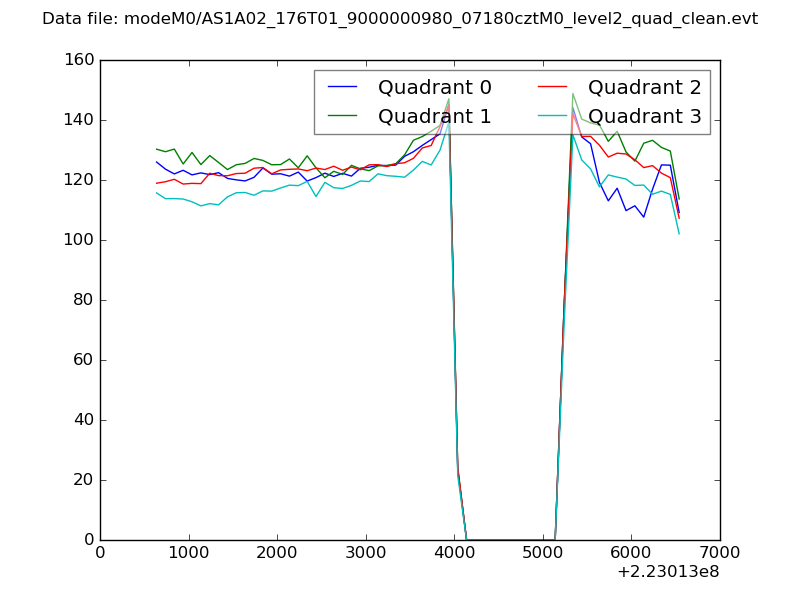 |
|
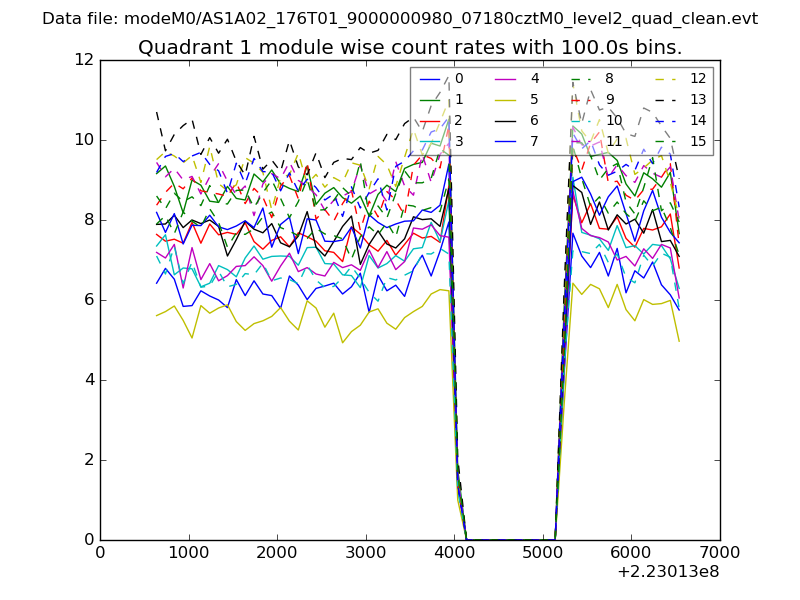
| Module-wise count rates for Quadrant A Data is divided into 100 sec bins |
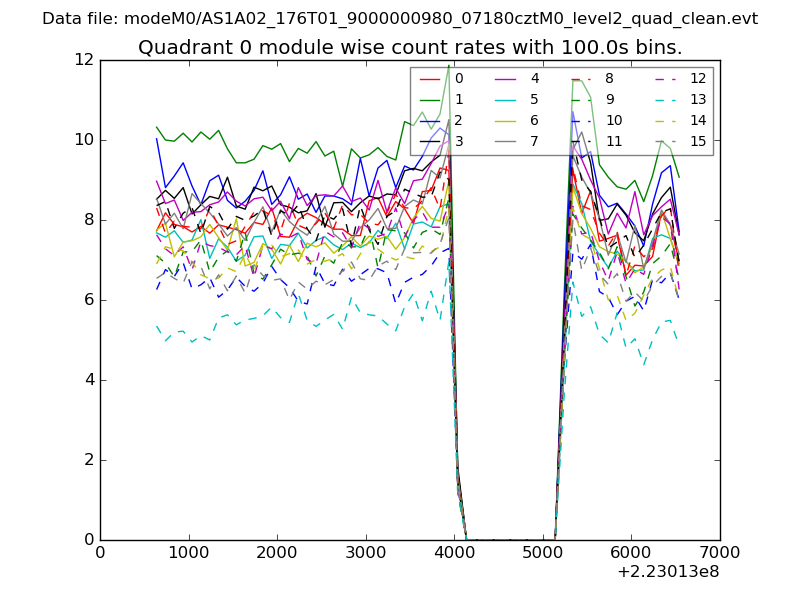 |
 |
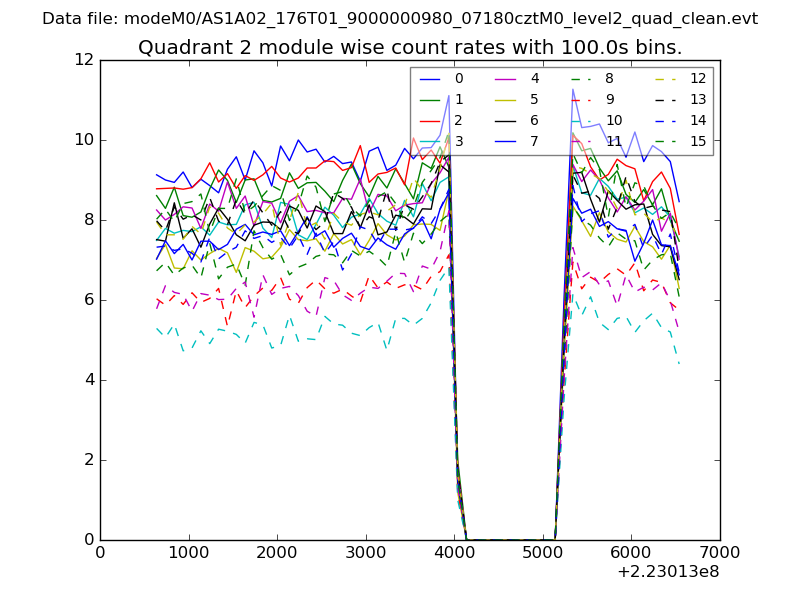
| Module-wise count rates for Quadrant B Data is divided into 100 sec bins |
 |
 |
| Module-wise count rates for Quadrant C Data is divided into 100 sec bins |
 |
 |
| Module-wise count rates for Quadrant D Data is divided into 100 sec bins |
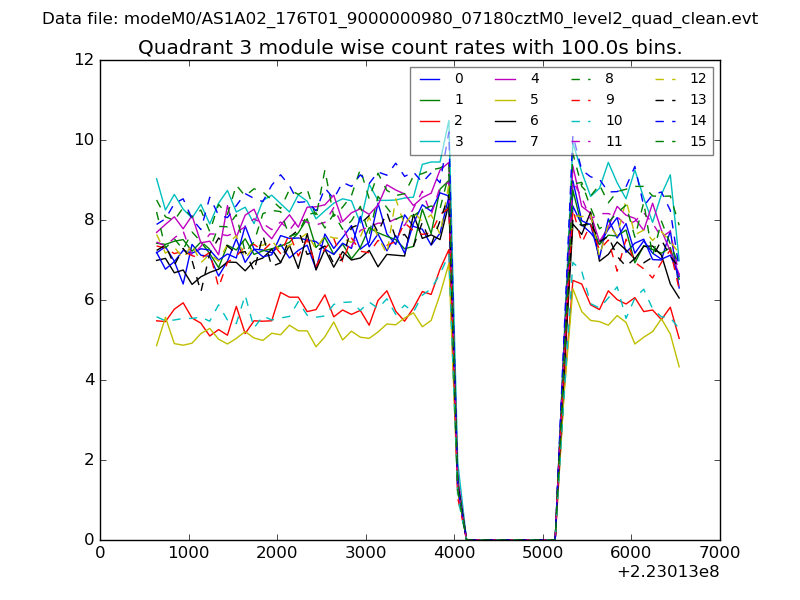 |
 |
| Parameter | Plot |
|---|---|
| CZT HV Monitor | 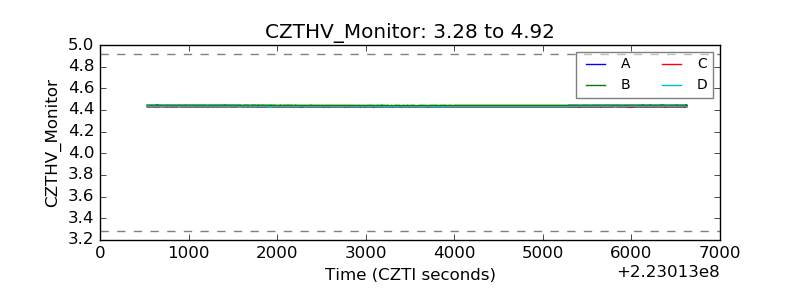 |
| D_VDD | 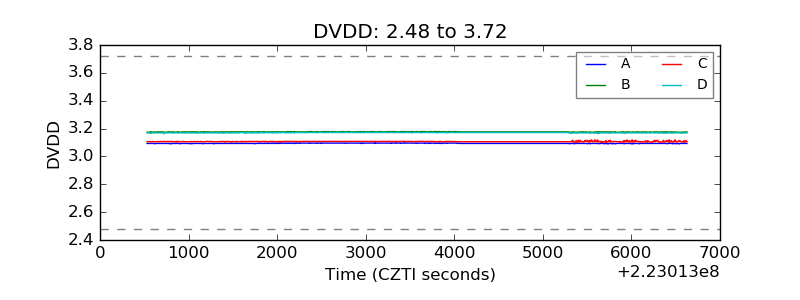 |
| Temperature 1 | 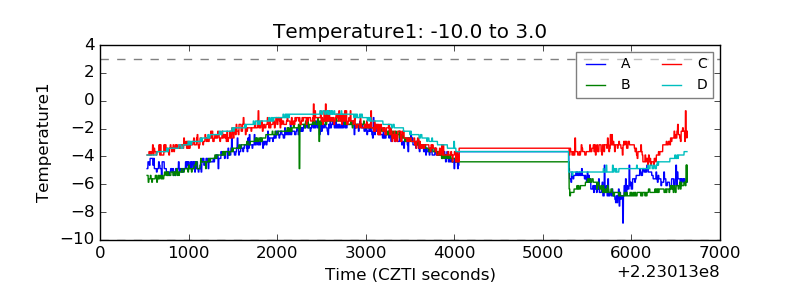 |
| Veto HV Monitor | 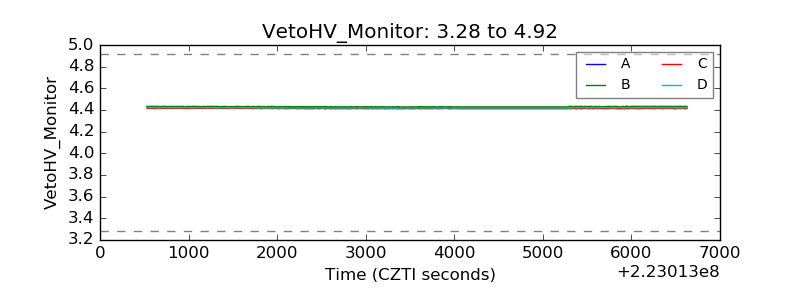 |
| Veto LLD | 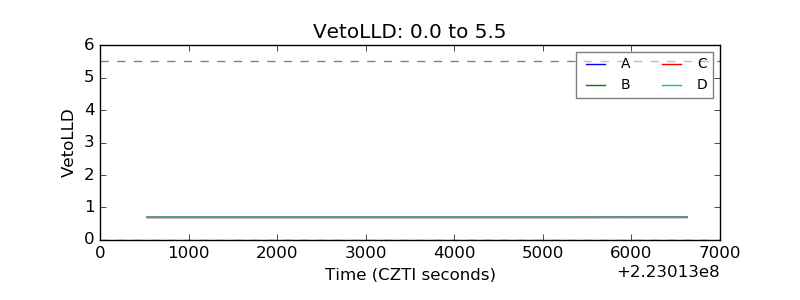 |
| Alpha Counter | 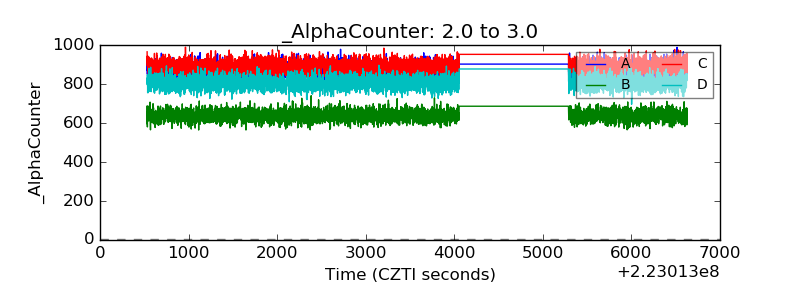 |
| _CPM_Rate | 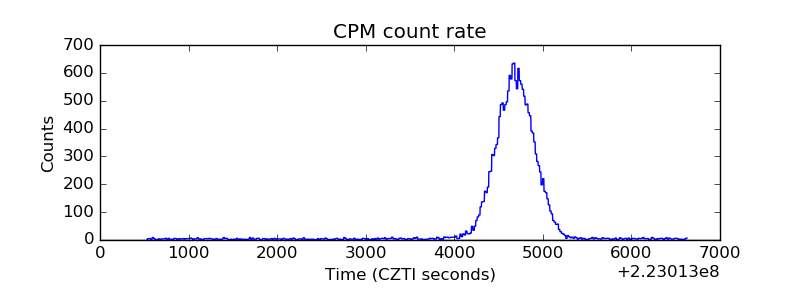 |
| CZT Counter | 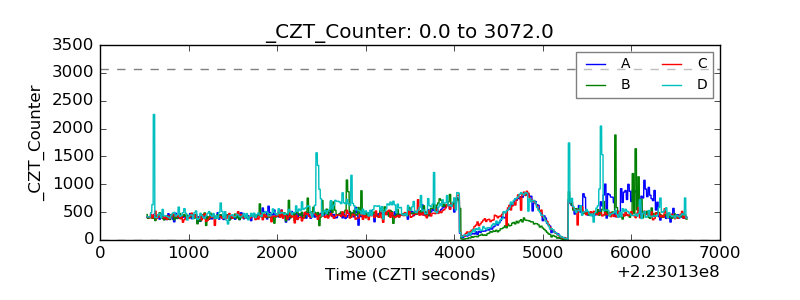 |
| +2.5 Volts monitor |  |
| +5 Volts monitor |  |
| _ROLL_ROT | 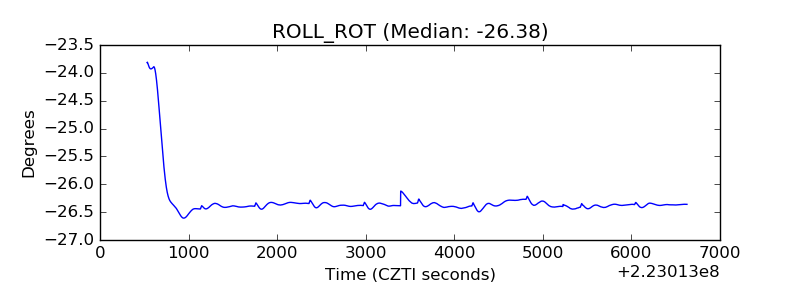 |
| _Roll_DEC | 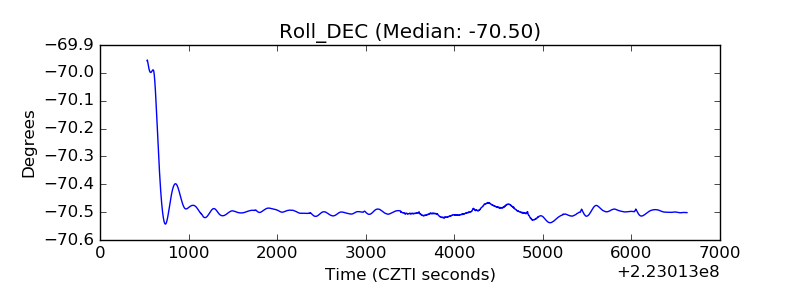 |
| _Roll_RA | 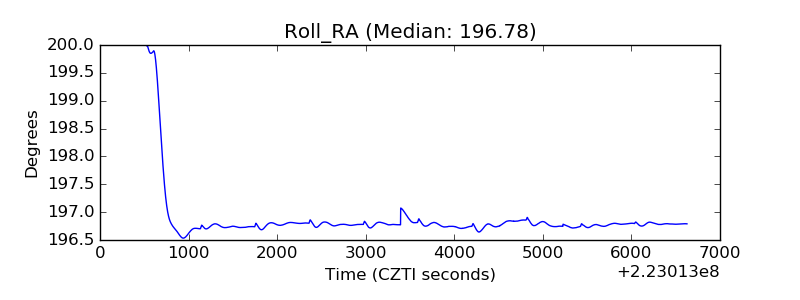 |
| Veto Counter | 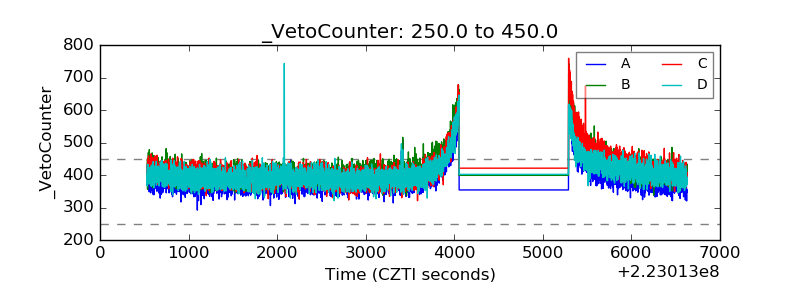 |