| Param | Original file | Final file |
|---|---|---|
| Filename | modeM0/AS1A02_176T01_9000000980_07181cztM0_level2.evt | modeM0/AS1A02_176T01_9000000980_07181cztM0_level2_quad_clean.evt |
| Size (bytes) | 492,364,800 | 118,808,640 |
| Size | 469.6 MB | 113.3 MB |
| Events in quadrant A | 3,317,542 | 786,143 |
| Events in quadrant B | 3,160,700 | 821,603 |
| Events in quadrant C | 2,876,738 | 800,251 |
| Events in quadrant D | 5,113,439 | 735,470 |
| Mode M9 | |||
|---|---|---|---|
| Quadrant | BADHDUFLAG | Total packets | Discarded packets |
| A | 0 | 9 | 0 |
| B | 0 | 9 | 0 |
| C | 0 | 9 | 0 |
| D | 0 | 9 | 0 |
| Mode M0 | |||
|---|---|---|---|
| Quadrant | BADHDUFLAG | Total packets | Discarded packets |
| A | 0 | 14261 | 3 |
| B | 0 | 13676 | 2 |
| C | 0 | 13178 | 2 |
| D | 0 | 19575 | 2 |
| Mode SS | |||
|---|---|---|---|
| Quadrant | BADHDUFLAG | Total packets | Discarded packets |
| A | 0 | 134 | 0 |
| B | 0 | 134 | 0 |
| C | 0 | 134 | 0 |
| D | 0 | 134 | 0 |
| Quadrant | Total seconds | Saturated seconds | Saturation percentage |
|---|---|---|---|
| A | 6515 | 291 | 4.466616% |
| B | 6515 | 56 | 0.859555% |
| C | 6515 | 36 | 0.552571% |
| D | 6515 | 377 | 5.786646% |
Noise dominated data is calculated using 1-second bins in cleaned event files. If a bin has >2000 counts, and if more than 50% of those come from <1% of pixels, then it is considered to be noise-dominated and hence unusable.
| Quadrant | # 1 sec bins | Bins with >0 counts | Bins with >2000 counts | High rate bins dominated by noise | Noise dominated (total time) | Noise dominated (detector-on time) | Marked lightcurve |
|---|---|---|---|---|---|---|---|
| A | 7475 | 6516 | 7 | 7 | 0.09% | 0.11% | 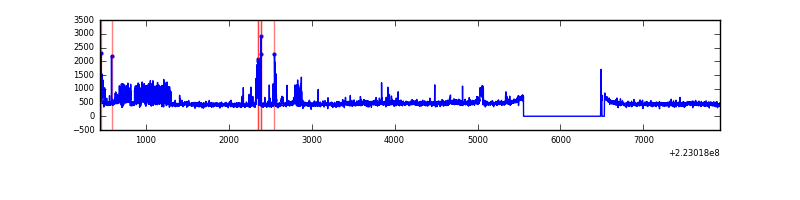 |
| B | 7475 | 6517 | 15 | 15 | 0.20% | 0.23% | 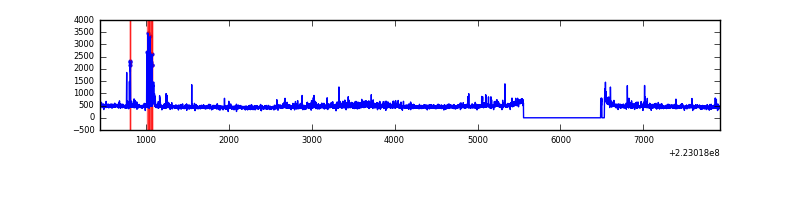 |
| C | 7475 | 6517 | 0 | 0 | 0.00% | 0.00% | 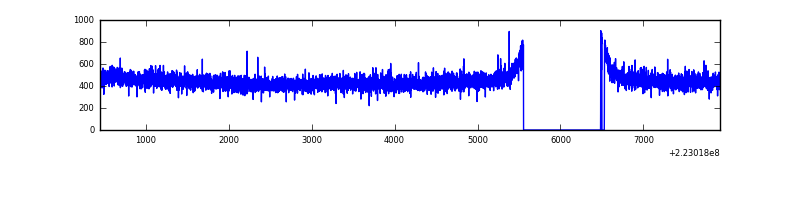 |
| D | 7475 | 6517 | 272 | 272 | 3.64% | 4.17% | 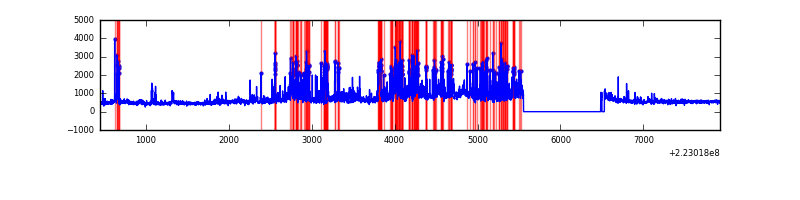 |
Top three noisy pixels from each quadrant. If the there are fewer than three noisy pixels in the level2.evt file, extra rows are filled as -1
| Pixel properties | Quadrant properties | ||||||
|---|---|---|---|---|---|---|---|
| Quadrant | DetID | PixID | Counts | Sigma | Mean | Median | Sigma |
| A | 14 | 111 | 429656 | 2902.75 | 735 | 721 | 147.8 |
| A | 8 | 15 | 38749 | 257.35 | 735 | 721 | 147.8 |
| A | 13 | 14 | 10465 | 65.94 | 735 | 721 | 147.8 |
| B | 4 | 81 | 112758 | 792.62 | 754 | 737 | 141.3 |
| B | 0 | 214 | 89768 | 629.95 | 754 | 737 | 141.3 |
| B | 0 | 219 | 21107 | 144.13 | 754 | 737 | 141.3 |
| C | 13 | 61 | 5718 | 29.37 | 733 | 736 | 169.6 |
| C | 8 | 128 | 5309 | 26.96 | 733 | 736 | 169.6 |
| C | 10 | 22 | 4977 | 25.0 | 733 | 736 | 169.6 |
| D | 2 | 216 | 1319490 | 7568.7 | 715 | 693 | 174.2 |
| D | 8 | 195 | 770743 | 4419.39 | 715 | 693 | 174.2 |
| D | 13 | 137 | 139831 | 798.53 | 715 | 693 | 174.2 |
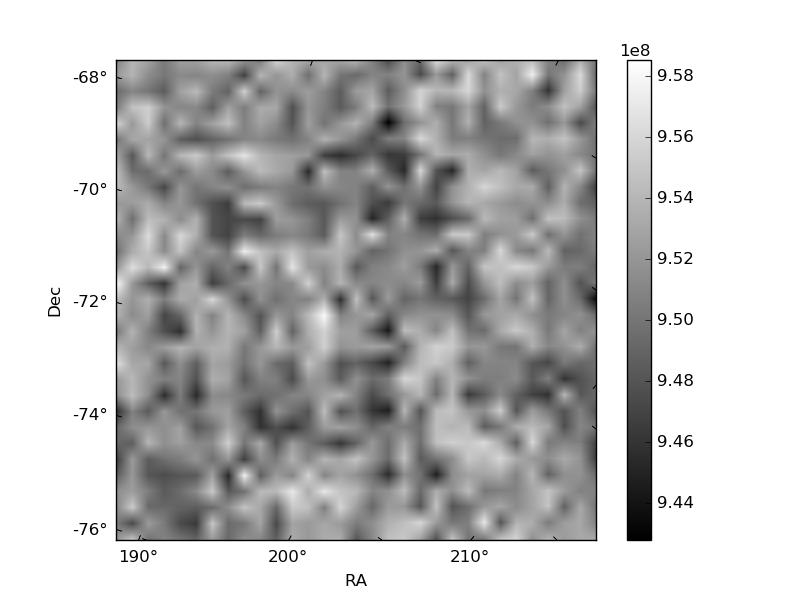
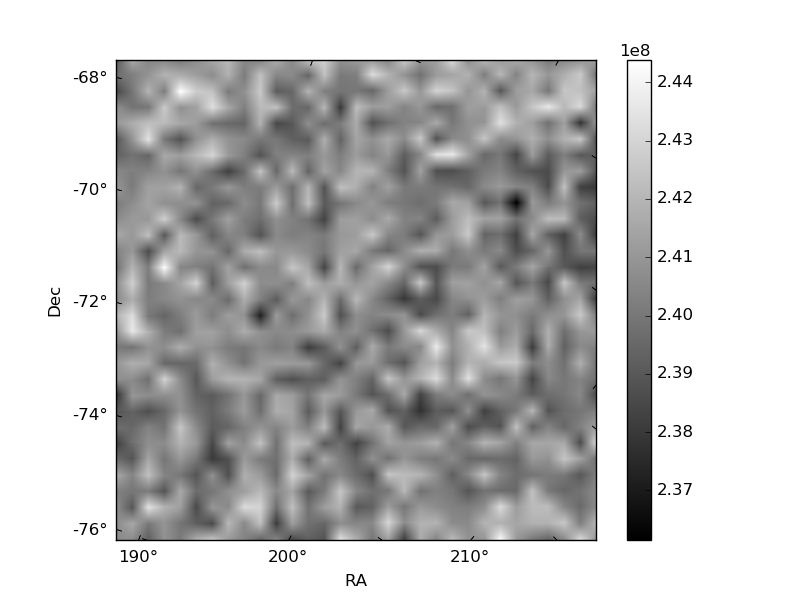
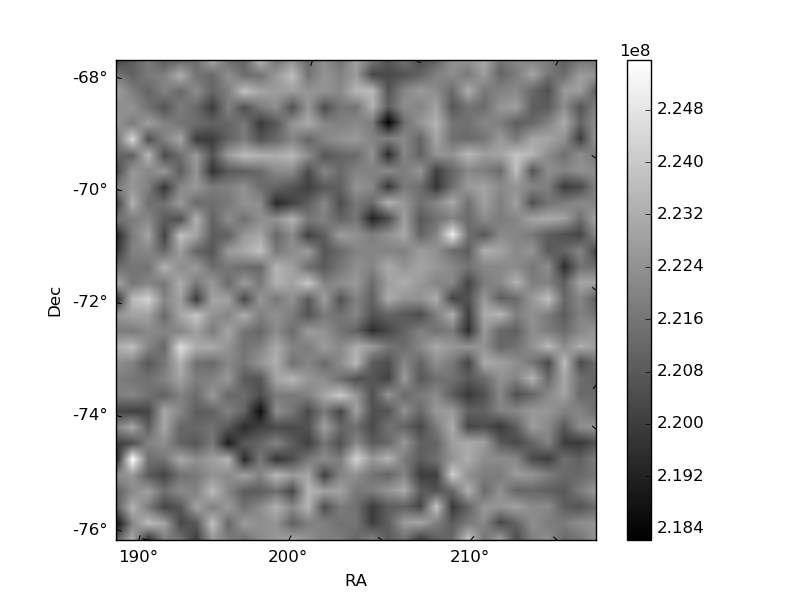
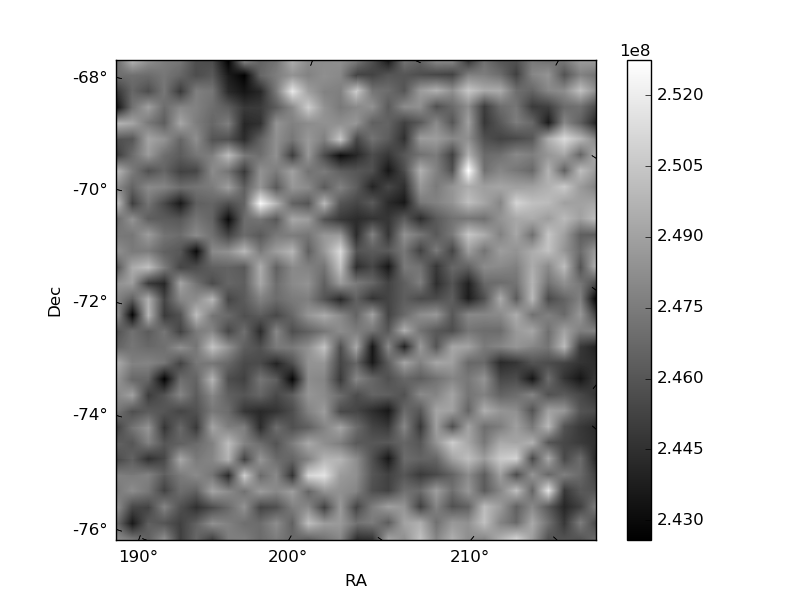
Histogram calculated using DETX and DETY for each event in the final _common_clean file
| Quadrant A | 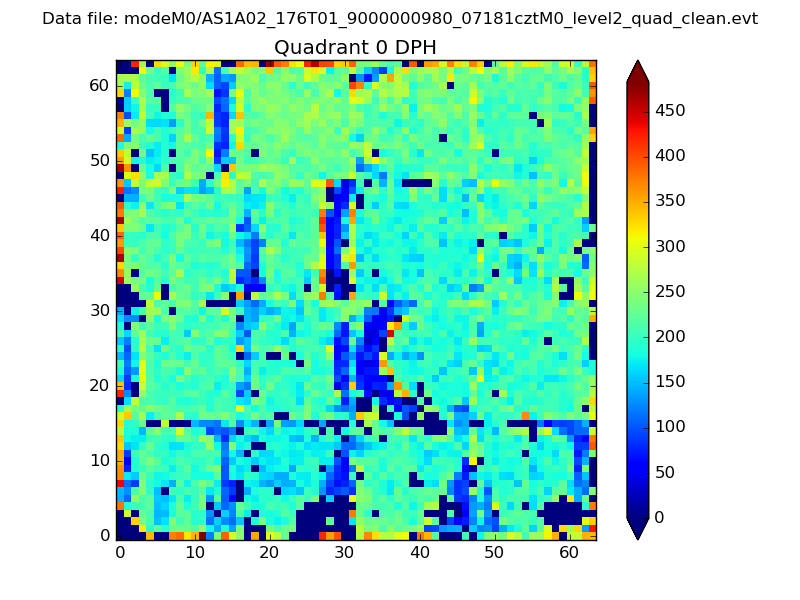 |
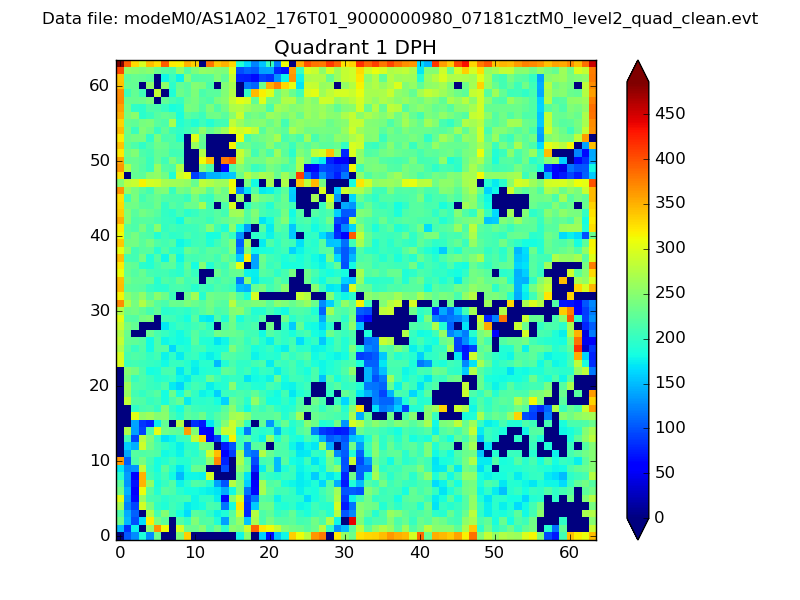 |
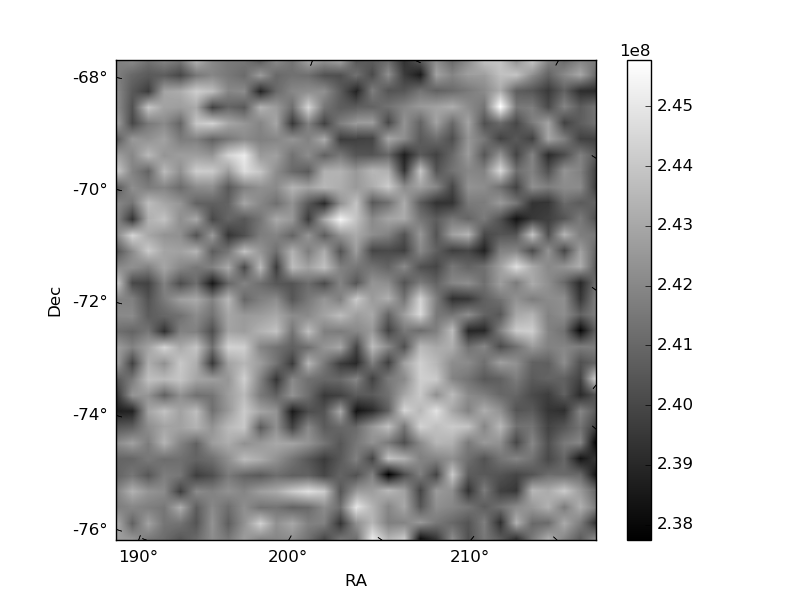
Quadrant B |
|---|---|---|---|
| Quadrant D | 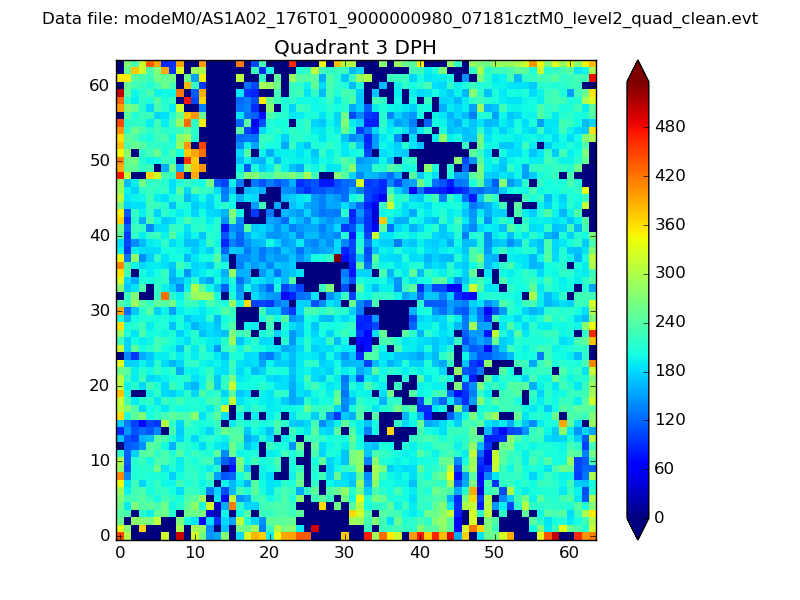 |
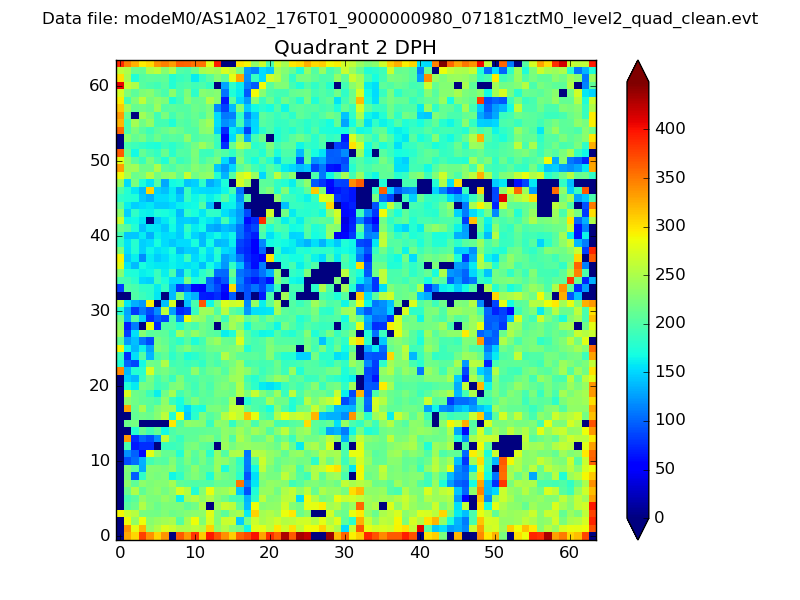 |
Quadrant C |
| Plot type | Count rate plots | Images |
|---|---|---|
| Comparison with Poisson distribution Blue bars denote a histogram of data divided into 1 sec bins. Red curve is a Poisson curve with rate = median count rate of data. |
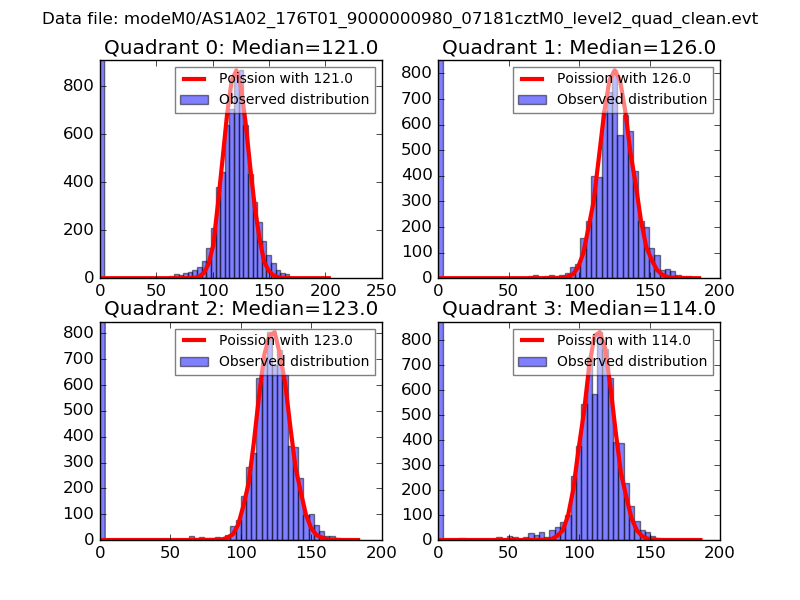 |
 |
| Quadrant-wise count rates Data is divided into 100 sec bins |
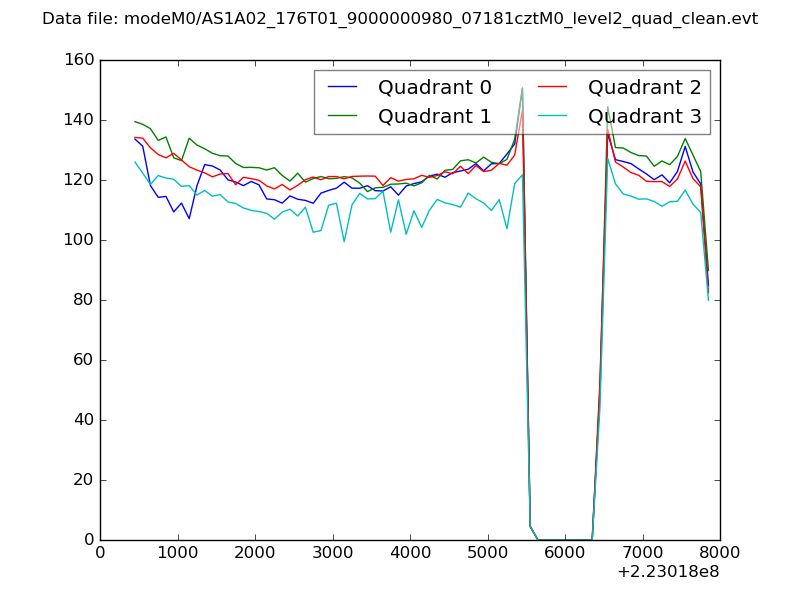 |
|
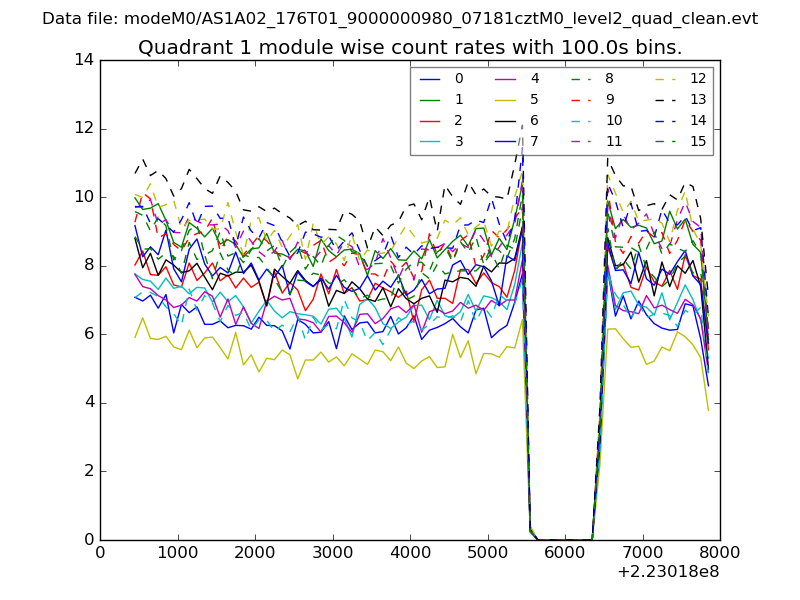
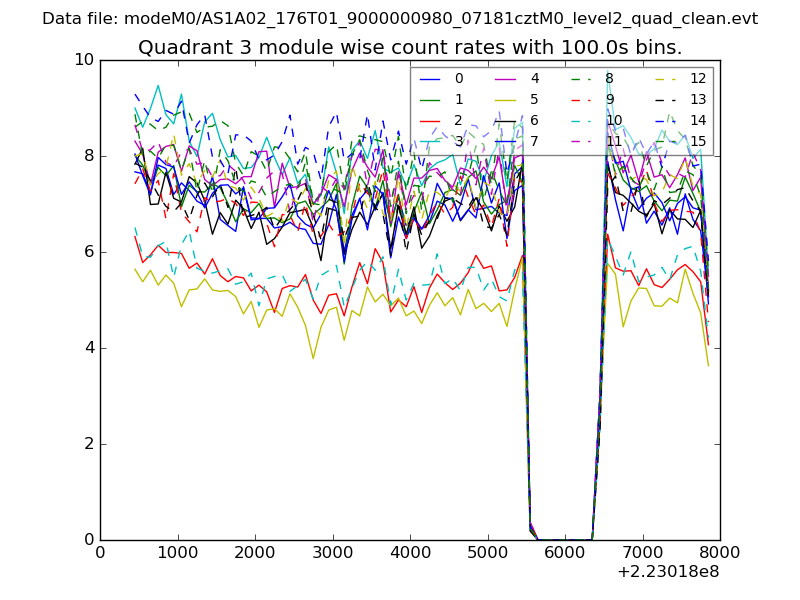
| Module-wise count rates for Quadrant A Data is divided into 100 sec bins |
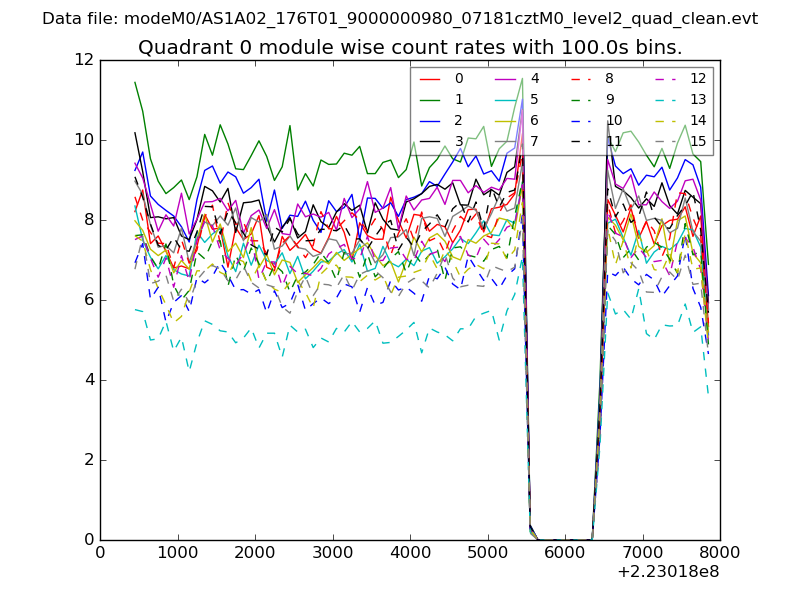 |
 |
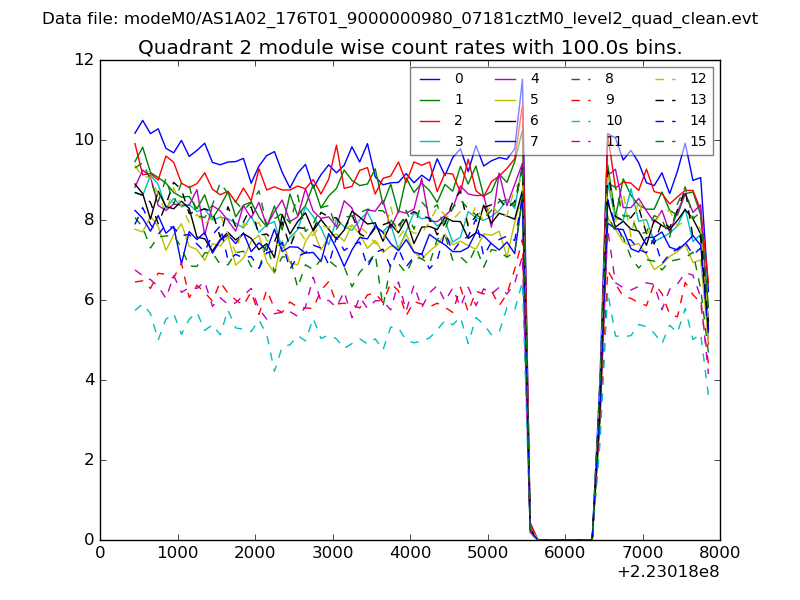
| Module-wise count rates for Quadrant B Data is divided into 100 sec bins |
 |
 |
| Module-wise count rates for Quadrant C Data is divided into 100 sec bins |
 |
 |
| Module-wise count rates for Quadrant D Data is divided into 100 sec bins |
 |
 |
| Parameter | Plot |
|---|---|
| CZT HV Monitor | 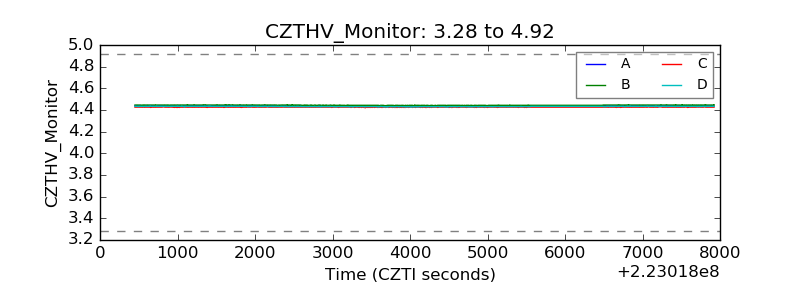 |
| D_VDD | 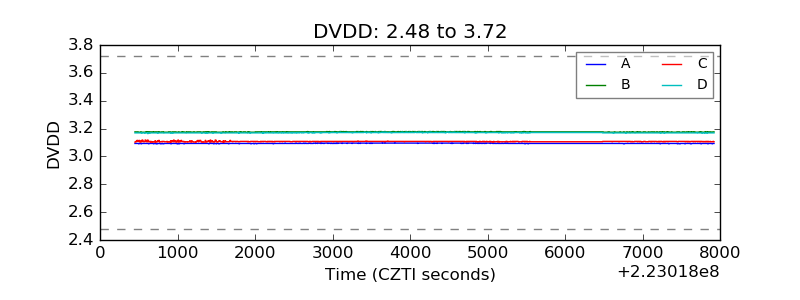 |
| Temperature 1 | 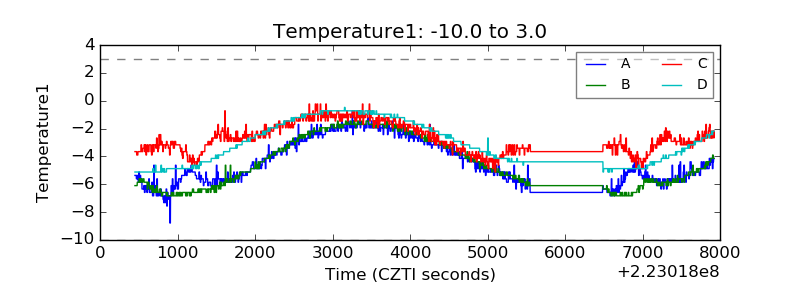 |
| Veto HV Monitor | 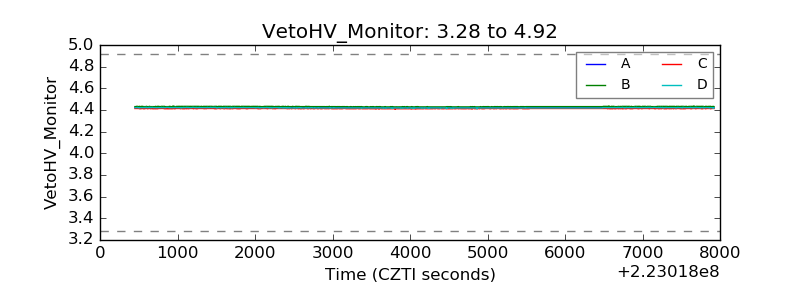 |
| Veto LLD | 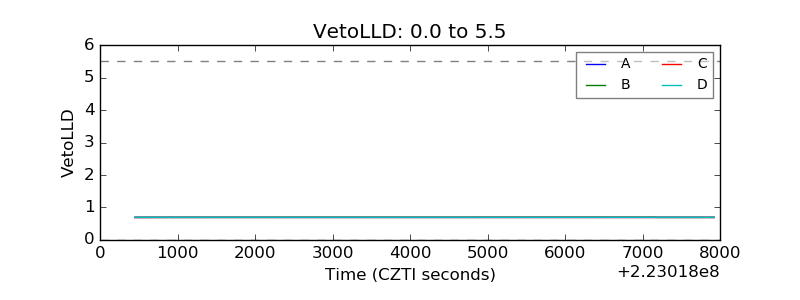 |
| Alpha Counter | 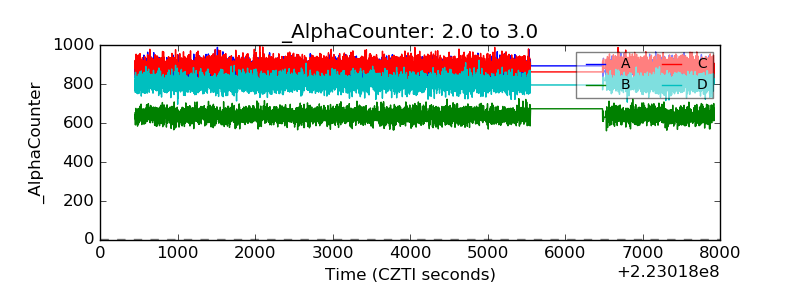 |
| _CPM_Rate | 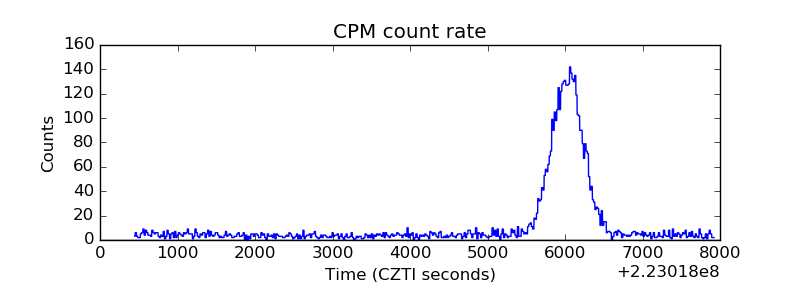 |
| CZT Counter | 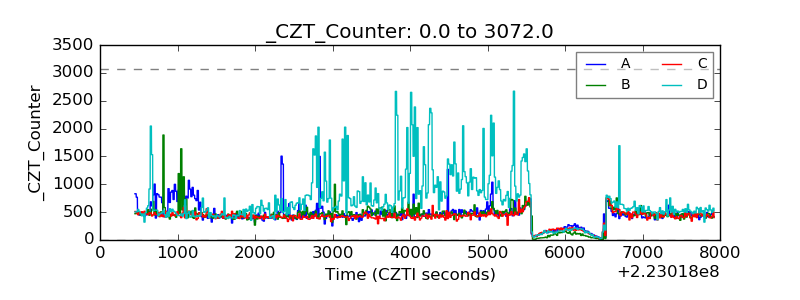 |
| +2.5 Volts monitor |  |
| +5 Volts monitor |  |
| _ROLL_ROT | 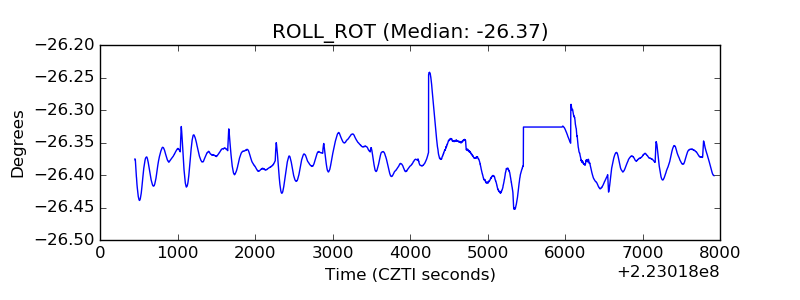 |
| _Roll_DEC | 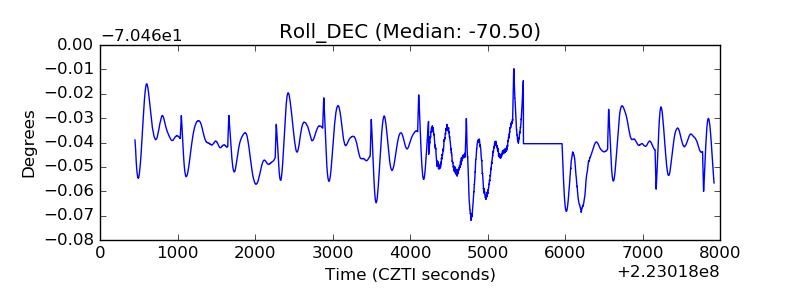 |
| _Roll_RA | 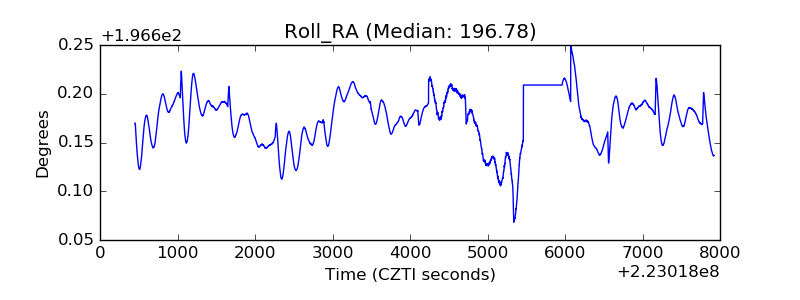 |
| Veto Counter | 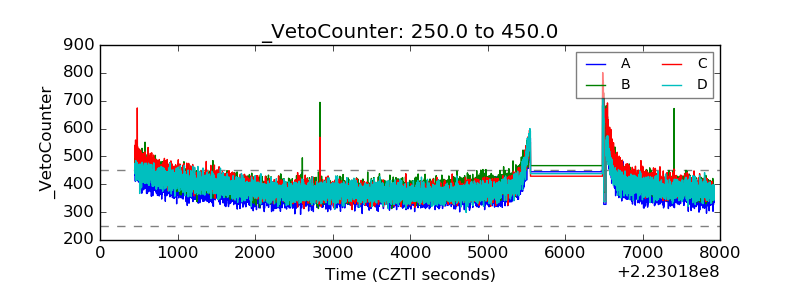 |