| Param | Original file | Final file |
|---|---|---|
| Filename | modeM0/AS1A02_176T01_9000000980_07182cztM0_level2.evt | modeM0/AS1A02_176T01_9000000980_07182cztM0_level2_quad_clean.evt |
| Size (bytes) | 513,809,280 | 129,643,200 |
| Size | 490.0 MB | 123.6 MB |
| Events in quadrant A | 3,250,750 | 864,284 |
| Events in quadrant B | 3,527,946 | 886,847 |
| Events in quadrant C | 3,204,178 | 864,694 |
| Events in quadrant D | 5,086,068 | 806,557 |
| Mode M9 | |||
|---|---|---|---|
| Quadrant | BADHDUFLAG | Total packets | Discarded packets |
| A | 0 | 8 | 0 |
| B | 0 | 8 | 0 |
| C | 0 | 8 | 0 |
| D | 0 | 9 | 0 |
| Mode M0 | |||
|---|---|---|---|
| Quadrant | BADHDUFLAG | Total packets | Discarded packets |
| A | 0 | 14837 | 4 |
| B | 0 | 15270 | 3 |
| C | 0 | 14829 | 3 |
| D | 0 | 19901 | 3 |
| Mode SS | |||
|---|---|---|---|
| Quadrant | BADHDUFLAG | Total packets | Discarded packets |
| A | 0 | 150 | 0 |
| B | 0 | 150 | 0 |
| C | 0 | 150 | 0 |
| D | 0 | 150 | 0 |
| Quadrant | Total seconds | Saturated seconds | Saturation percentage |
|---|---|---|---|
| A | 7228 | 186 | 2.573326% |
| B | 7228 | 209 | 2.891533% |
| C | 7228 | 160 | 2.213614% |
| D | 7228 | 323 | 4.468733% |
Noise dominated data is calculated using 1-second bins in cleaned event files. If a bin has >2000 counts, and if more than 50% of those come from <1% of pixels, then it is considered to be noise-dominated and hence unusable.
| Quadrant | # 1 sec bins | Bins with >0 counts | Bins with >2000 counts | High rate bins dominated by noise | Noise dominated (total time) | Noise dominated (detector-on time) | Marked lightcurve |
|---|---|---|---|---|---|---|---|
| A | 7718 | 7228 | 0 | 0 | 0.00% | 0.00% | 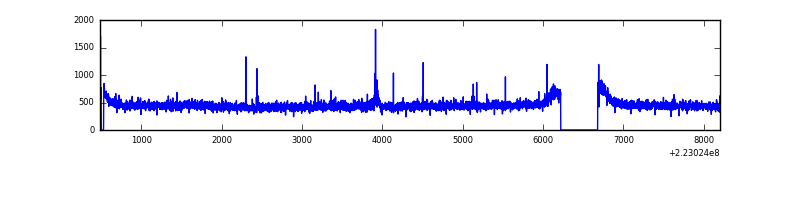 |
| B | 7718 | 7229 | 0 | 0 | 0.00% | 0.00% | 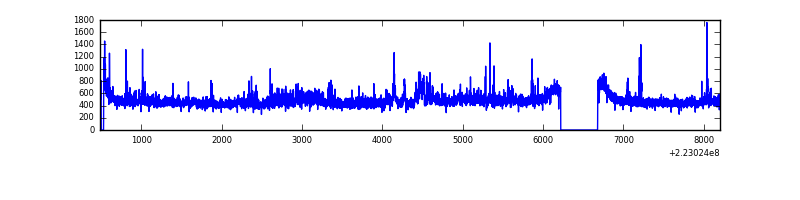 |
| C | 7718 | 7229 | 0 | 0 | 0.00% | 0.00% | 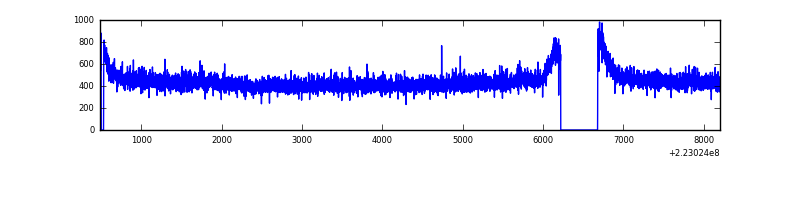 |
| D | 7718 | 7229 | 107 | 107 | 1.39% | 1.48% | 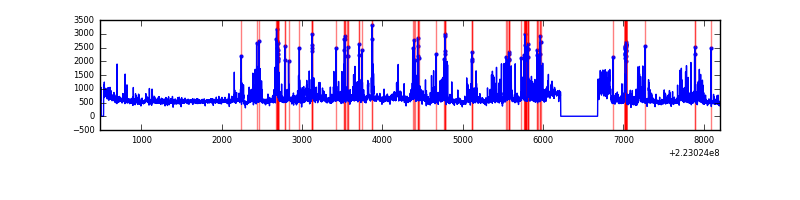 |
Top three noisy pixels from each quadrant. If the there are fewer than three noisy pixels in the level2.evt file, extra rows are filled as -1
| Pixel properties | Quadrant properties | ||||||
|---|---|---|---|---|---|---|---|
| Quadrant | DetID | PixID | Counts | Sigma | Mean | Median | Sigma |
| A | 8 | 15 | 21803 | 124.85 | 831 | 811 | 168.1 |
| A | 14 | 238 | 14490 | 81.36 | 831 | 811 | 168.1 |
| A | 14 | 111 | 14419 | 80.93 | 831 | 811 | 168.1 |
| B | 0 | 219 | 105756 | 660.05 | 841 | 821 | 159.0 |
| B | 0 | 214 | 92737 | 578.16 | 841 | 821 | 159.0 |
| B | 4 | 239 | 20409 | 123.21 | 841 | 821 | 159.0 |
| C | 13 | 61 | 6352 | 29.3 | 817 | 818 | 188.9 |
| C | 8 | 128 | 5239 | 23.41 | 817 | 818 | 188.9 |
| C | 10 | 22 | 5042 | 22.37 | 817 | 818 | 188.9 |
| D | 8 | 195 | 981192 | 4977.9 | 802 | 774 | 197.0 |
| D | 2 | 216 | 676626 | 3431.52 | 802 | 774 | 197.0 |
| D | 14 | 34 | 216268 | 1094.13 | 802 | 774 | 197.0 |
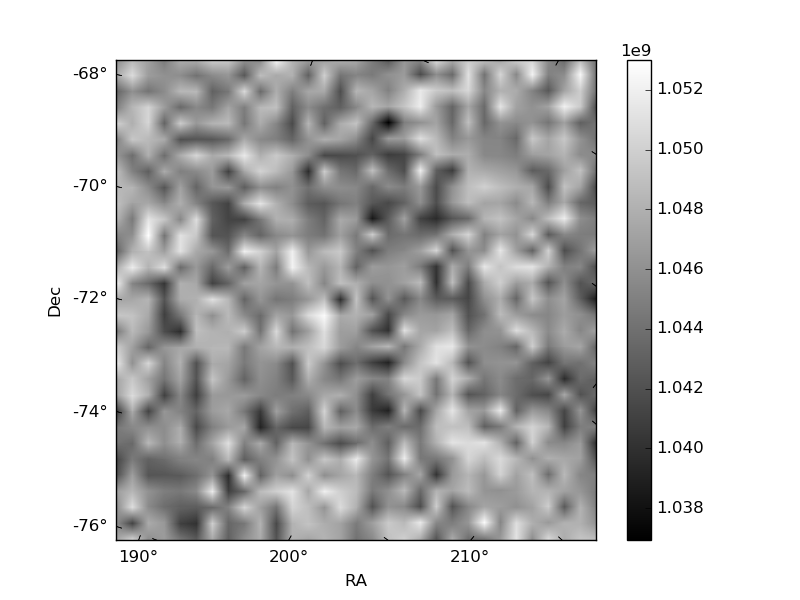
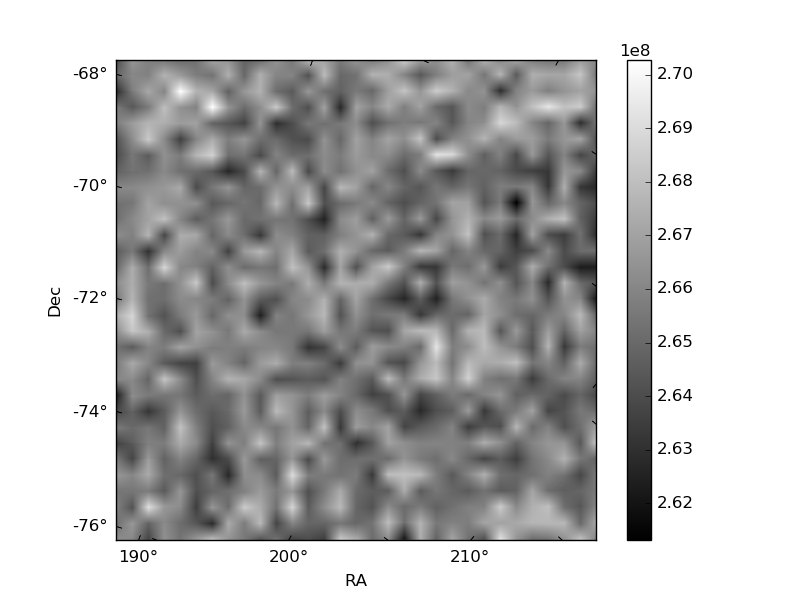
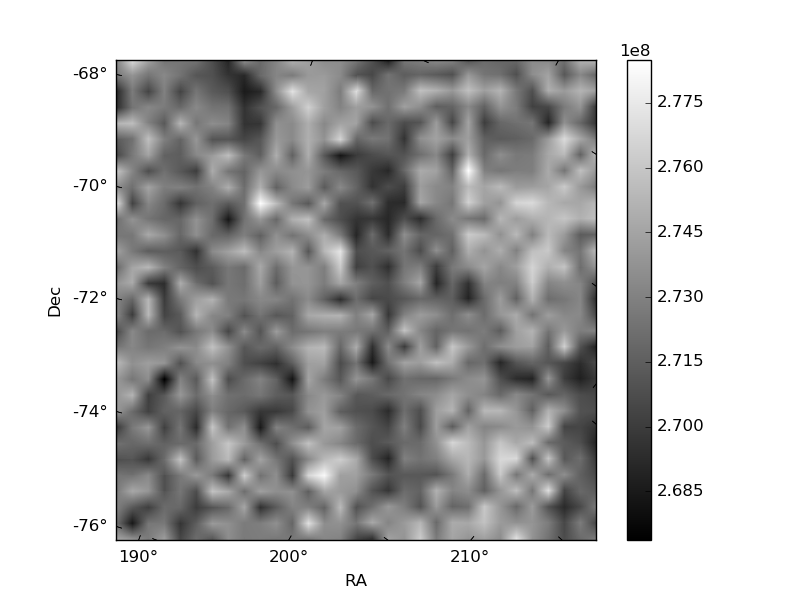
Histogram calculated using DETX and DETY for each event in the final _common_clean file
| Quadrant A | 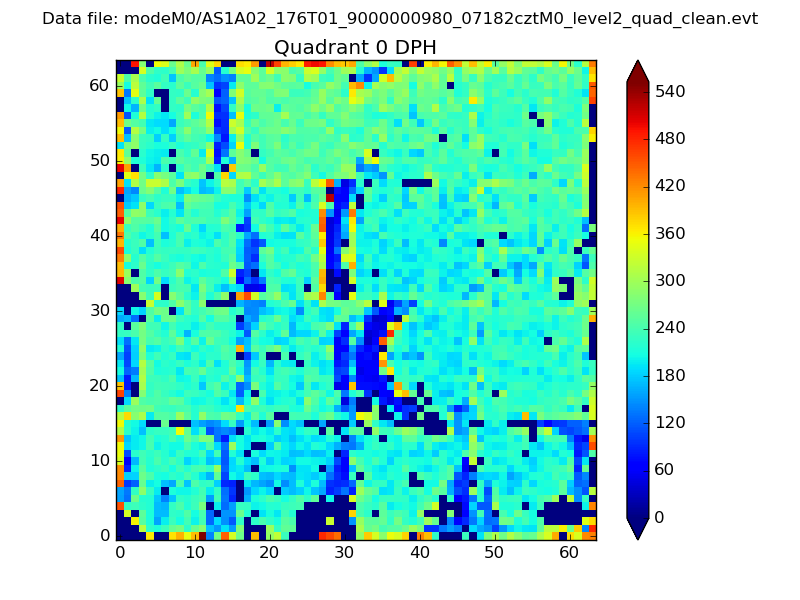 |
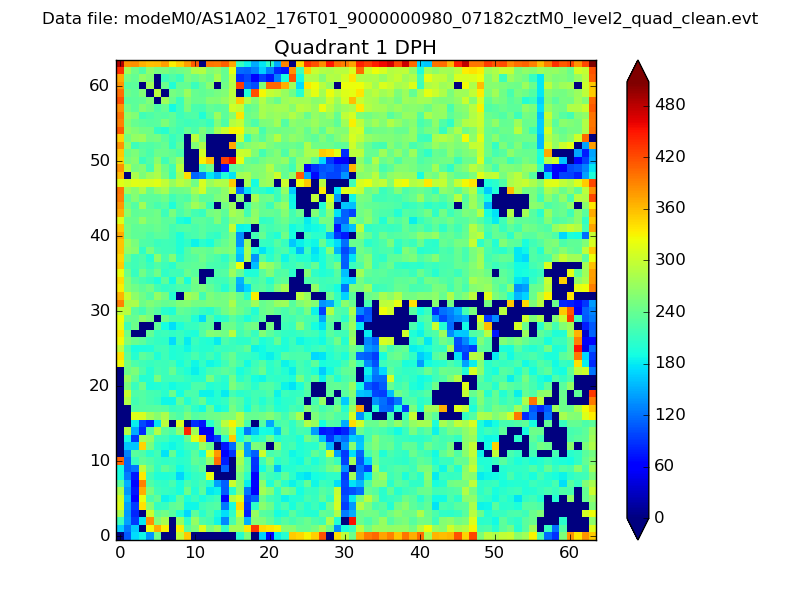 |
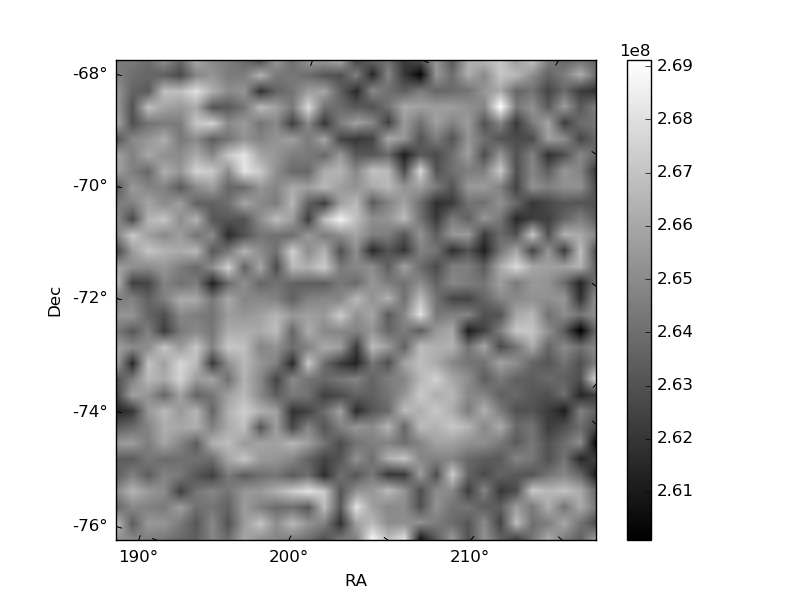
Quadrant B |
|---|---|---|---|
| Quadrant D | 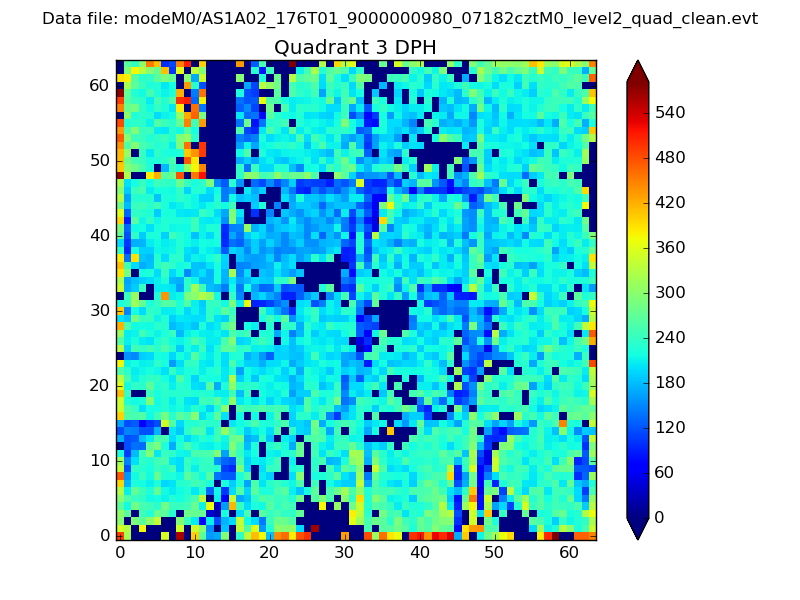 |
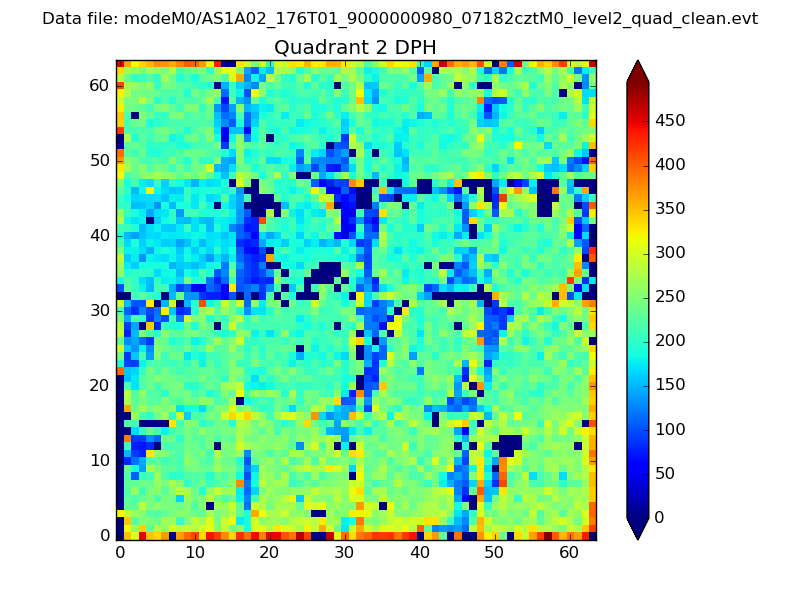 |
Quadrant C |
| Plot type | Count rate plots | Images |
|---|---|---|
| Comparison with Poisson distribution Blue bars denote a histogram of data divided into 1 sec bins. Red curve is a Poisson curve with rate = median count rate of data. |
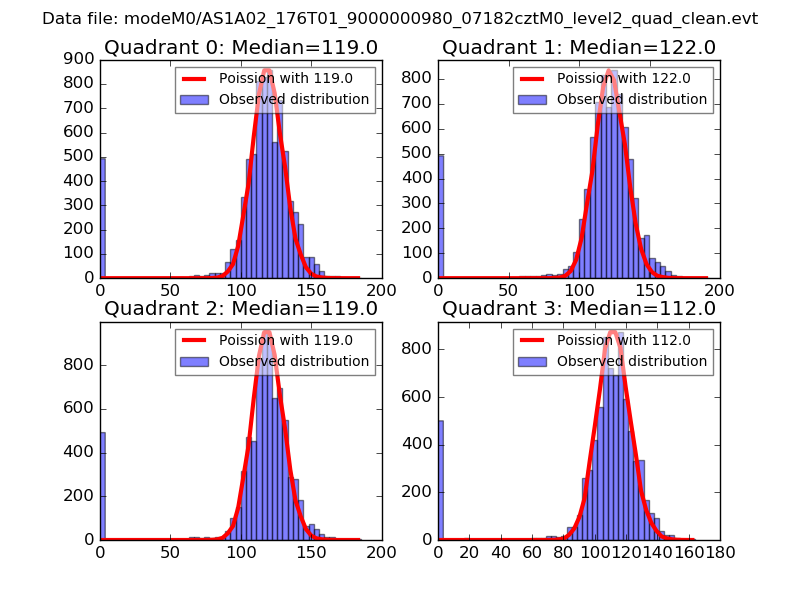 |
 |
| Quadrant-wise count rates Data is divided into 100 sec bins |
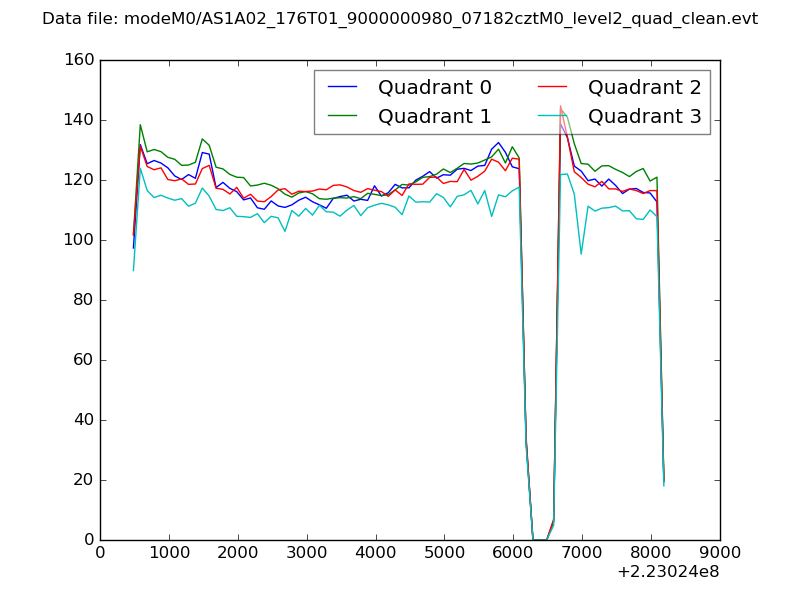 |
|
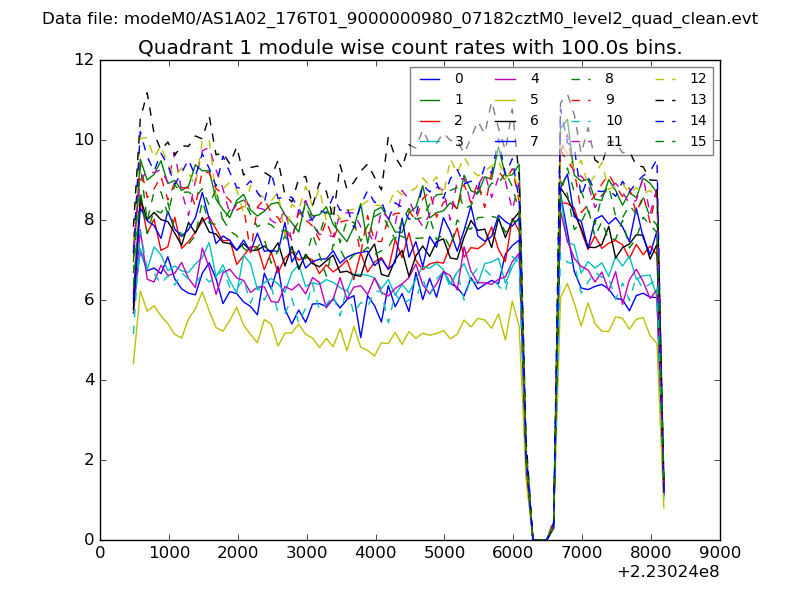
| Module-wise count rates for Quadrant A Data is divided into 100 sec bins |
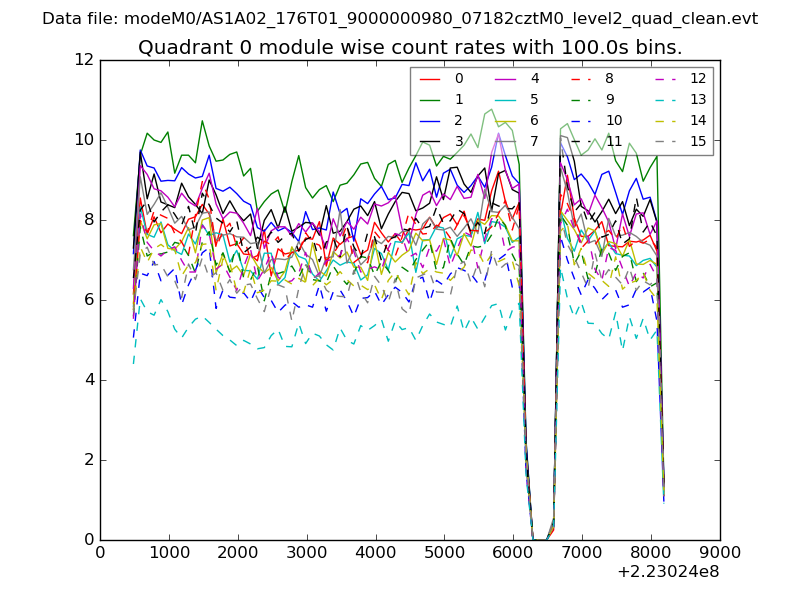 |
 |
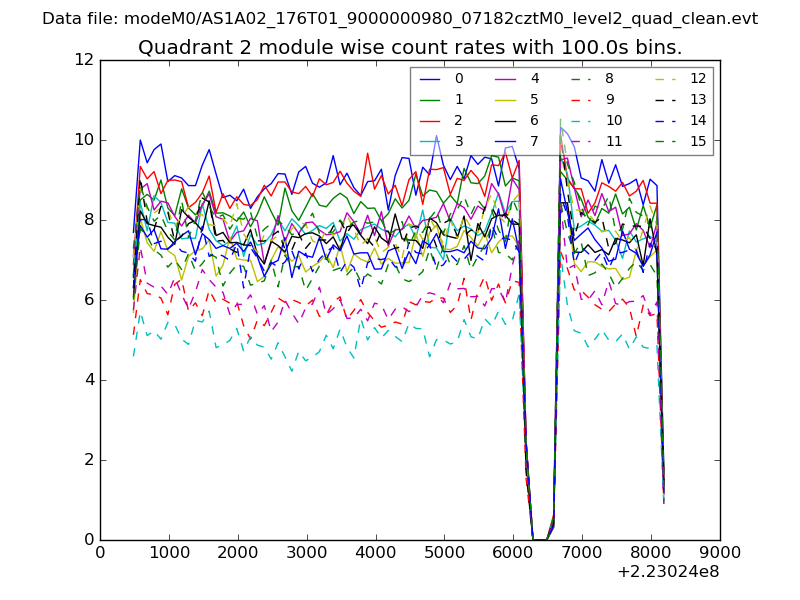
| Module-wise count rates for Quadrant B Data is divided into 100 sec bins |
 |
 |
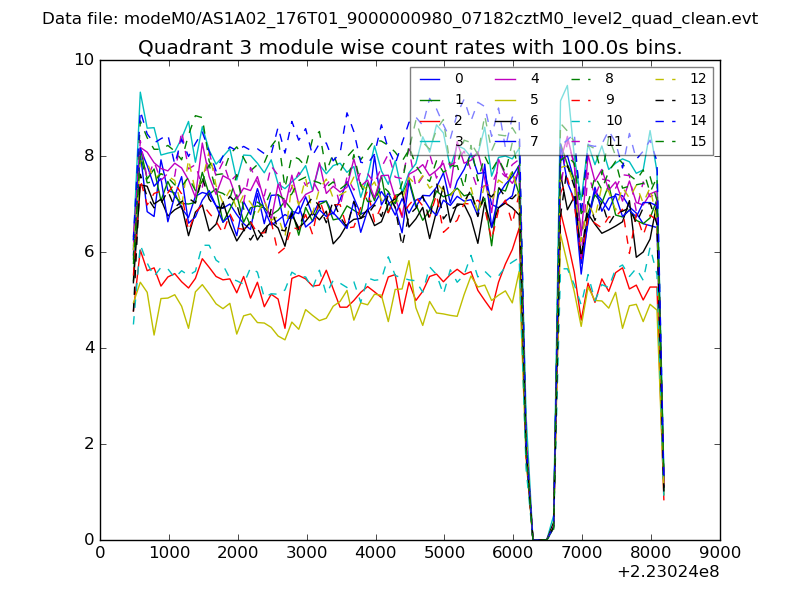
| Module-wise count rates for Quadrant C Data is divided into 100 sec bins |
 |
 |
| Module-wise count rates for Quadrant D Data is divided into 100 sec bins |
 |
 |
| Parameter | Plot |
|---|---|
| CZT HV Monitor | 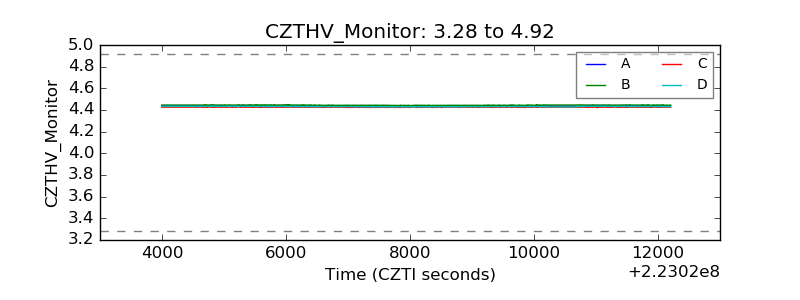 |
| D_VDD | 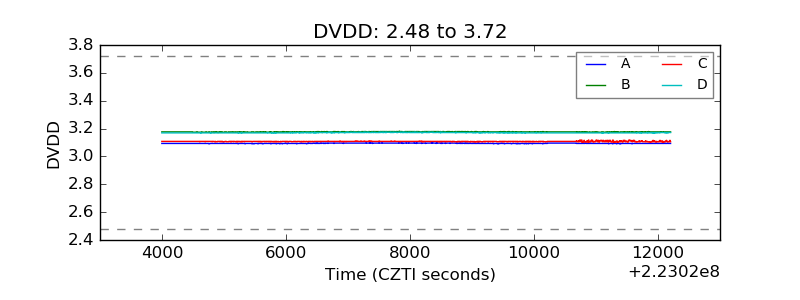 |
| Temperature 1 | 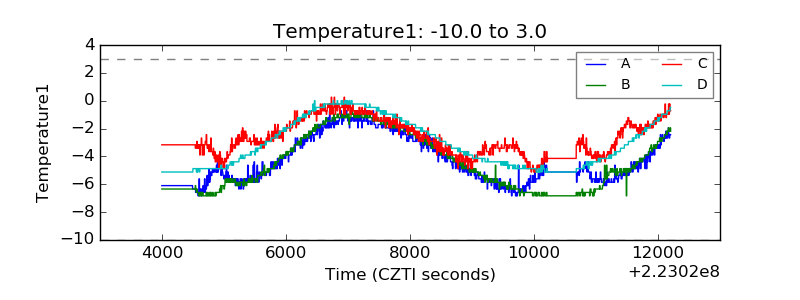 |
| Veto HV Monitor | 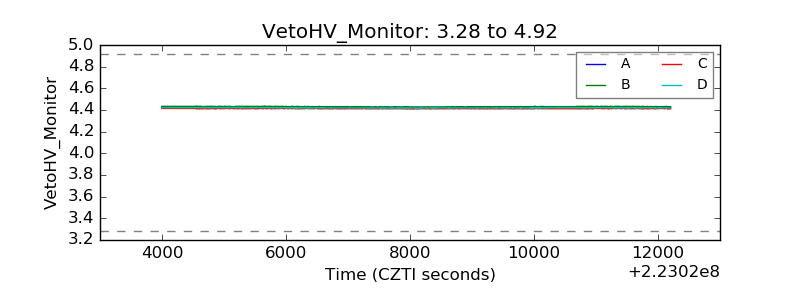 |
| Veto LLD | 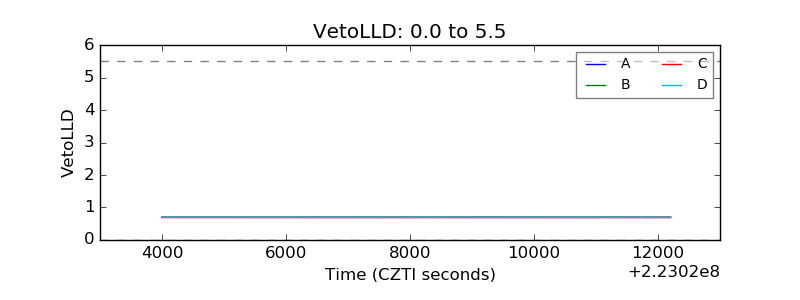 |
| Alpha Counter | 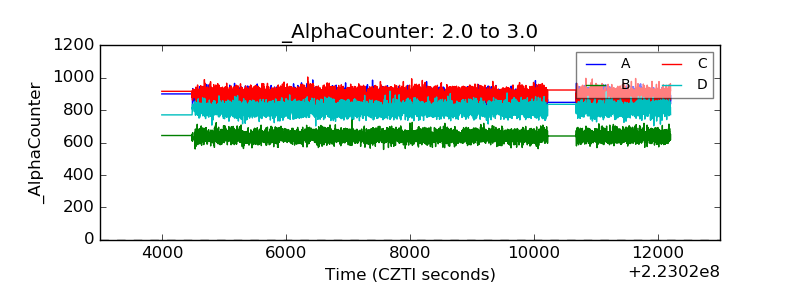 |
| _CPM_Rate | 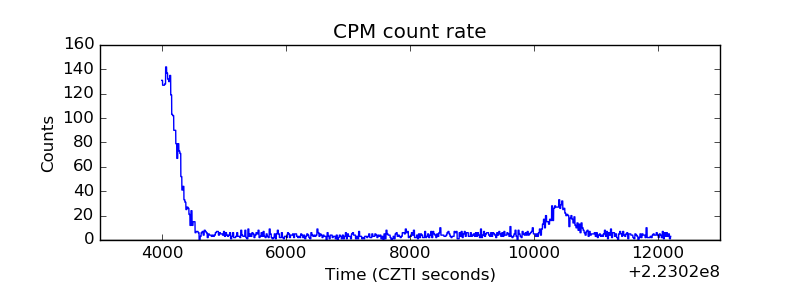 |
| CZT Counter | 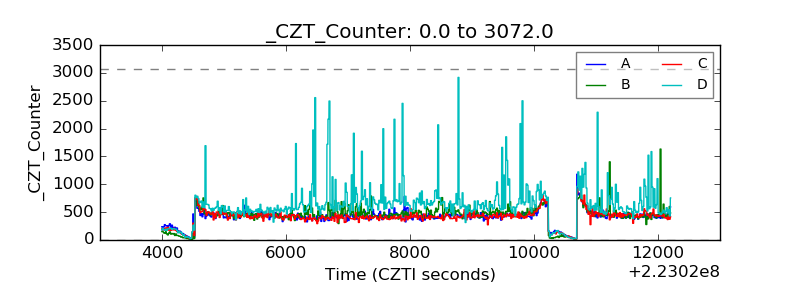 |
| +2.5 Volts monitor |  |
| +5 Volts monitor |  |
| _ROLL_ROT | 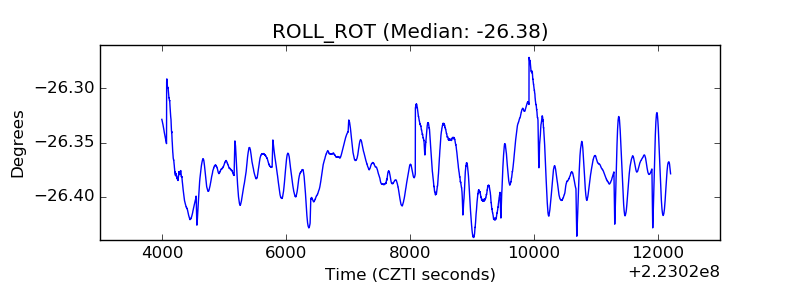 |
| _Roll_DEC | 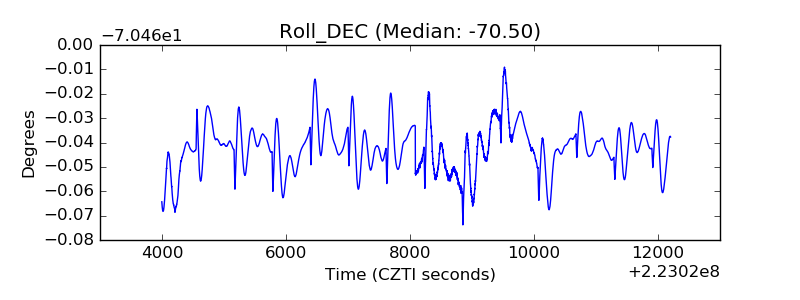 |
| _Roll_RA | 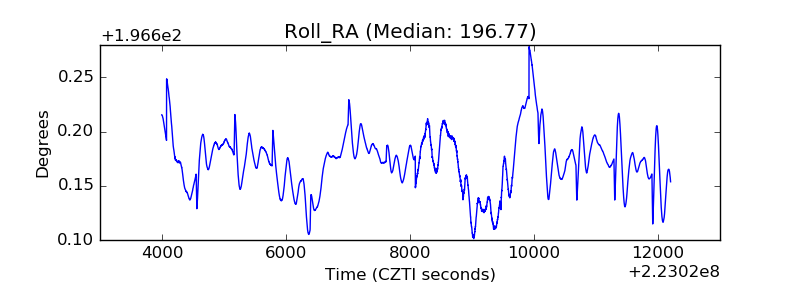 |
| Veto Counter | 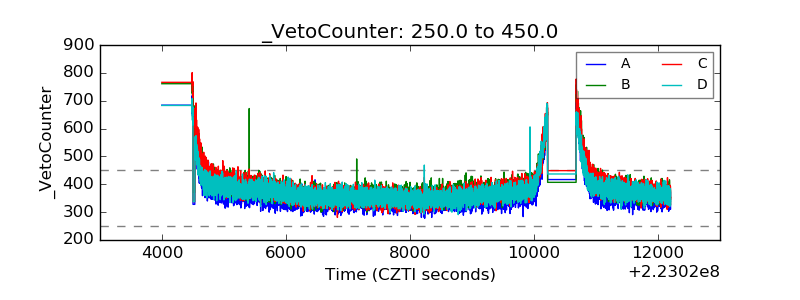 |