| Param | Original file | Final file |
|---|---|---|
| Filename | modeM0/AS1A02_176T01_9000000980_07183cztM0_level2.evt | modeM0/AS1A02_176T01_9000000980_07183cztM0_level2_quad_clean.evt |
| Size (bytes) | 559,670,400 | 131,077,440 |
| Size | 533.7 MB | 125.0 MB |
| Events in quadrant A | 3,399,674 | 868,665 |
| Events in quadrant B | 3,797,040 | 894,693 |
| Events in quadrant C | 3,331,139 | 877,411 |
| Events in quadrant D | 5,917,819 | 812,080 |
| Mode M9 | |||
|---|---|---|---|
| Quadrant | BADHDUFLAG | Total packets | Discarded packets |
| A | 0 | 2 | 0 |
| B | 0 | 2 | 0 |
| C | 0 | 2 | 0 |
| D | 0 | 2 | 0 |
| Mode M0 | |||
|---|---|---|---|
| Quadrant | BADHDUFLAG | Total packets | Discarded packets |
| A | 0 | 15408 | 2 |
| B | 0 | 16125 | 1 |
| C | 0 | 15340 | 1 |
| D | 0 | 22540 | 1 |
| Mode SS | |||
|---|---|---|---|
| Quadrant | BADHDUFLAG | Total packets | Discarded packets |
| A | 0 | 150 | 0 |
| B | 0 | 150 | 0 |
| C | 0 | 150 | 0 |
| D | 0 | 150 | 0 |
| Quadrant | Total seconds | Saturated seconds | Saturation percentage |
|---|---|---|---|
| A | 7435 | 253 | 3.402824% |
| B | 7435 | 268 | 3.604573% |
| C | 7435 | 175 | 2.353732% |
| D | 7435 | 498 | 6.698050% |
Noise dominated data is calculated using 1-second bins in cleaned event files. If a bin has >2000 counts, and if more than 50% of those come from <1% of pixels, then it is considered to be noise-dominated and hence unusable.
| Quadrant | # 1 sec bins | Bins with >0 counts | Bins with >2000 counts | High rate bins dominated by noise | Noise dominated (total time) | Noise dominated (detector-on time) | Marked lightcurve |
|---|---|---|---|---|---|---|---|
| A | 7510 | 7435 | 2 | 2 | 0.03% | 0.03% | 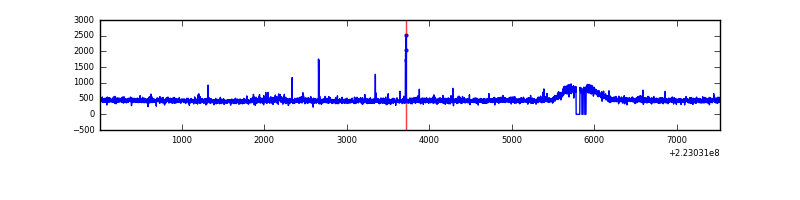 |
| B | 7510 | 7436 | 9 | 9 | 0.12% | 0.12% | 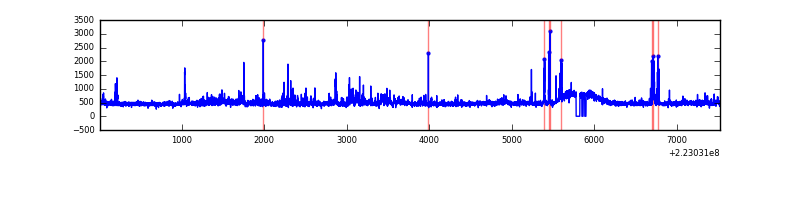 |
| C | 7510 | 7436 | 0 | 0 | 0.00% | 0.00% | 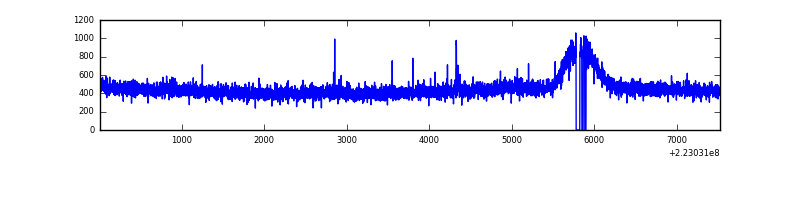 |
| D | 7510 | 7435 | 228 | 228 | 3.04% | 3.07% | 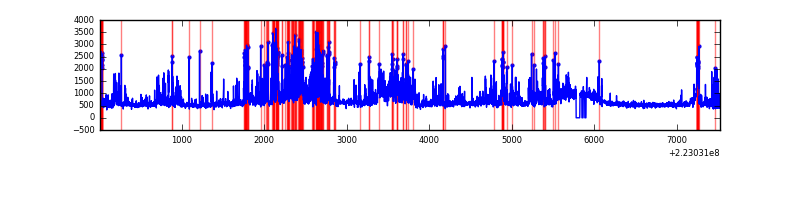 |
Top three noisy pixels from each quadrant. If the there are fewer than three noisy pixels in the level2.evt file, extra rows are filled as -1
| Pixel properties | Quadrant properties | ||||||
|---|---|---|---|---|---|---|---|
| Quadrant | DetID | PixID | Counts | Sigma | Mean | Median | Sigma |
| A | 8 | 15 | 43378 | 241.69 | 861 | 838 | 176.0 |
| A | 14 | 111 | 20978 | 114.42 | 861 | 838 | 176.0 |
| A | 15 | 174 | 17659 | 95.57 | 861 | 838 | 176.0 |
| B | 4 | 239 | 108225 | 637.21 | 870 | 847 | 168.5 |
| B | 0 | 219 | 97078 | 571.06 | 870 | 847 | 168.5 |
| B | 4 | 81 | 91557 | 538.3 | 870 | 847 | 168.5 |
| C | 8 | 128 | 10600 | 49.54 | 847 | 848 | 196.8 |
| C | 8 | 112 | 6632 | 29.38 | 847 | 848 | 196.8 |
| C | 13 | 61 | 6443 | 28.42 | 847 | 848 | 196.8 |
| D | 8 | 195 | 1021867 | 5018.06 | 830 | 798 | 203.5 |
| D | 2 | 216 | 814055 | 3996.77 | 830 | 798 | 203.5 |
| D | 14 | 34 | 652793 | 3204.24 | 830 | 798 | 203.5 |
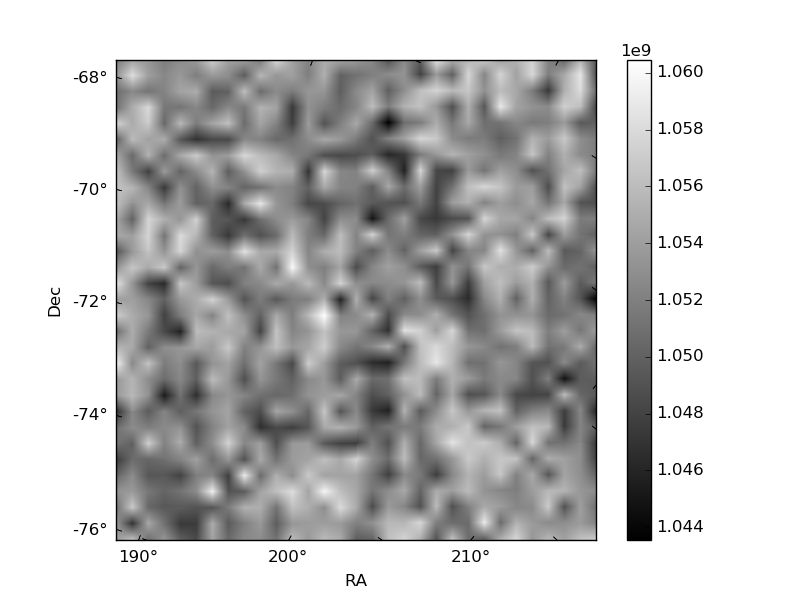
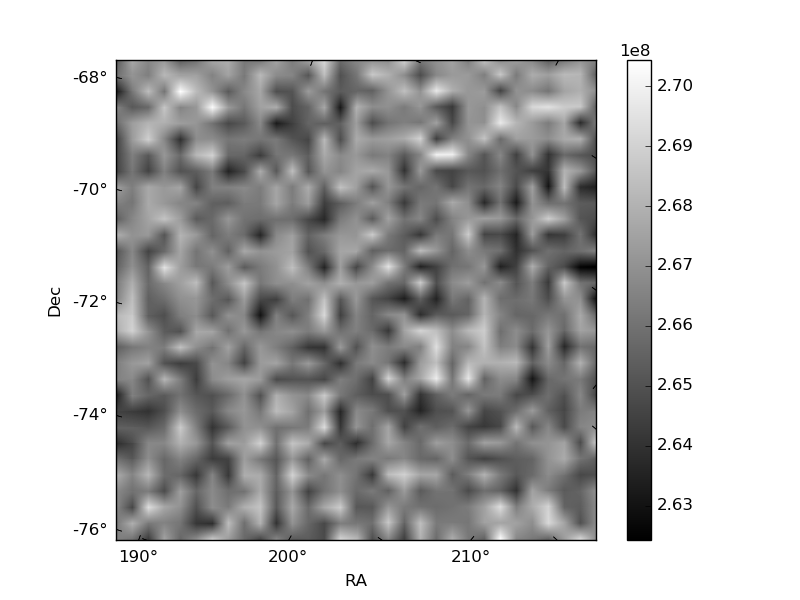
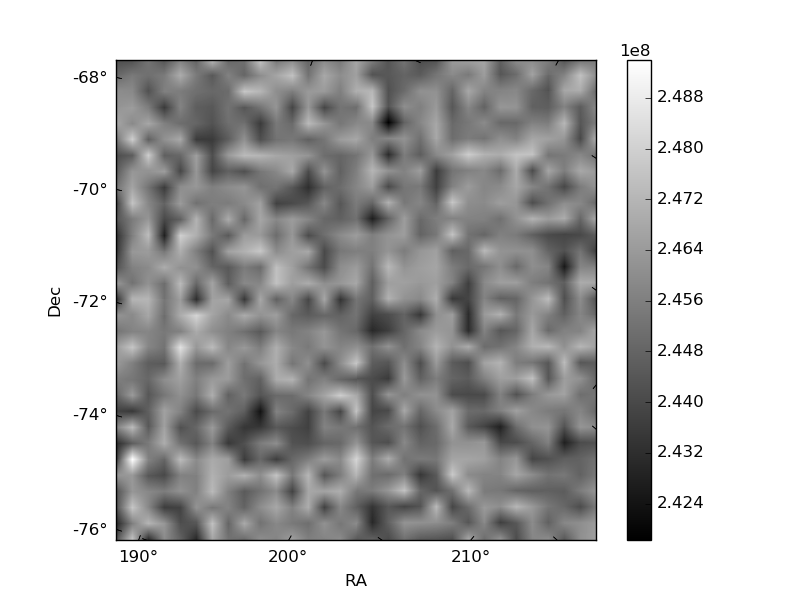
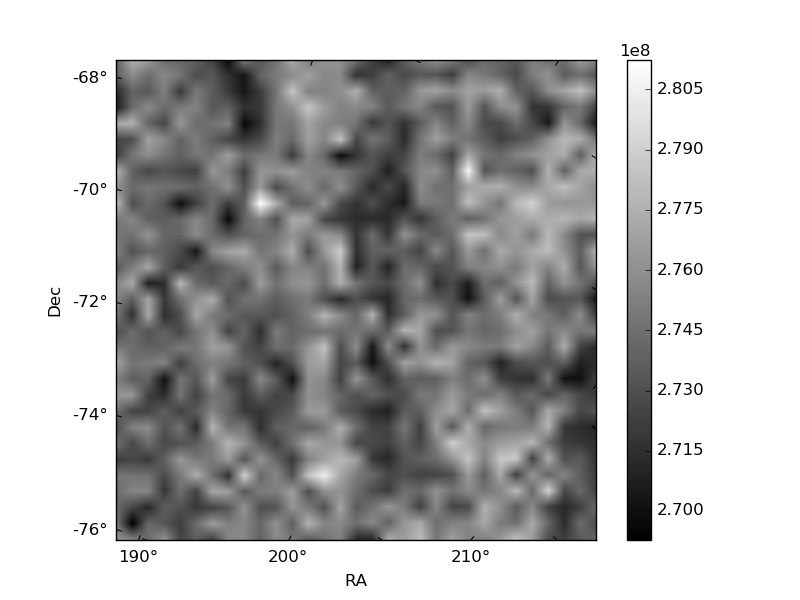
Histogram calculated using DETX and DETY for each event in the final _common_clean file
| Quadrant A | 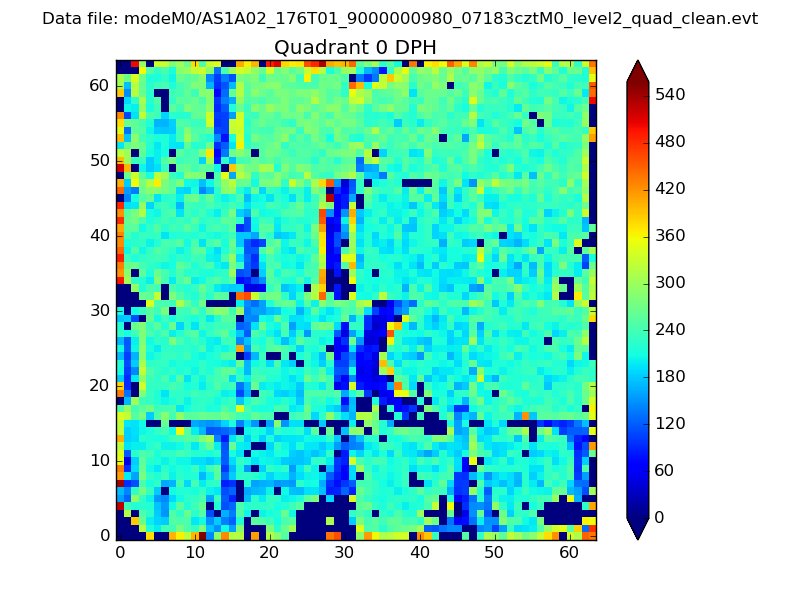 |
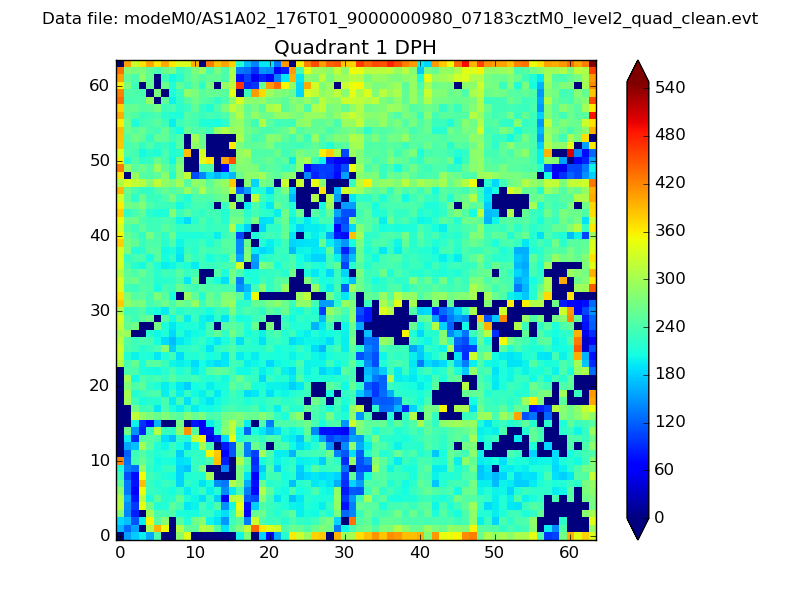 |
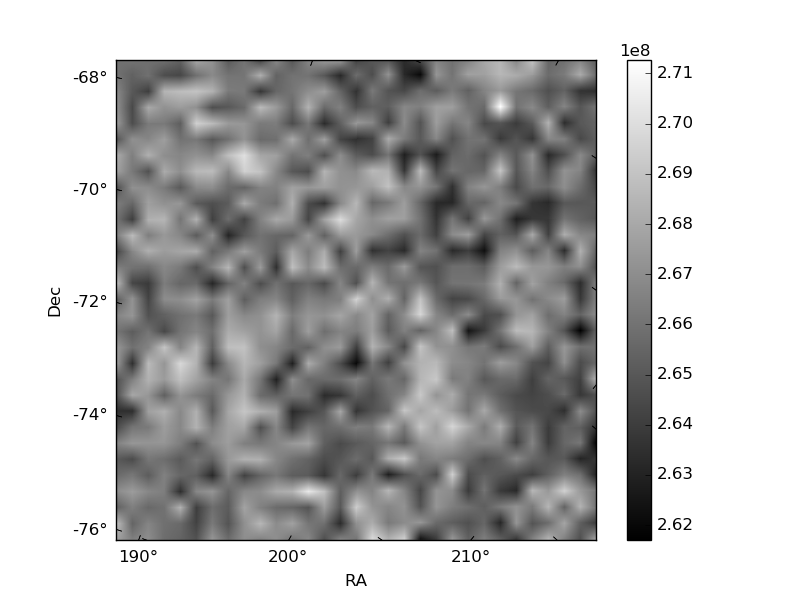
Quadrant B |
|---|---|---|---|
| Quadrant D | 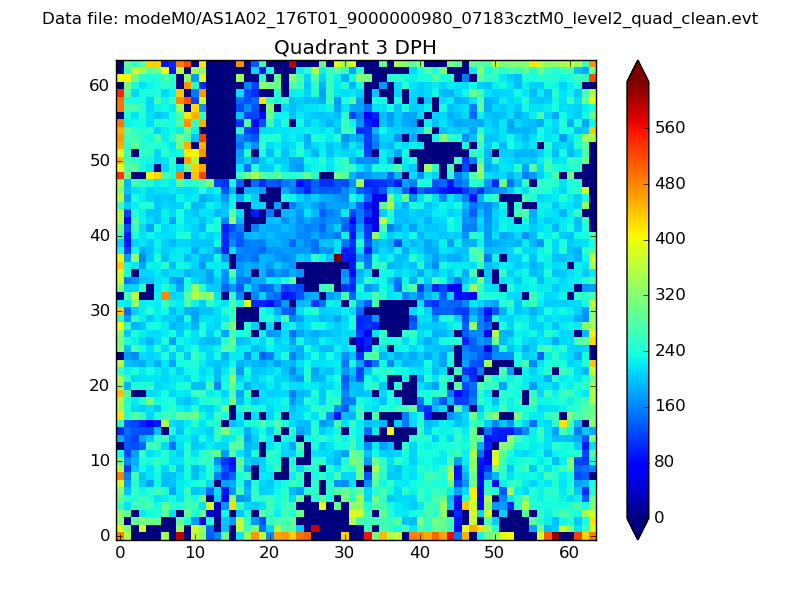 |
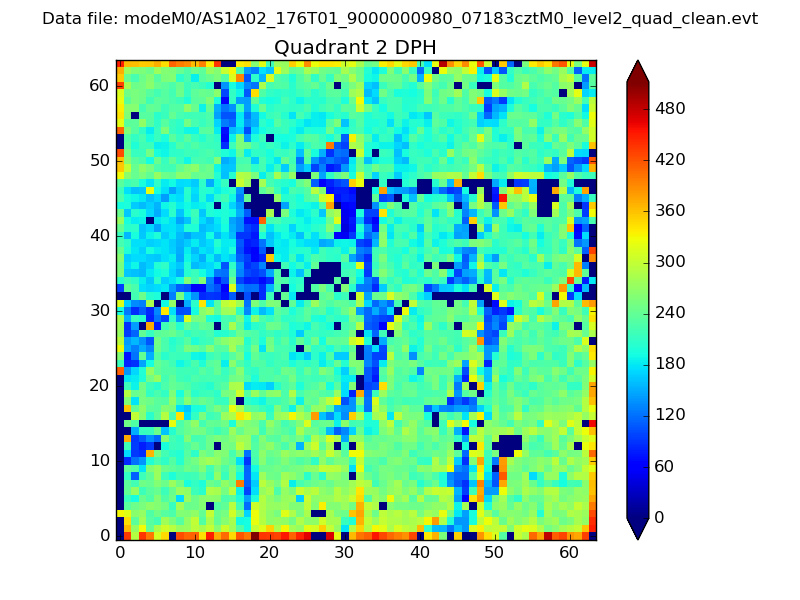 |
Quadrant C |
| Plot type | Count rate plots | Images |
|---|---|---|
| Comparison with Poisson distribution Blue bars denote a histogram of data divided into 1 sec bins. Red curve is a Poisson curve with rate = median count rate of data. |
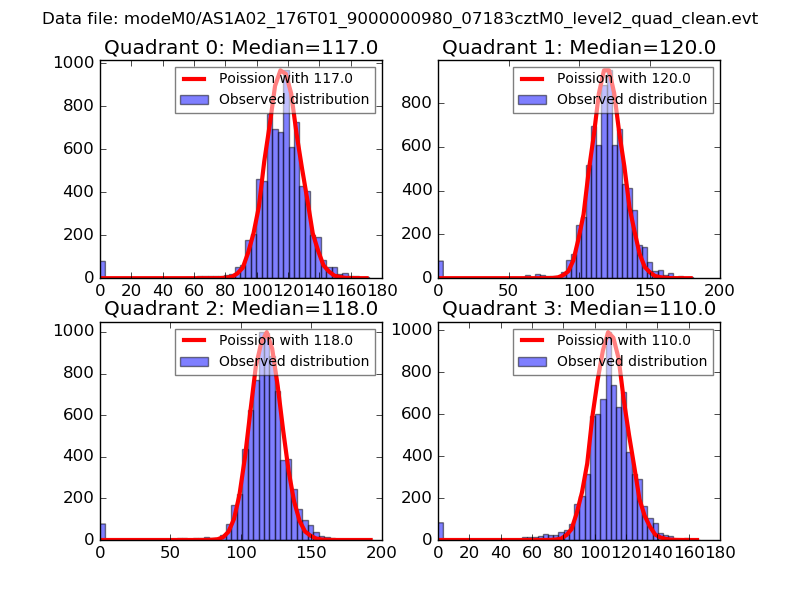 |
 |
| Quadrant-wise count rates Data is divided into 100 sec bins |
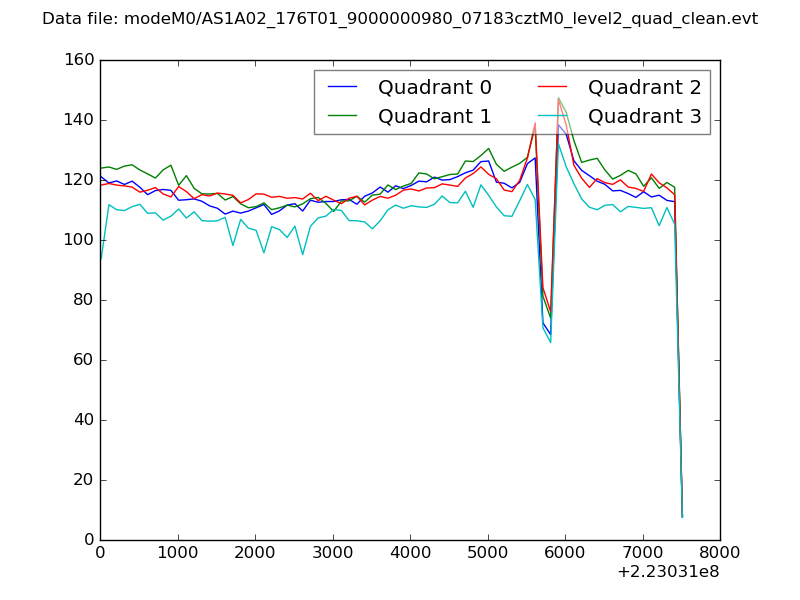 |
|
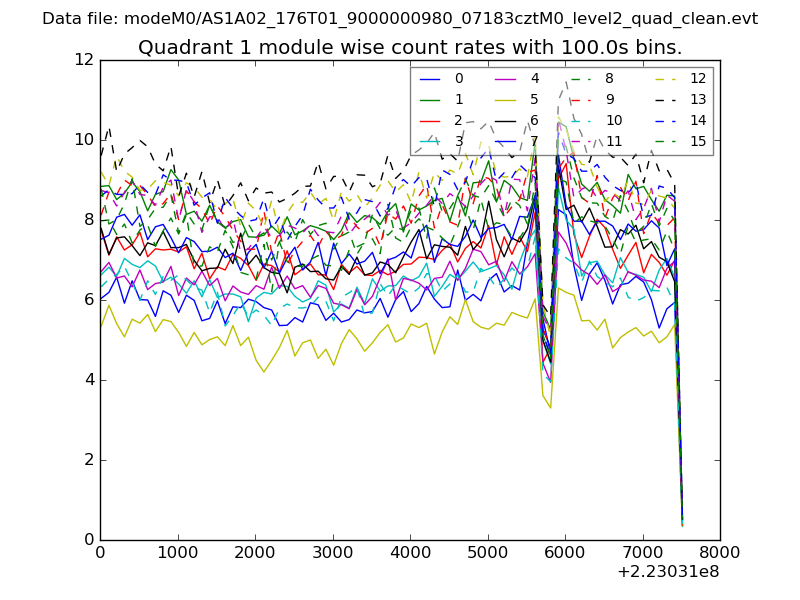
| Module-wise count rates for Quadrant A Data is divided into 100 sec bins |
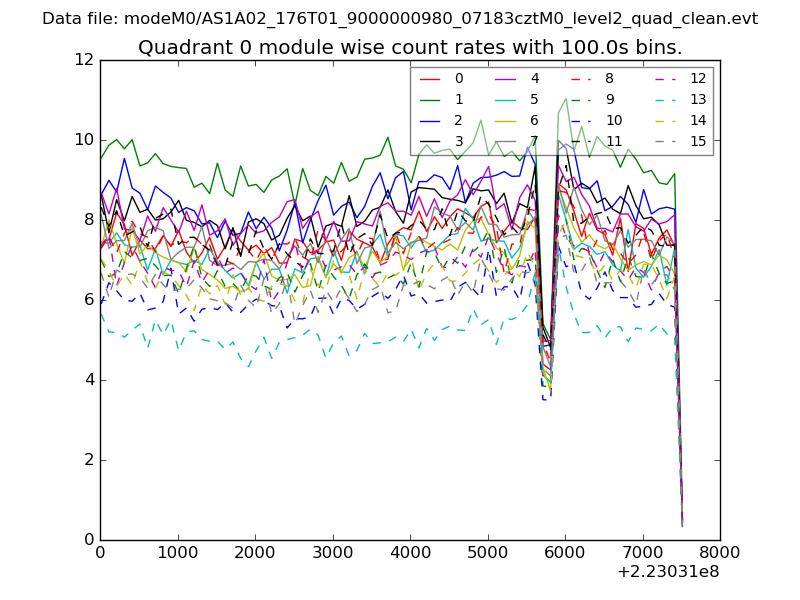 |
 |
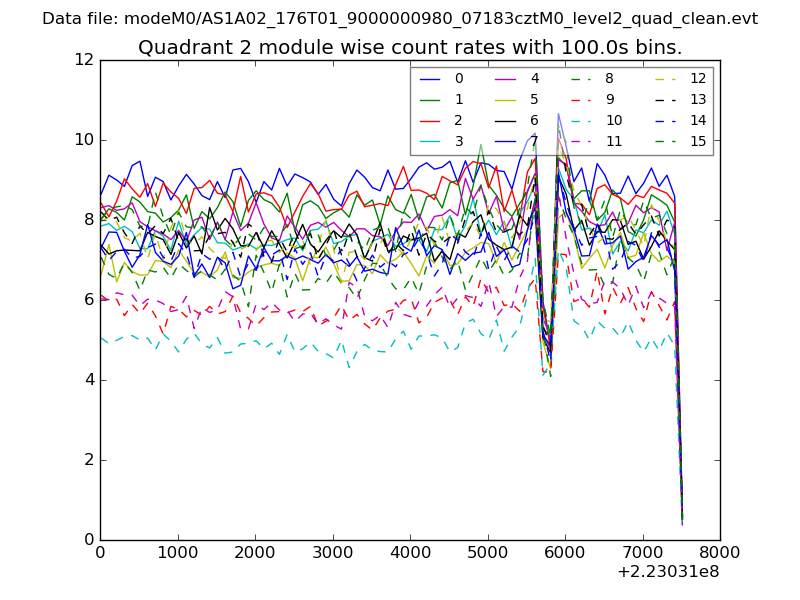
| Module-wise count rates for Quadrant B Data is divided into 100 sec bins |
 |
 |
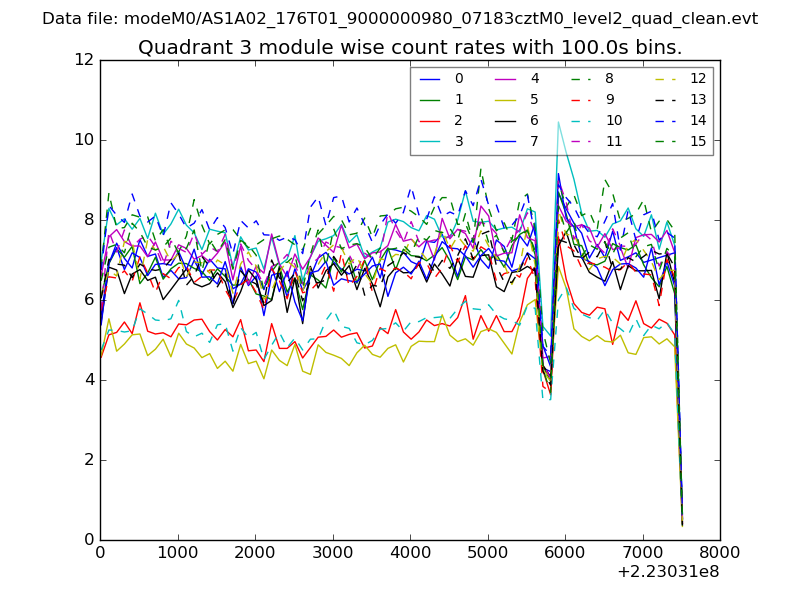
| Module-wise count rates for Quadrant C Data is divided into 100 sec bins |
 |
 |
| Module-wise count rates for Quadrant D Data is divided into 100 sec bins |
 |
 |
| Parameter | Plot |
|---|---|
| CZT HV Monitor | 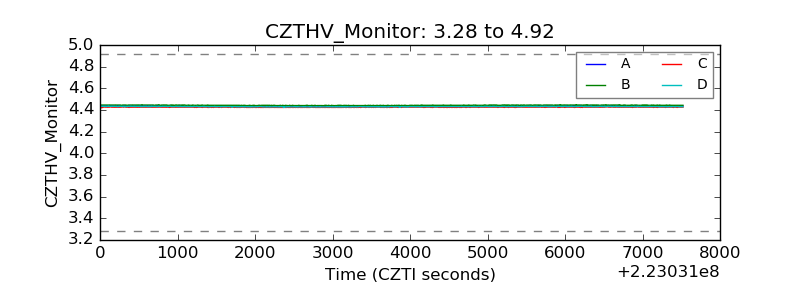 |
| D_VDD | 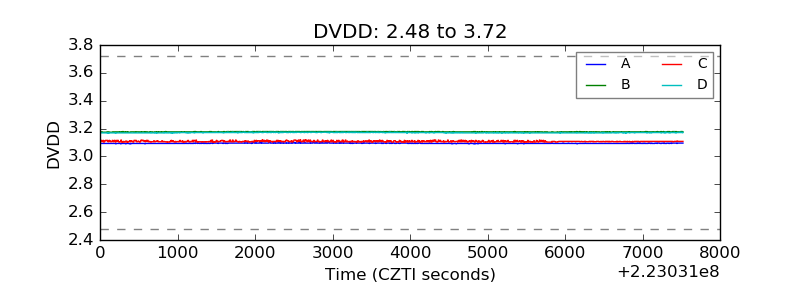 |
| Temperature 1 | 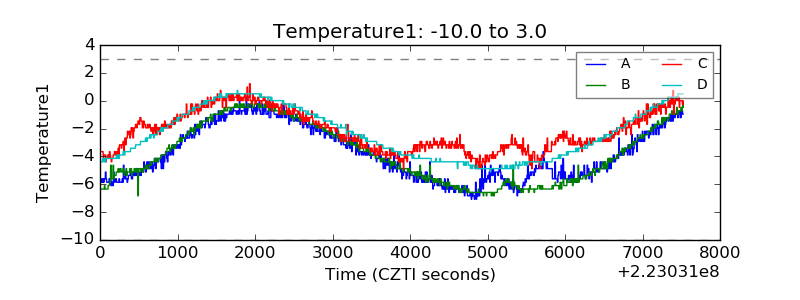 |
| Veto HV Monitor | 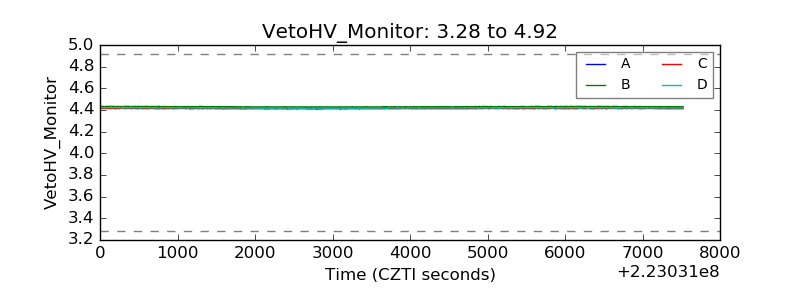 |
| Veto LLD | 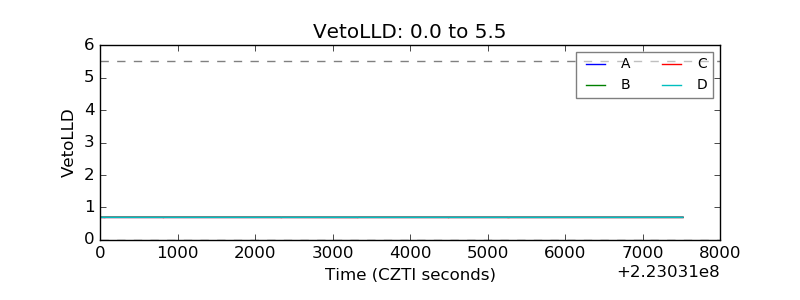 |
| Alpha Counter | 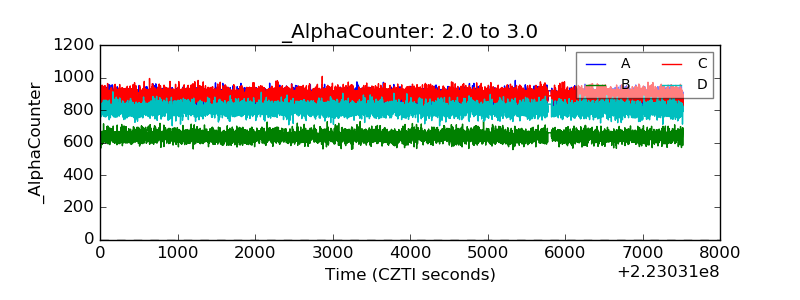 |
| _CPM_Rate | 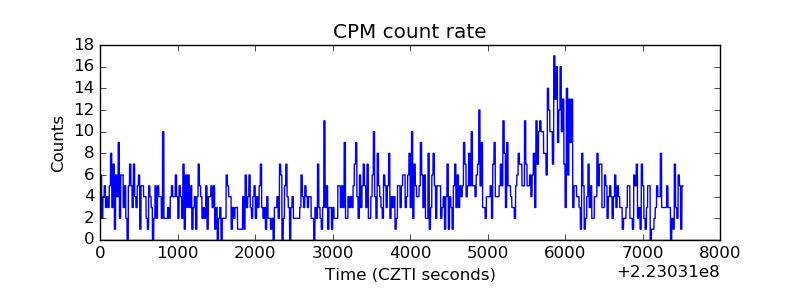 |
| CZT Counter | 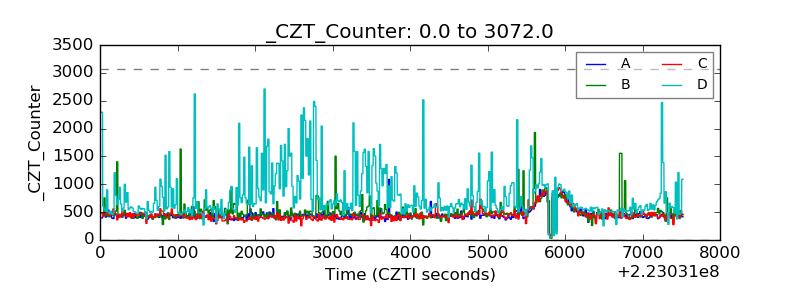 |
| +2.5 Volts monitor | 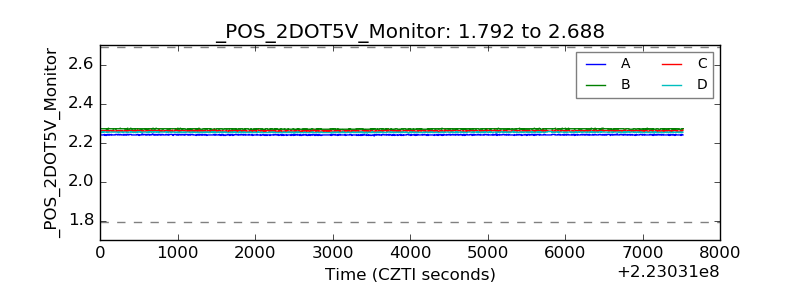 |
| +5 Volts monitor | 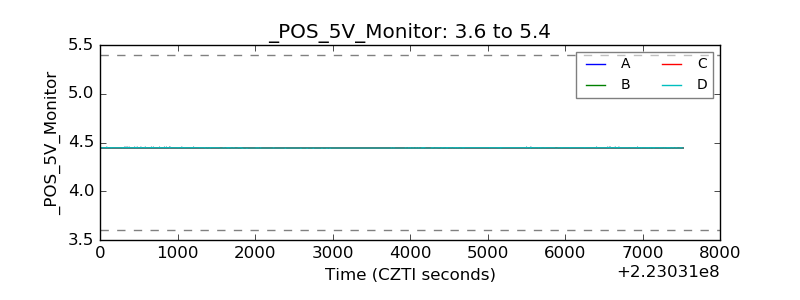 |
| _ROLL_ROT | 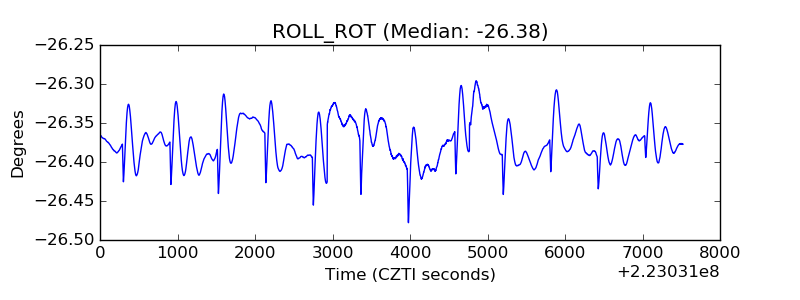 |
| _Roll_DEC | 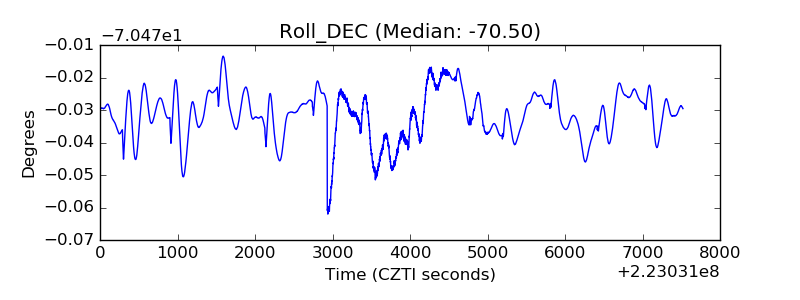 |
| _Roll_RA | 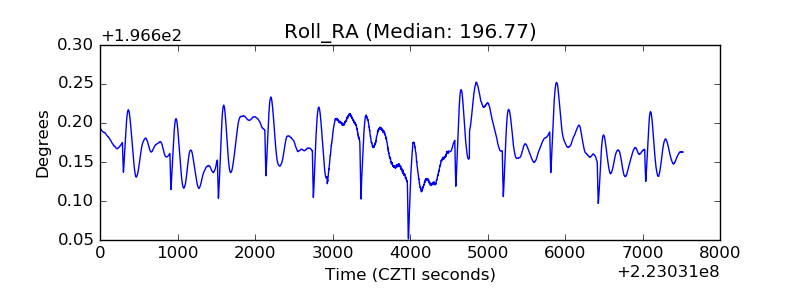 |
| Veto Counter | 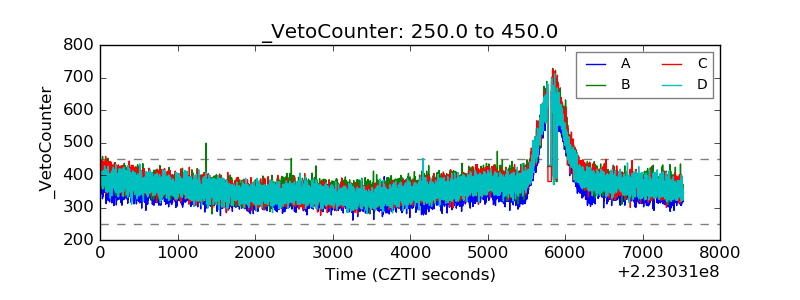 |