| Param | Original file | Final file |
|---|---|---|
| Filename | modeM0/AS1A02_176T01_9000000980_07187cztM0_level2.evt | modeM0/AS1A02_176T01_9000000980_07187cztM0_level2_quad_clean.evt |
| Size (bytes) | 1,611,218,880 | 405,550,080 |
| Size | 1.5 GB | 386.8 MB |
| Events in quadrant A | 10,344,115 | 2,705,397 |
| Events in quadrant B | 11,300,747 | 2,746,883 |
| Events in quadrant C | 10,114,905 | 2,700,760 |
| Events in quadrant D | 15,470,491 | 2,537,039 |
| Mode M9 | |||
|---|---|---|---|
| Quadrant | BADHDUFLAG | Total packets | Discarded packets |
| A | 0 | 18 | 0 |
| B | 0 | 18 | 0 |
| C | 0 | 18 | 0 |
| D | 0 | 18 | 0 |
| Mode M0 | |||
|---|---|---|---|
| Quadrant | BADHDUFLAG | Total packets | Discarded packets |
| A | 0 | 47395 | 6 |
| B | 0 | 48919 | 5 |
| C | 0 | 47271 | 5 |
| D | 0 | 61953 | 5 |
| Mode SS | |||
|---|---|---|---|
| Quadrant | BADHDUFLAG | Total packets | Discarded packets |
| A | 0 | 472 | 0 |
| B | 0 | 472 | 0 |
| C | 0 | 472 | 0 |
| D | 0 | 472 | 0 |
| Quadrant | Total seconds | Saturated seconds | Saturation percentage |
|---|---|---|---|
| A | 23152 | 441 | 1.904803% |
| B | 23152 | 480 | 2.073255% |
| C | 23152 | 326 | 1.408086% |
| D | 23152 | 1081 | 4.669143% |
Noise dominated data is calculated using 1-second bins in cleaned event files. If a bin has >2000 counts, and if more than 50% of those come from <1% of pixels, then it is considered to be noise-dominated and hence unusable.
| Quadrant | # 1 sec bins | Bins with >0 counts | Bins with >2000 counts | High rate bins dominated by noise | Noise dominated (total time) | Noise dominated (detector-on time) | Marked lightcurve |
|---|---|---|---|---|---|---|---|
| A | 25038 | 23153 | 0 | 0 | 0.00% | 0.00% | 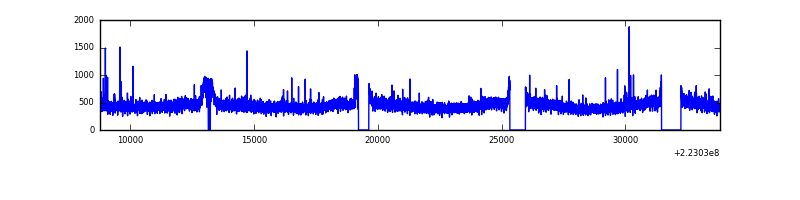 |
| B | 25038 | 23152 | 11 | 11 | 0.04% | 0.05% | 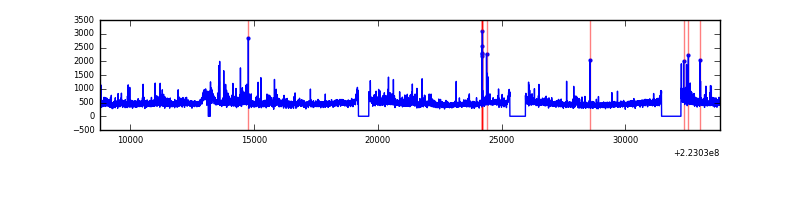 |
| C | 25038 | 23154 | 0 | 0 | 0.00% | 0.00% | 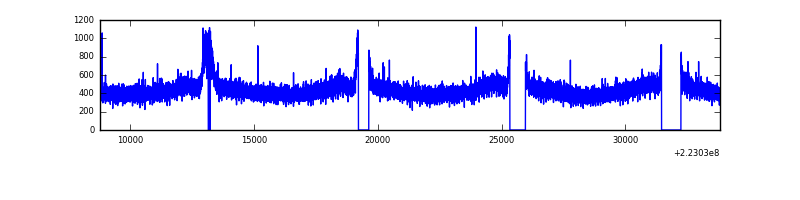 |
| D | 25038 | 23152 | 574 | 574 | 2.29% | 2.48% | 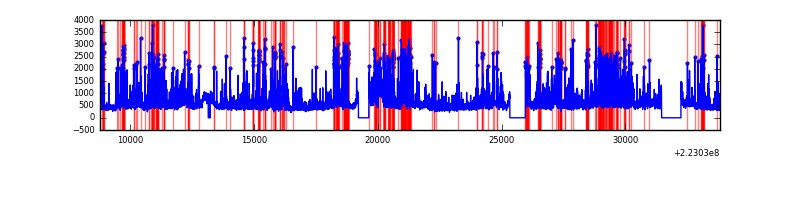 |
Top three noisy pixels from each quadrant. If the there are fewer than three noisy pixels in the level2.evt file, extra rows are filled as -1
| Pixel properties | Quadrant properties | ||||||
|---|---|---|---|---|---|---|---|
| Quadrant | DetID | PixID | Counts | Sigma | Mean | Median | Sigma |
| A | 13 | 248 | 27777 | 46.55 | 2653 | 2593 | 541.0 |
| A | 15 | 234 | 27510 | 46.05 | 2653 | 2593 | 541.0 |
| A | 0 | 226 | 25412 | 42.18 | 2653 | 2593 | 541.0 |
| B | 0 | 219 | 282566 | 552.99 | 2683 | 2613 | 506.3 |
| B | 0 | 214 | 265218 | 518.72 | 2683 | 2613 | 506.3 |
| B | 4 | 81 | 123124 | 238.04 | 2683 | 2613 | 506.3 |
| C | 13 | 61 | 20700 | 30.42 | 2583 | 2585 | 595.4 |
| C | 8 | 128 | 14922 | 20.72 | 2583 | 2585 | 595.4 |
| C | 8 | 112 | 10119 | 12.65 | 2583 | 2585 | 595.4 |
| D | 2 | 216 | 2480568 | 3963.78 | 2549 | 2460 | 625.2 |
| D | 14 | 34 | 1253356 | 2000.83 | 2549 | 2460 | 625.2 |
| D | 8 | 195 | 1183825 | 1889.61 | 2549 | 2460 | 625.2 |
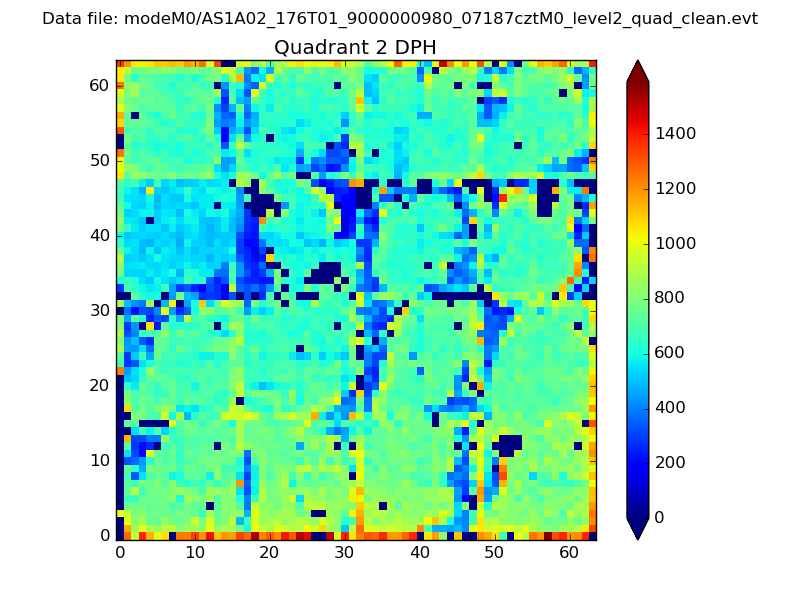
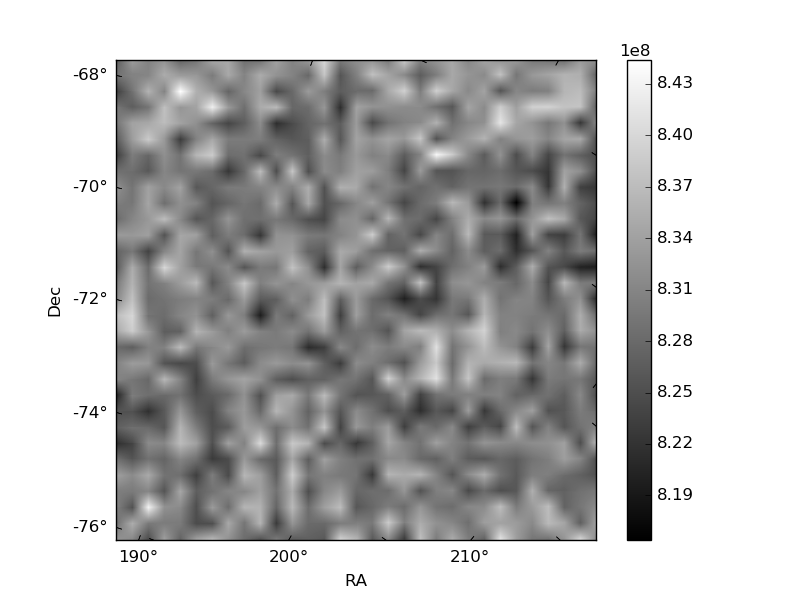
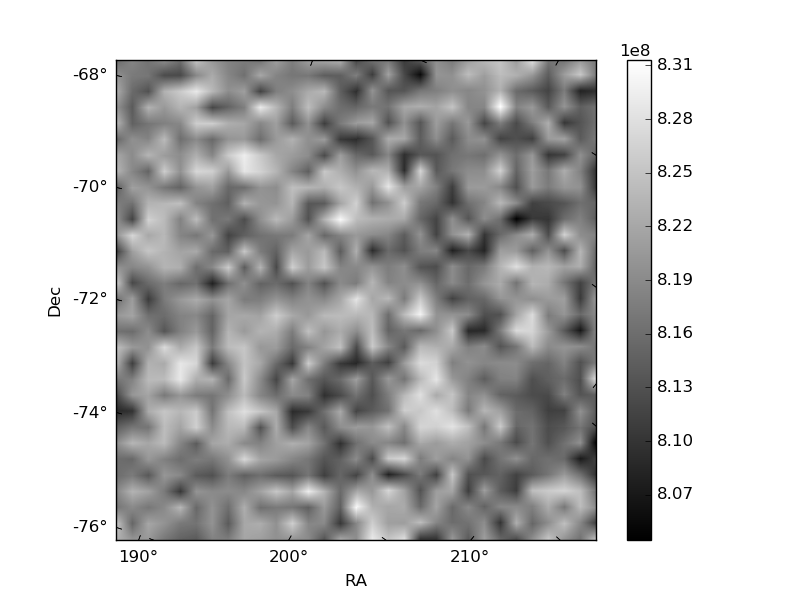
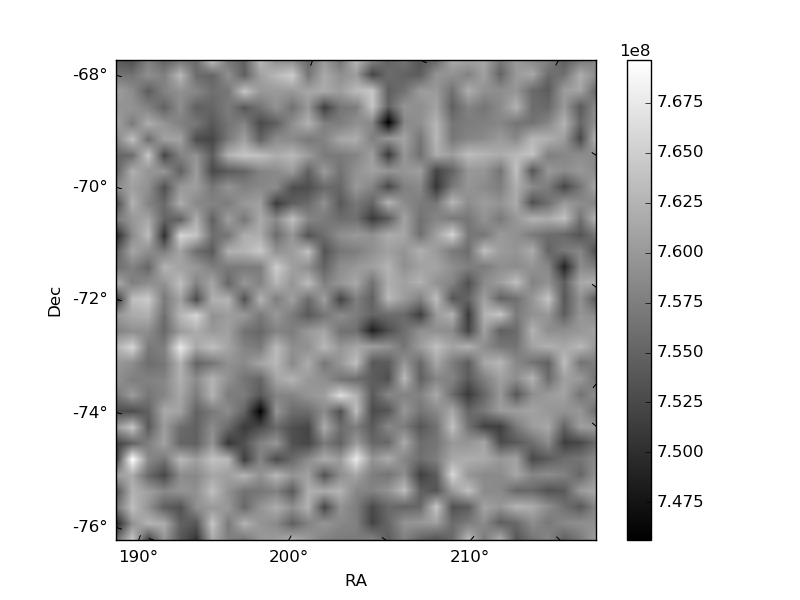
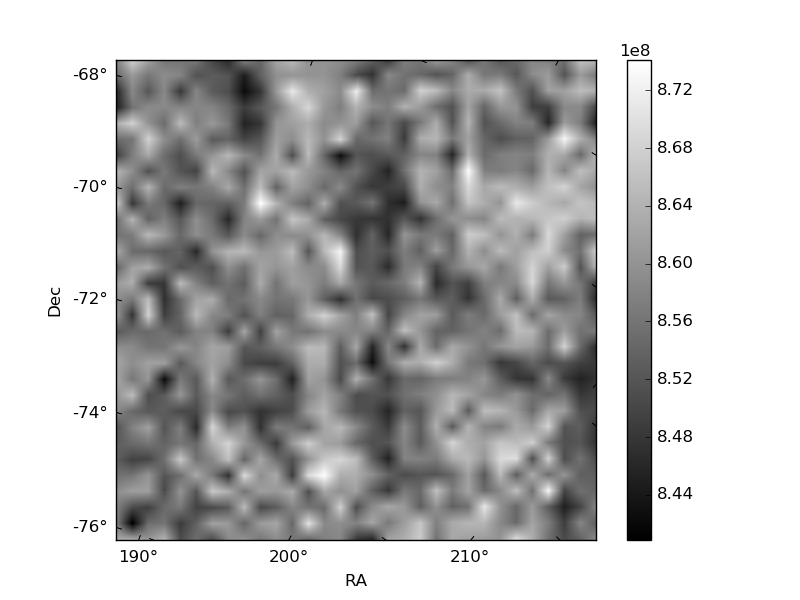
Histogram calculated using DETX and DETY for each event in the final _common_clean file
| Quadrant A | 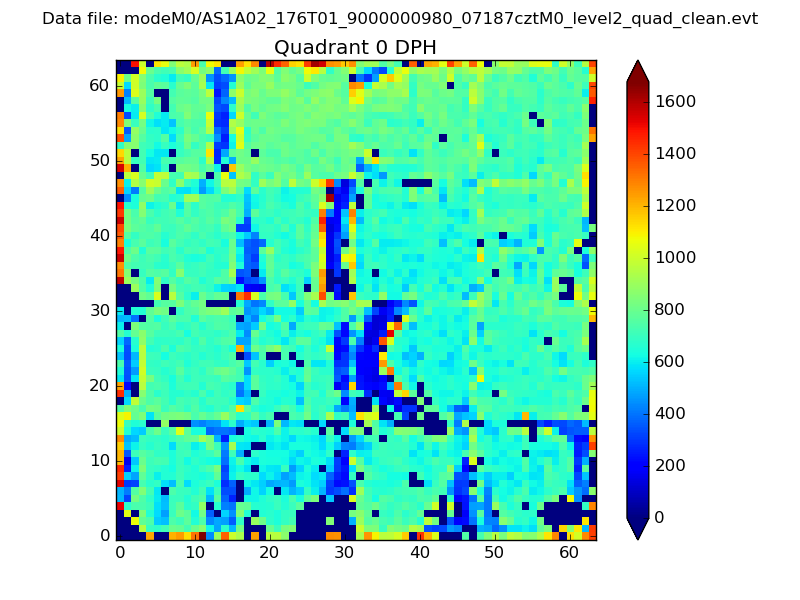 |
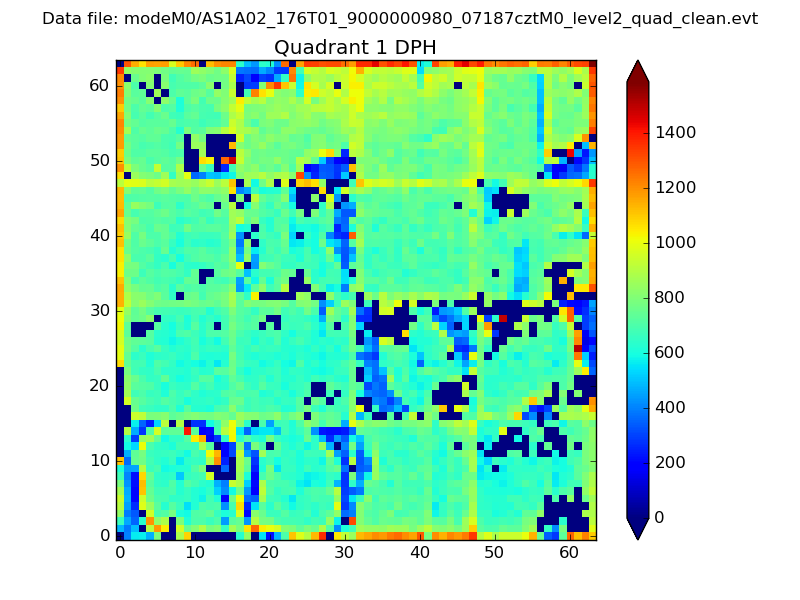 |
Quadrant B |
|---|---|---|---|
| Quadrant D | 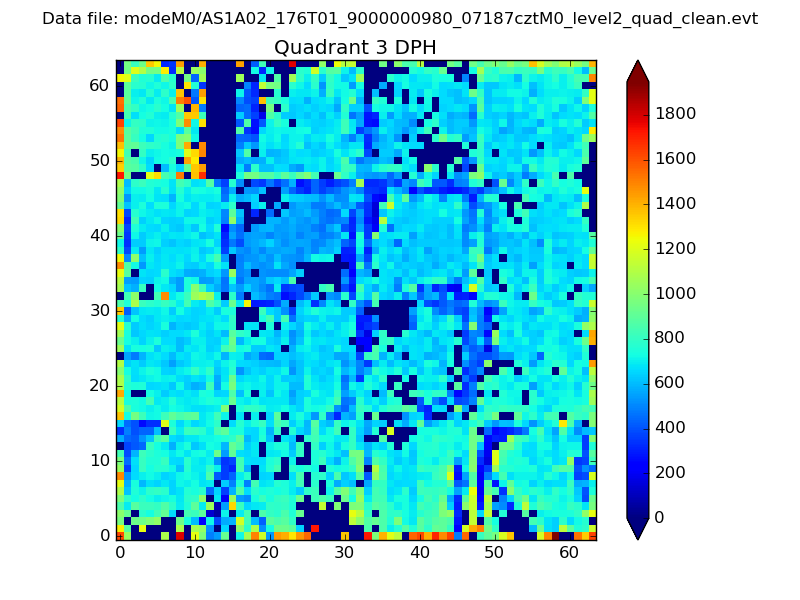 |
 |
Quadrant C |
| Plot type | Count rate plots | Images |
|---|---|---|
| Comparison with Poisson distribution Blue bars denote a histogram of data divided into 1 sec bins. Red curve is a Poisson curve with rate = median count rate of data. |
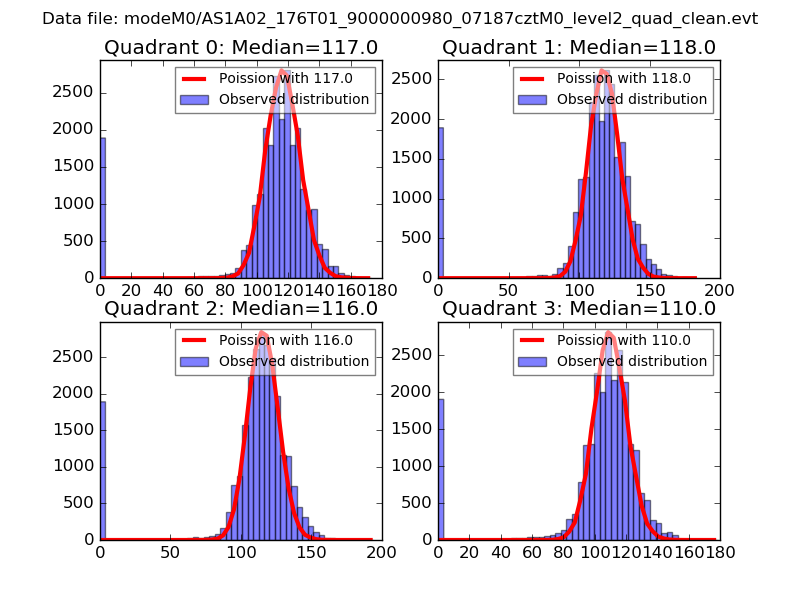 |
 |
| Quadrant-wise count rates Data is divided into 100 sec bins |
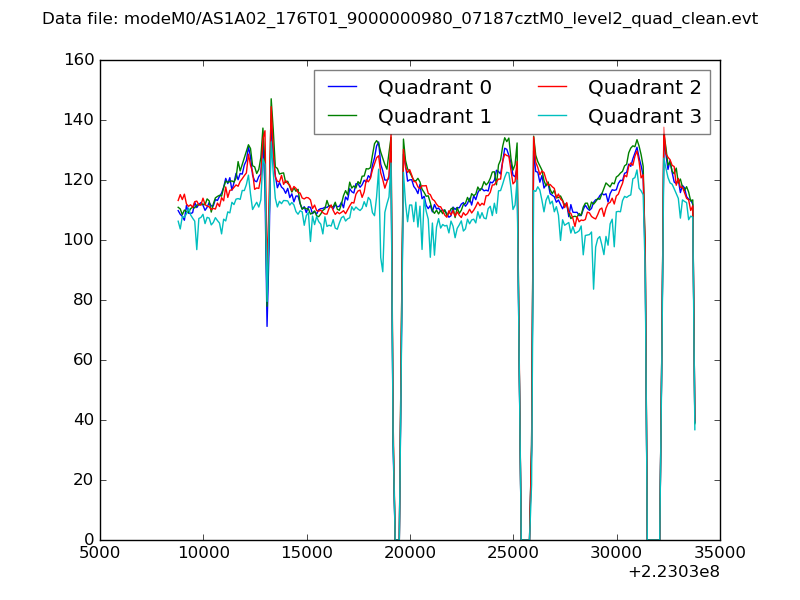 |
|
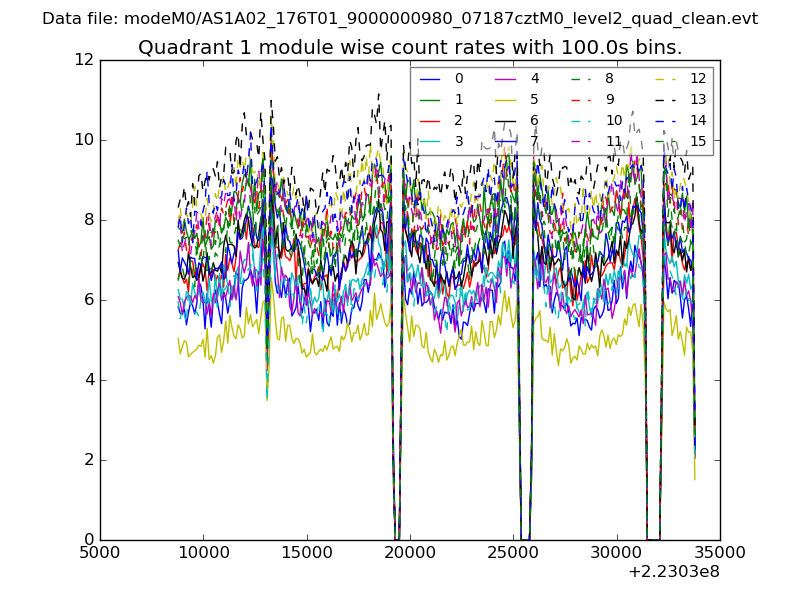
| Module-wise count rates for Quadrant A Data is divided into 100 sec bins |
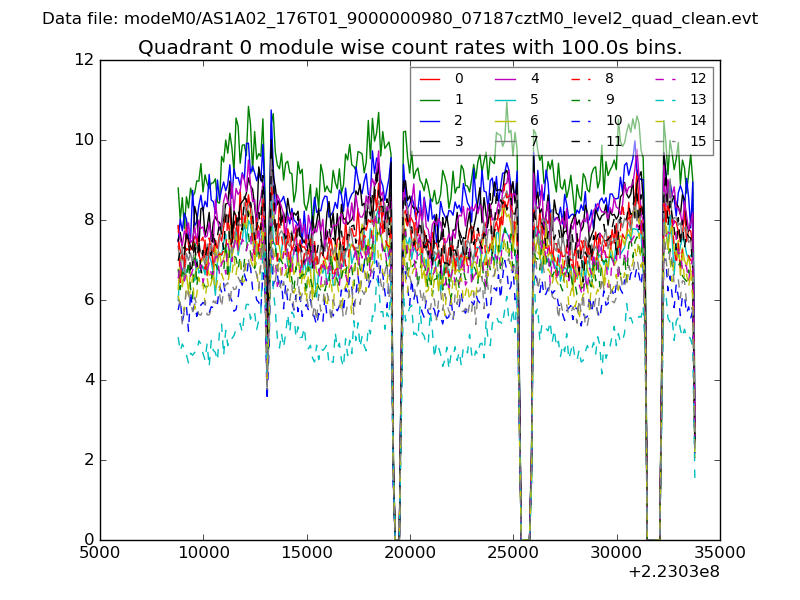 |
 |
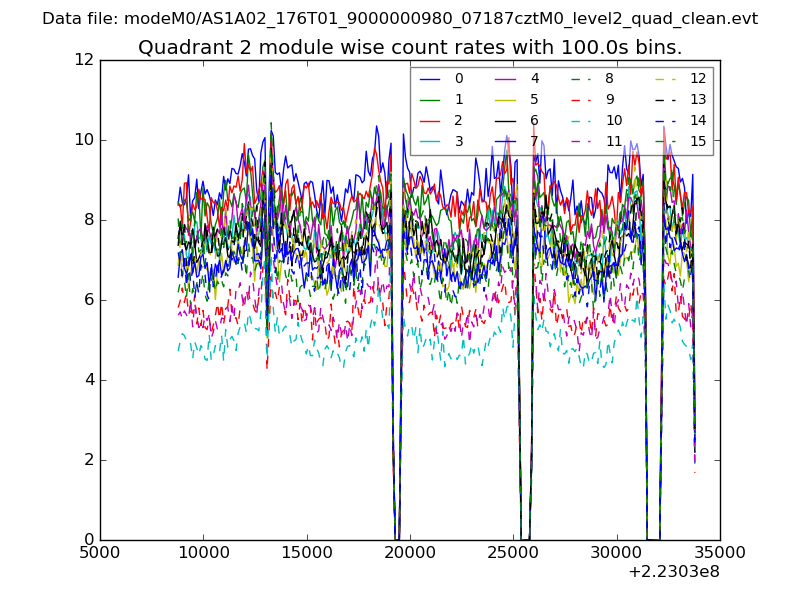
| Module-wise count rates for Quadrant B Data is divided into 100 sec bins |
 |
 |
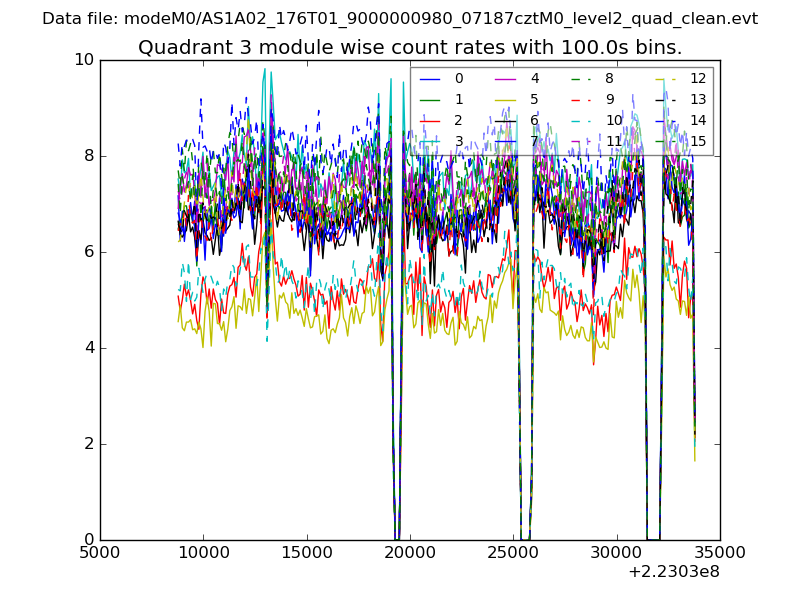
| Module-wise count rates for Quadrant C Data is divided into 100 sec bins |
 |
 |
| Module-wise count rates for Quadrant D Data is divided into 100 sec bins |
 |
 |
| Parameter | Plot |
|---|---|
| CZT HV Monitor | 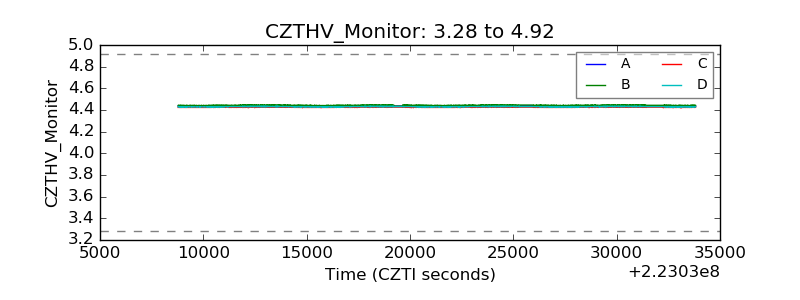 |
| D_VDD | 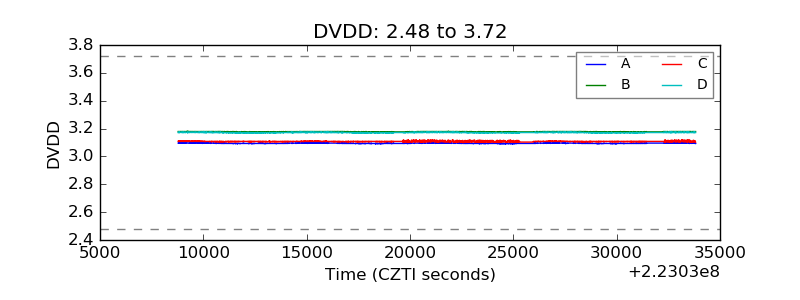 |
| Temperature 1 | 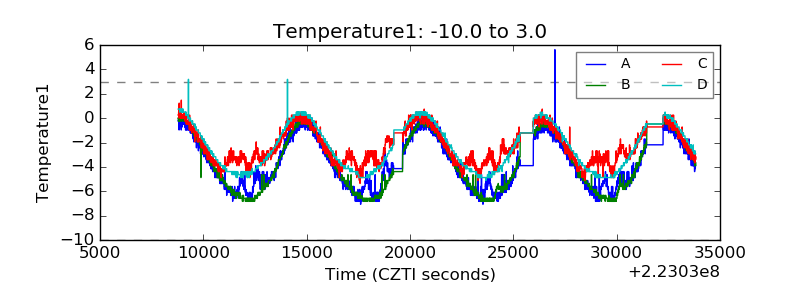 |
| Veto HV Monitor | 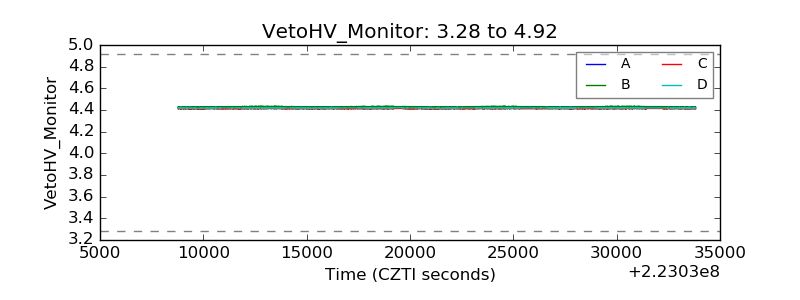 |
| Veto LLD | 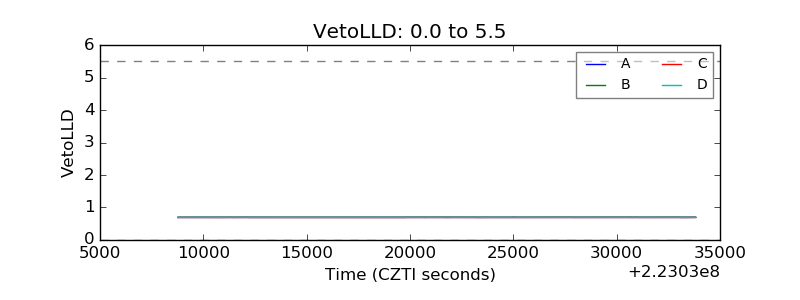 |
| Alpha Counter | 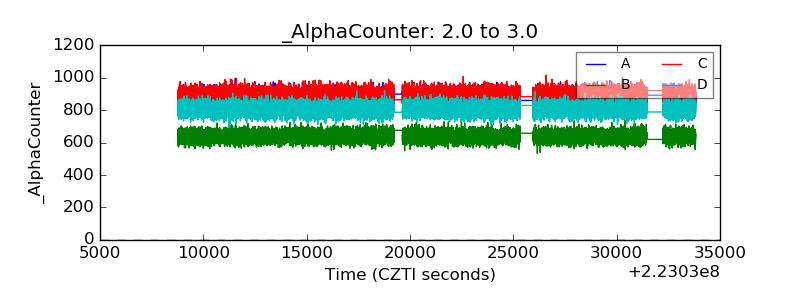 |
| _CPM_Rate | 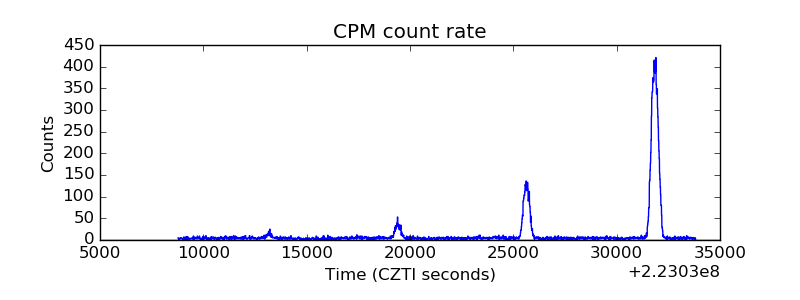 |
| CZT Counter | 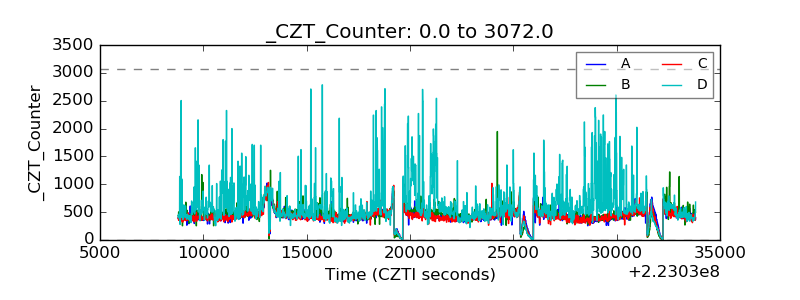 |
| +2.5 Volts monitor | 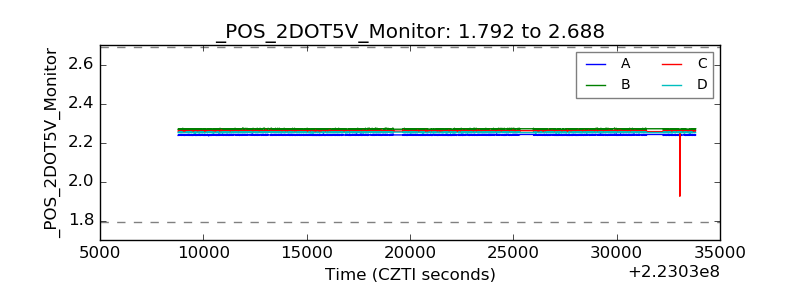 |
| +5 Volts monitor | 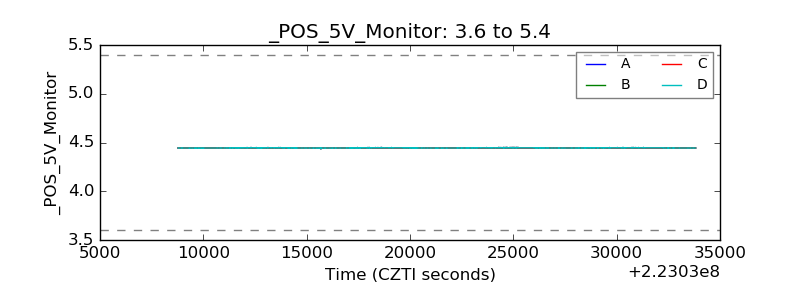 |
| _ROLL_ROT | 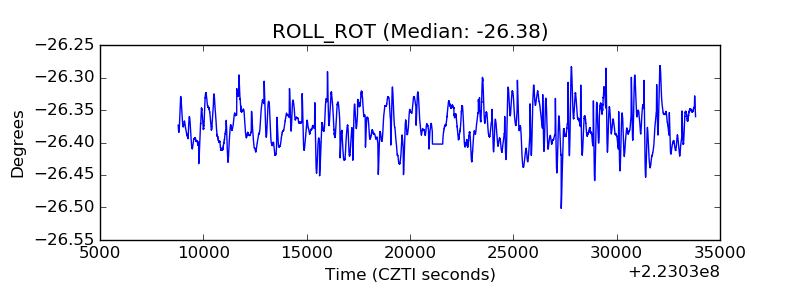 |
| _Roll_DEC | 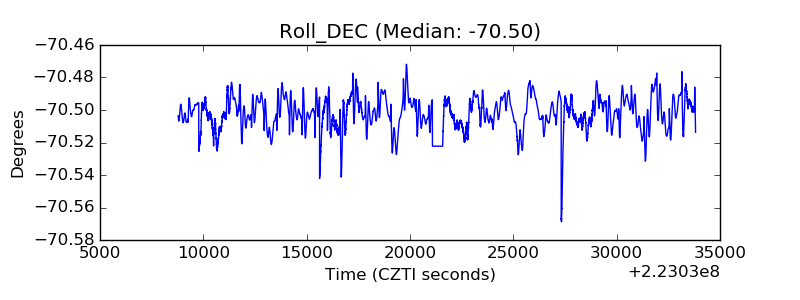 |
| _Roll_RA | 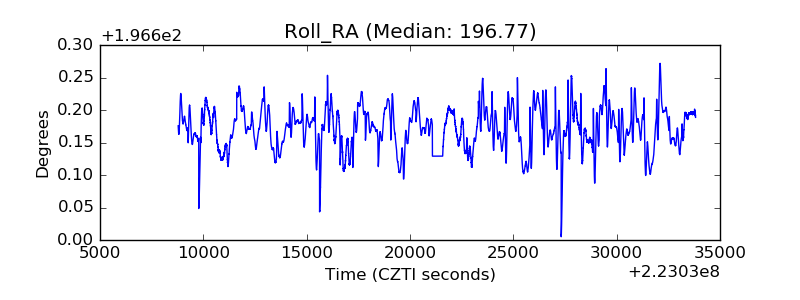 |
| Veto Counter | 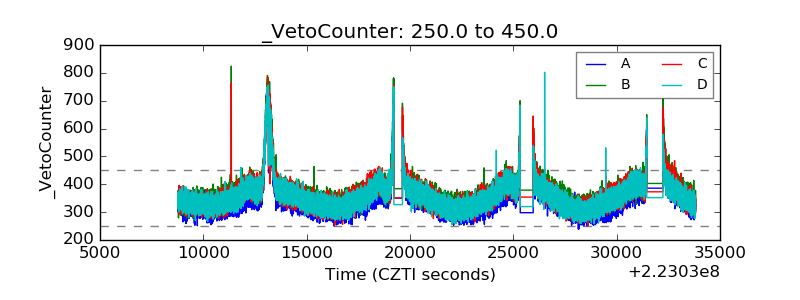 |