| Param | Original file | Final file |
|---|---|---|
| Filename | modeM0/AS1A02_176T01_9000000980_07188cztM0_level2.evt | modeM0/AS1A02_176T01_9000000980_07188cztM0_level2_quad_clean.evt |
| Size (bytes) | 462,323,520 | 121,849,920 |
| Size | 440.9 MB | 116.2 MB |
| Events in quadrant A | 3,167,728 | 813,312 |
| Events in quadrant B | 3,327,678 | 829,515 |
| Events in quadrant C | 2,970,065 | 807,165 |
| Events in quadrant D | 4,072,843 | 765,481 |
| Mode M9 | |||
|---|---|---|---|
| Quadrant | BADHDUFLAG | Total packets | Discarded packets |
| A | 0 | 16 | 0 |
| B | 0 | 16 | 0 |
| C | 0 | 16 | 0 |
| D | 0 | 16 | 0 |
| Mode M0 | |||
|---|---|---|---|
| Quadrant | BADHDUFLAG | Total packets | Discarded packets |
| A | 0 | 14224 | 3 |
| B | 0 | 14515 | 2 |
| C | 0 | 13791 | 2 |
| D | 0 | 16975 | 2 |
| Mode SS | |||
|---|---|---|---|
| Quadrant | BADHDUFLAG | Total packets | Discarded packets |
| A | 0 | 138 | 0 |
| B | 0 | 138 | 0 |
| C | 0 | 138 | 0 |
| D | 0 | 138 | 0 |
| Quadrant | Total seconds | Saturated seconds | Saturation percentage |
|---|---|---|---|
| A | 6811 | 61 | 0.895610% |
| B | 6811 | 64 | 0.939656% |
| C | 6811 | 18 | 0.264278% |
| D | 6811 | 153 | 2.246366% |
Noise dominated data is calculated using 1-second bins in cleaned event files. If a bin has >2000 counts, and if more than 50% of those come from <1% of pixels, then it is considered to be noise-dominated and hence unusable.
| Quadrant | # 1 sec bins | Bins with >0 counts | Bins with >2000 counts | High rate bins dominated by noise | Noise dominated (total time) | Noise dominated (detector-on time) | Marked lightcurve |
|---|---|---|---|---|---|---|---|
| A | 7756 | 6811 | 23 | 23 | 0.30% | 0.34% | 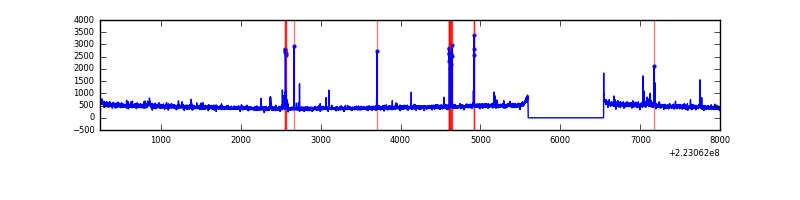 |
| B | 7756 | 6811 | 3 | 3 | 0.04% | 0.04% | 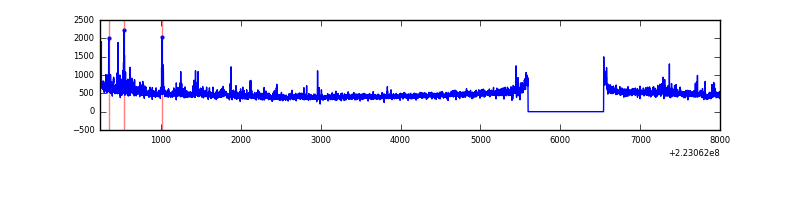 |
| C | 7756 | 6812 | 0 | 0 | 0.00% | 0.00% | 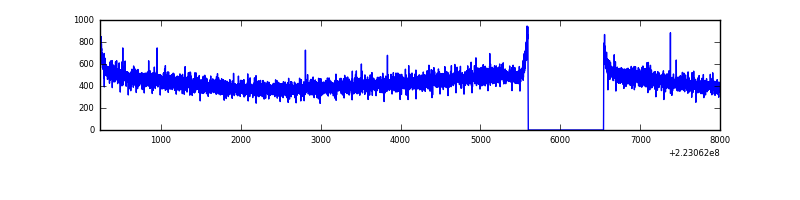 |
| D | 7756 | 6812 | 88 | 88 | 1.13% | 1.29% | 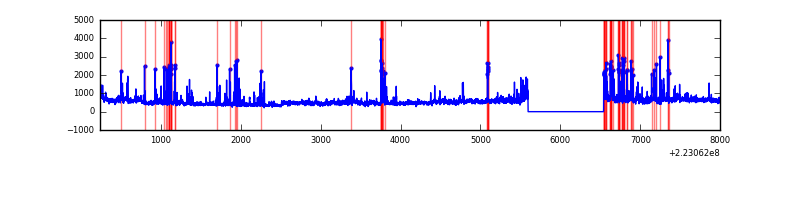 |
Top three noisy pixels from each quadrant. If the there are fewer than three noisy pixels in the level2.evt file, extra rows are filled as -1
| Pixel properties | Quadrant properties | ||||||
|---|---|---|---|---|---|---|---|
| Quadrant | DetID | PixID | Counts | Sigma | Mean | Median | Sigma |
| A | 13 | 248 | 84303 | 523.1 | 781 | 765 | 159.7 |
| A | 14 | 238 | 41258 | 253.56 | 781 | 765 | 159.7 |
| A | 13 | 14 | 10563 | 61.35 | 781 | 765 | 159.7 |
| B | 0 | 214 | 98842 | 643.3 | 793 | 774 | 152.4 |
| B | 4 | 81 | 70381 | 456.6 | 793 | 774 | 152.4 |
| B | 0 | 219 | 29710 | 189.81 | 793 | 774 | 152.4 |
| C | 8 | 128 | 10168 | 53.31 | 754 | 755 | 176.6 |
| C | 8 | 112 | 6150 | 30.56 | 754 | 755 | 176.6 |
| C | 13 | 61 | 6092 | 30.23 | 754 | 755 | 176.6 |
| D | 8 | 195 | 587703 | 3213.75 | 746 | 720 | 182.6 |
| D | 2 | 216 | 284119 | 1551.62 | 746 | 720 | 182.6 |
| D | 14 | 34 | 247457 | 1350.89 | 746 | 720 | 182.6 |
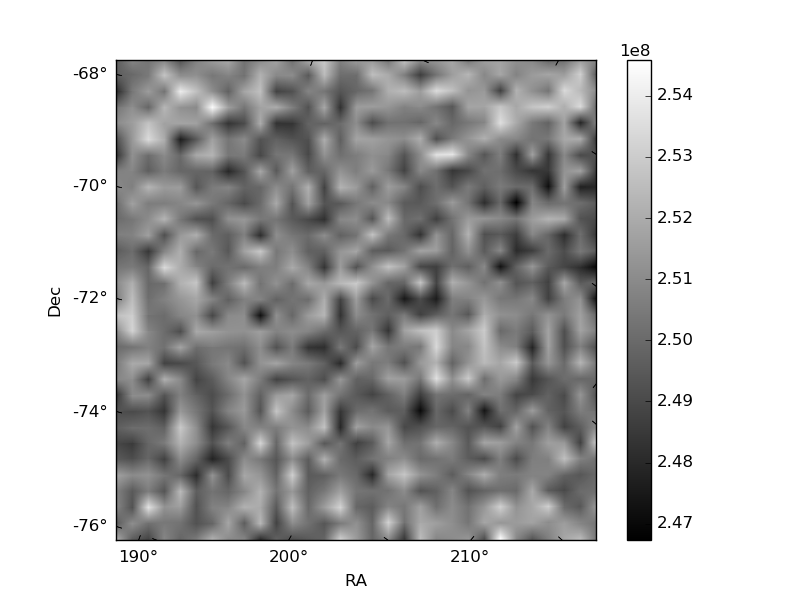
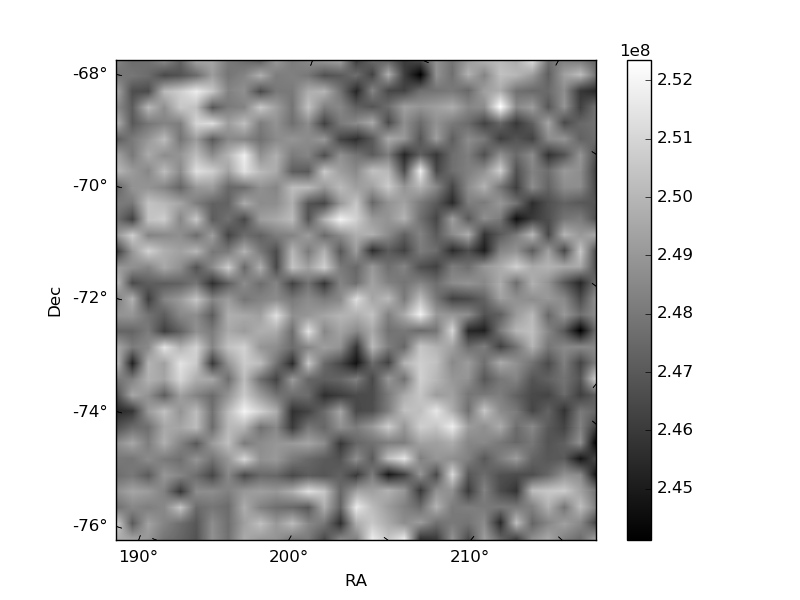
Histogram calculated using DETX and DETY for each event in the final _common_clean file
| Quadrant A | 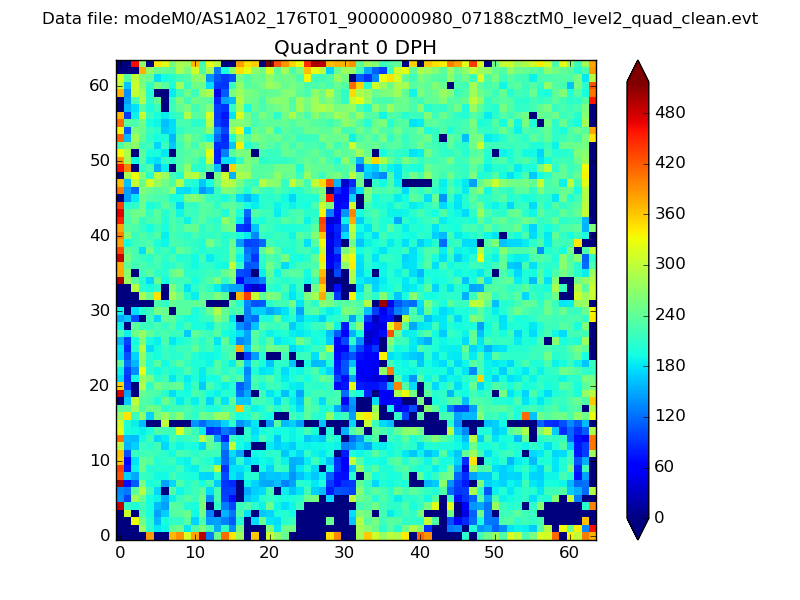 |
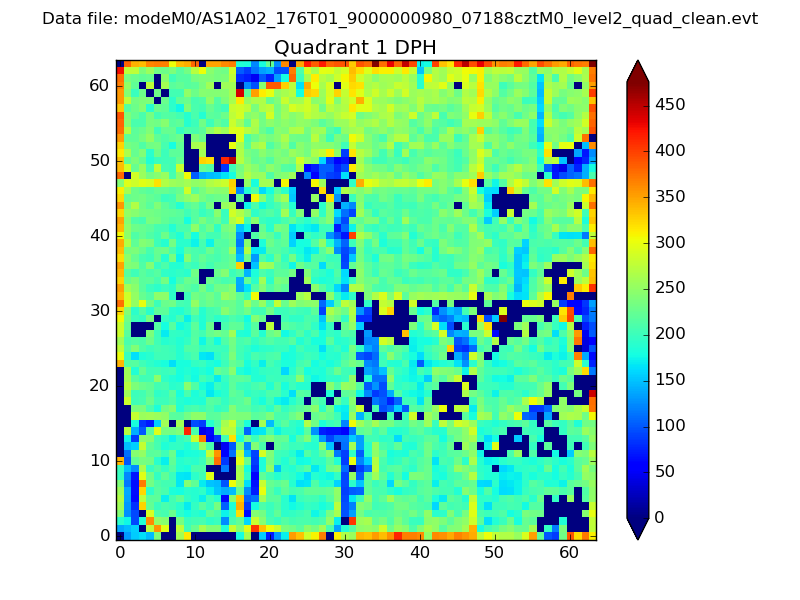 |
Quadrant B |
|---|---|---|---|
| Quadrant D | 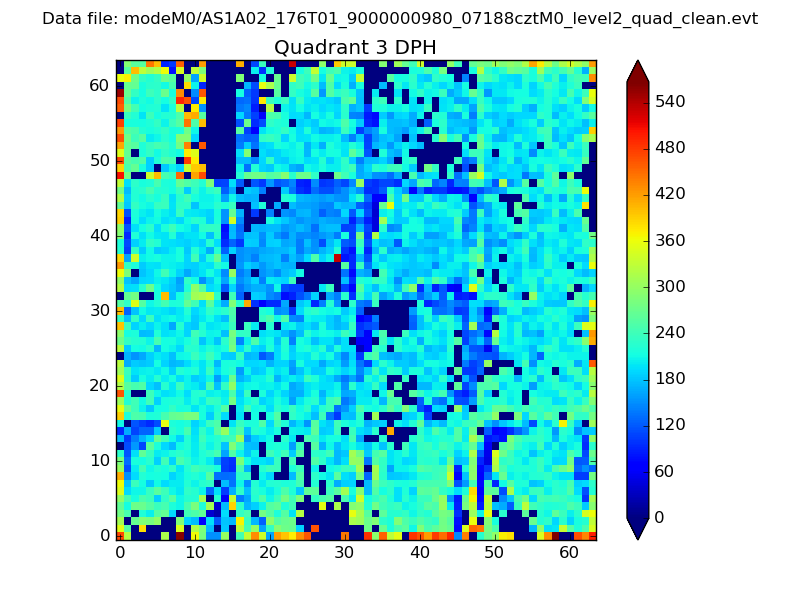 |
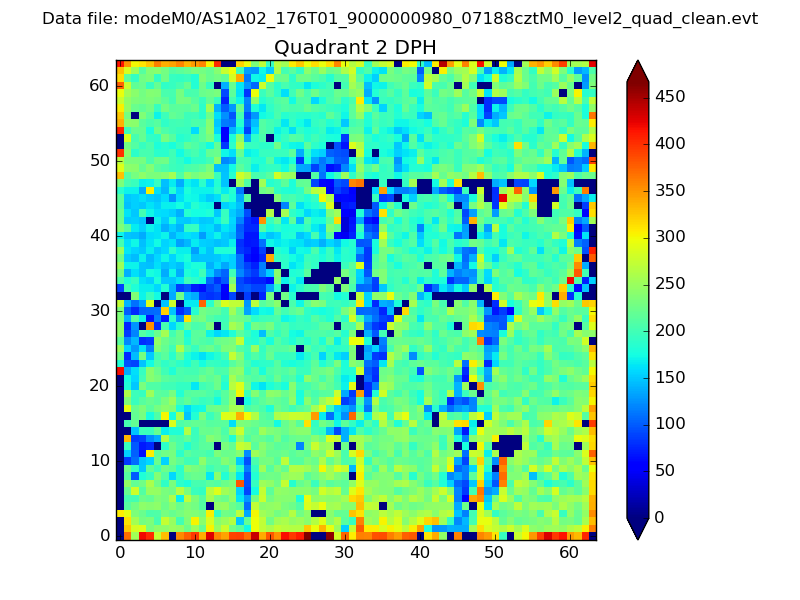 |
Quadrant C |
| Plot type | Count rate plots | Images |
|---|---|---|
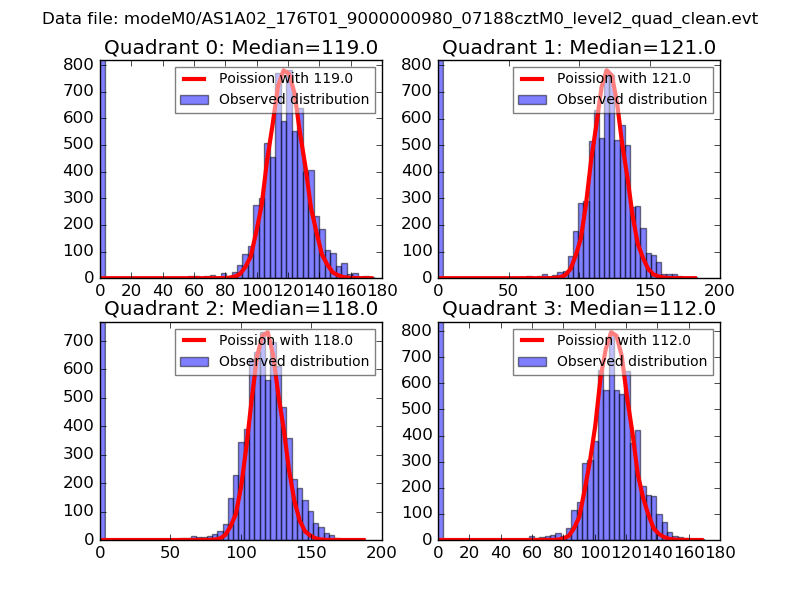
| Comparison with Poisson distribution Blue bars denote a histogram of data divided into 1 sec bins. Red curve is a Poisson curve with rate = median count rate of data. |
 |
 |
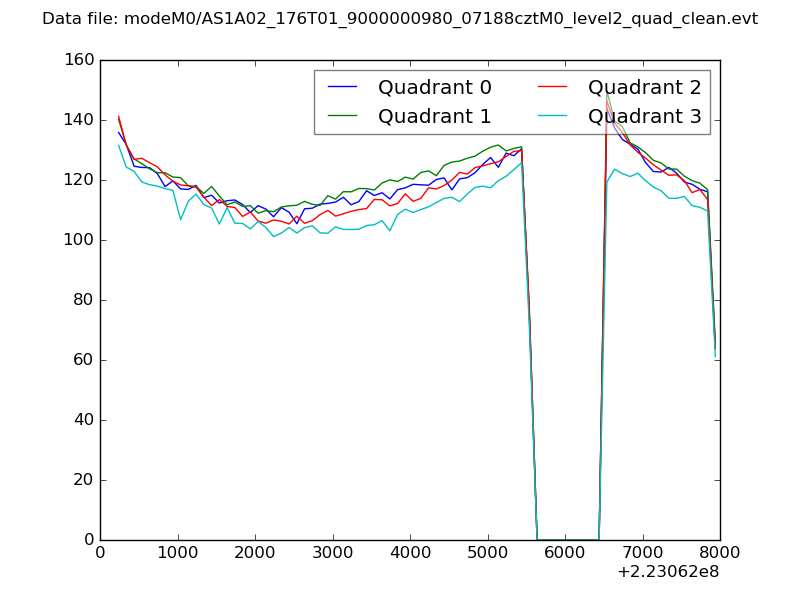
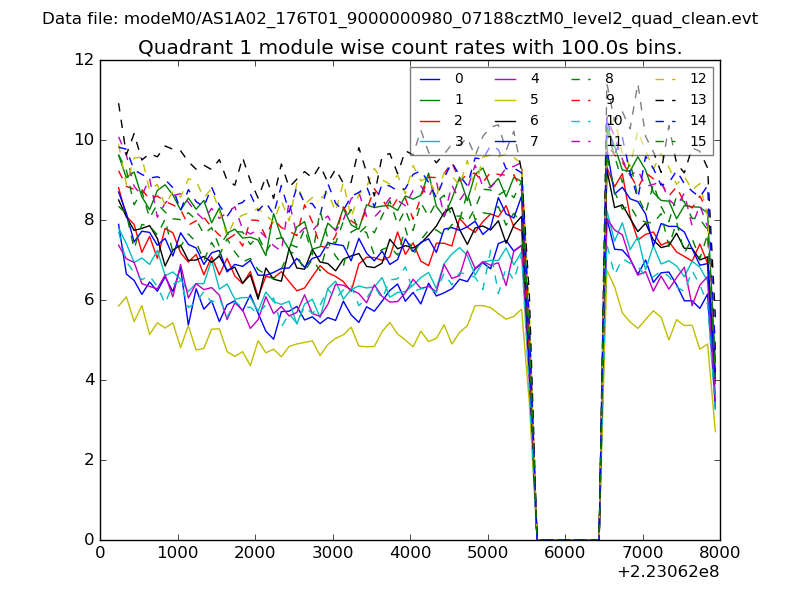
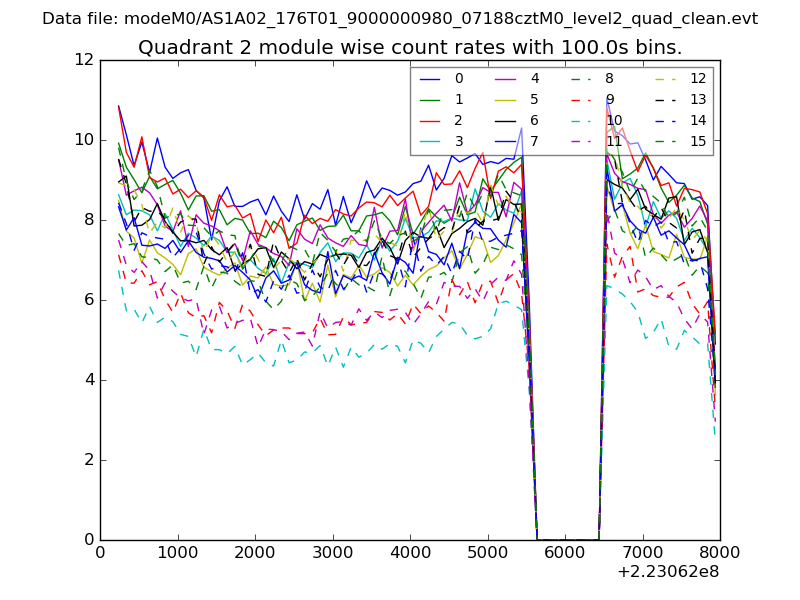
| Quadrant-wise count rates Data is divided into 100 sec bins |
 |
|
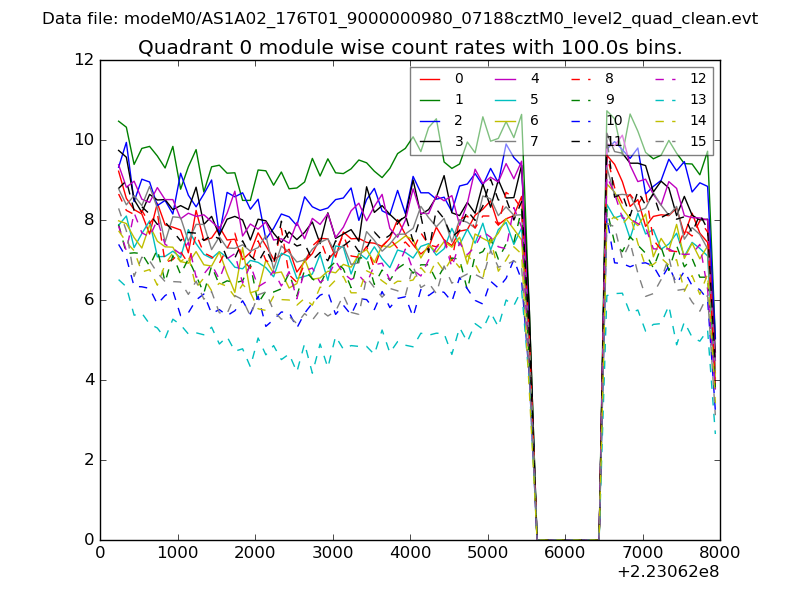
| Module-wise count rates for Quadrant A Data is divided into 100 sec bins |
 |
 |
| Module-wise count rates for Quadrant B Data is divided into 100 sec bins |
 |
 |
| Module-wise count rates for Quadrant C Data is divided into 100 sec bins |
 |
 |
| Module-wise count rates for Quadrant D Data is divided into 100 sec bins |
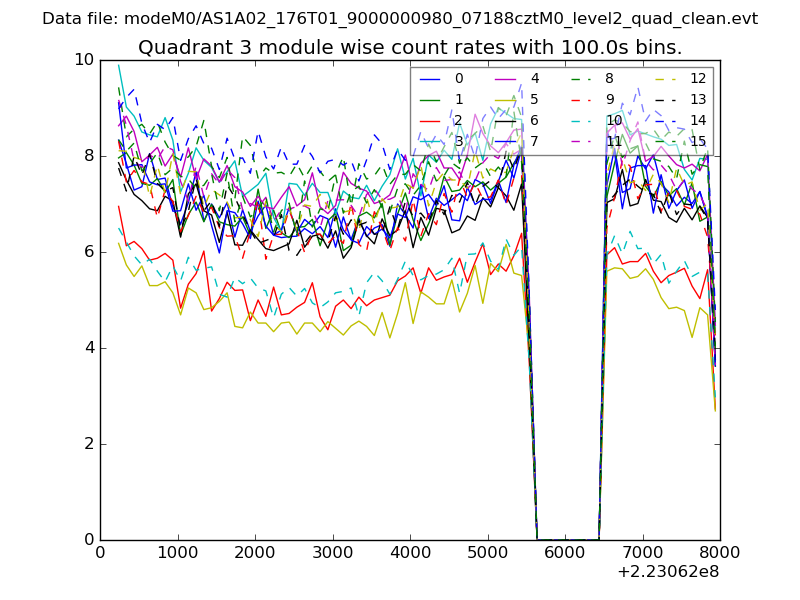 |
 |
| Parameter | Plot |
|---|---|
| CZT HV Monitor | 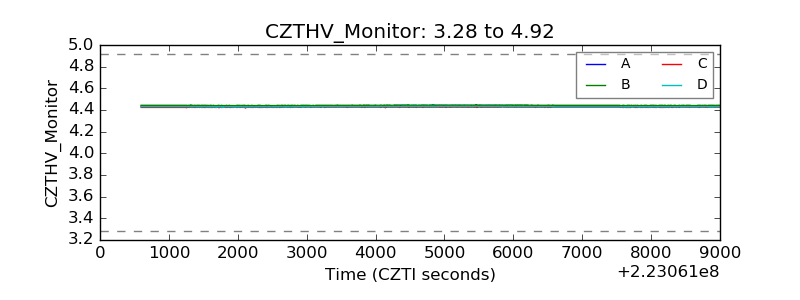 |
| D_VDD |  |
| Temperature 1 | 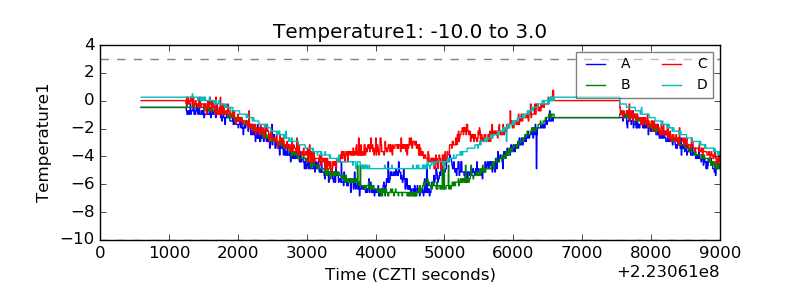 |
| Veto HV Monitor | 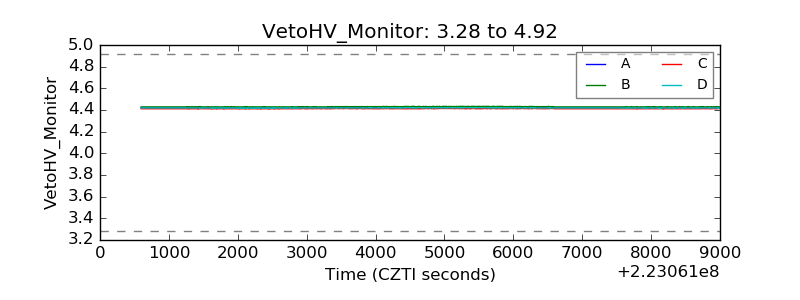 |
| Veto LLD | 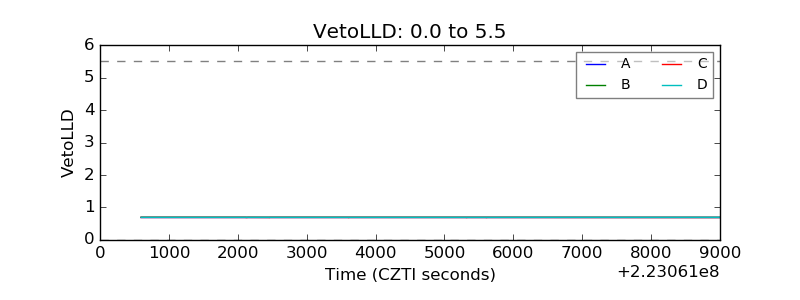 |
| Alpha Counter | 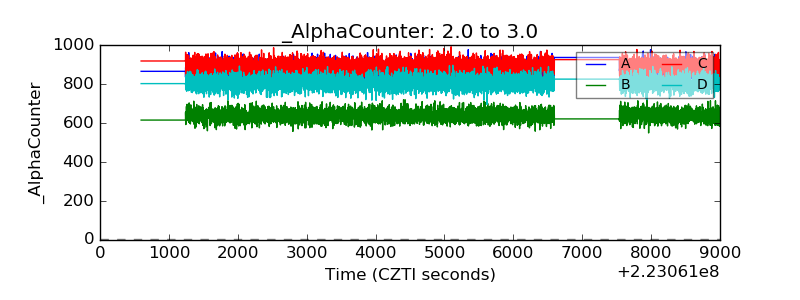 |
| _CPM_Rate | 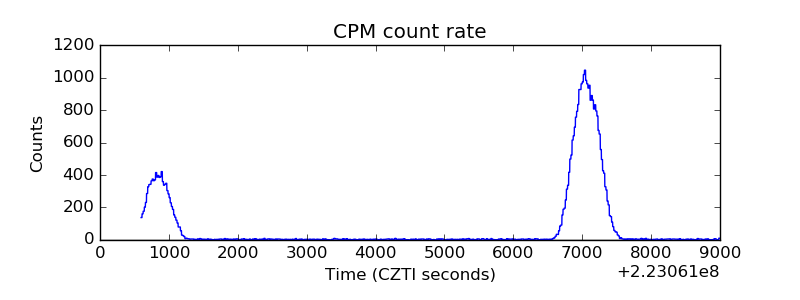 |
| CZT Counter | 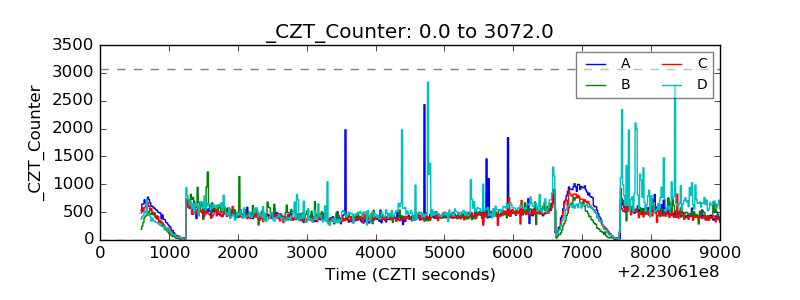 |
| +2.5 Volts monitor |  |
| +5 Volts monitor |  |
| _ROLL_ROT | 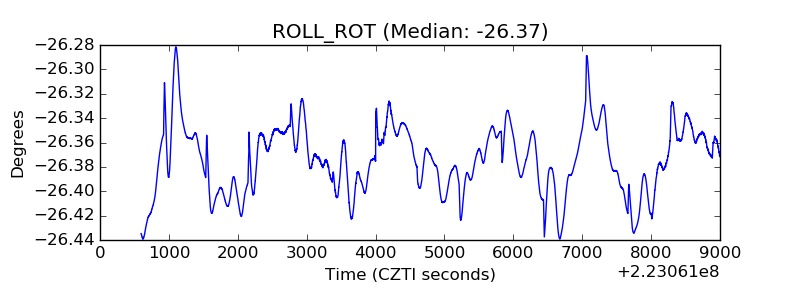 |
| _Roll_DEC | 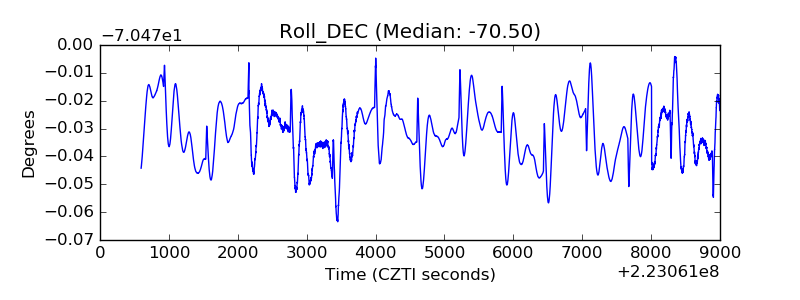 |
| _Roll_RA | 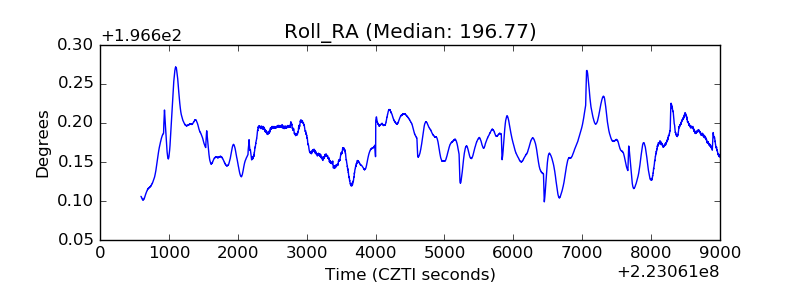 |
| Veto Counter | 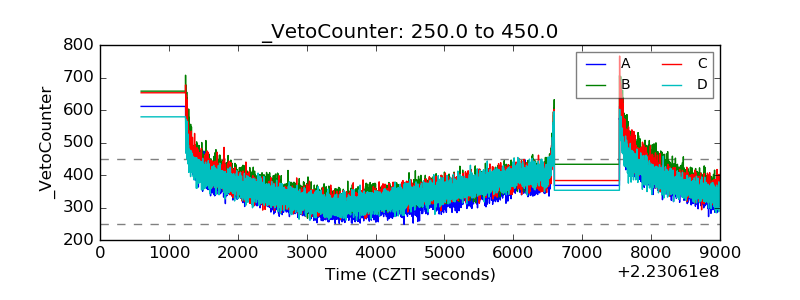 |