| Param | Original file | Final file |
|---|---|---|
| Filename | modeM0/AS1A02_176T01_9000000980_07190cztM0_level2.evt | modeM0/AS1A02_176T01_9000000980_07190cztM0_level2_quad_clean.evt |
| Size (bytes) | 444,850,560 | 118,529,280 |
| Size | 424.2 MB | 113.0 MB |
| Events in quadrant A | 2,967,891 | 794,574 |
| Events in quadrant B | 3,119,139 | 813,850 |
| Events in quadrant C | 2,823,487 | 788,793 |
| Events in quadrant D | 4,123,111 | 742,517 |
| Mode M9 | |||
|---|---|---|---|
| Quadrant | BADHDUFLAG | Total packets | Discarded packets |
| A | 0 | 18 | 0 |
| B | 0 | 18 | 0 |
| C | 0 | 18 | 0 |
| D | 0 | 19 | 0 |
| Mode M0 | |||
|---|---|---|---|
| Quadrant | BADHDUFLAG | Total packets | Discarded packets |
| A | 0 | 13338 | 3 |
| B | 0 | 13671 | 2 |
| C | 0 | 13062 | 2 |
| D | 0 | 16851 | 2 |
| Mode SS | |||
|---|---|---|---|
| Quadrant | BADHDUFLAG | Total packets | Discarded packets |
| A | 0 | 132 | 0 |
| B | 0 | 132 | 0 |
| C | 0 | 132 | 0 |
| D | 0 | 132 | 0 |
| Quadrant | Total seconds | Saturated seconds | Saturation percentage |
|---|---|---|---|
| A | 6451 | 27 | 0.418540% |
| B | 6451 | 40 | 0.620059% |
| C | 6451 | 9 | 0.139513% |
| D | 6451 | 114 | 1.767168% |
Noise dominated data is calculated using 1-second bins in cleaned event files. If a bin has >2000 counts, and if more than 50% of those come from <1% of pixels, then it is considered to be noise-dominated and hence unusable.
| Quadrant | # 1 sec bins | Bins with >0 counts | Bins with >2000 counts | High rate bins dominated by noise | Noise dominated (total time) | Noise dominated (detector-on time) | Marked lightcurve |
|---|---|---|---|---|---|---|---|
| A | 7561 | 6451 | 2 | 2 | 0.03% | 0.03% | 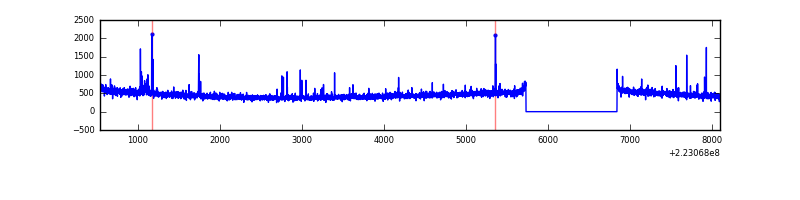 |
| B | 7561 | 6452 | 0 | 0 | 0.00% | 0.00% | 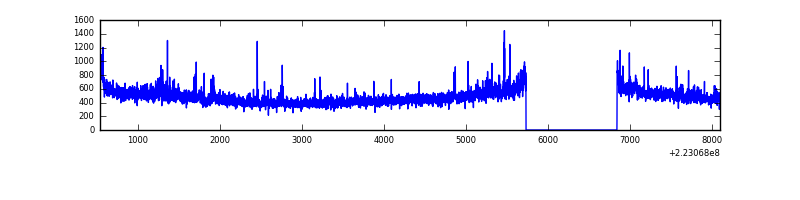 |
| C | 7561 | 6452 | 0 | 0 | 0.00% | 0.00% | 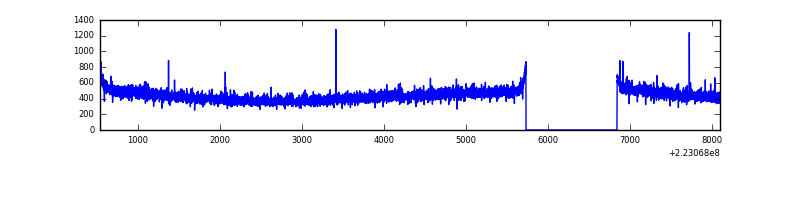 |
| D | 7561 | 6452 | 71 | 71 | 0.94% | 1.10% | 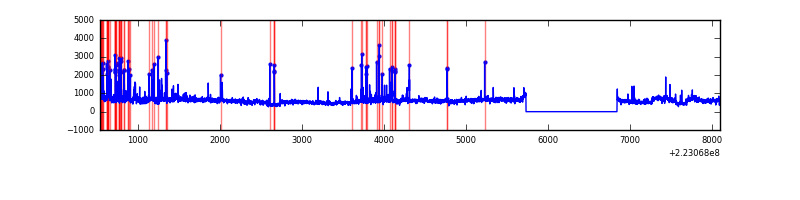 |
Top three noisy pixels from each quadrant. If the there are fewer than three noisy pixels in the level2.evt file, extra rows are filled as -1
| Pixel properties | Quadrant properties | ||||||
|---|---|---|---|---|---|---|---|
| Quadrant | DetID | PixID | Counts | Sigma | Mean | Median | Sigma |
| A | 14 | 238 | 35533 | 229.37 | 745 | 731 | 151.7 |
| A | 3 | 1 | 30264 | 194.65 | 745 | 731 | 151.7 |
| A | 13 | 14 | 12154 | 75.29 | 745 | 731 | 151.7 |
| B | 0 | 214 | 99802 | 687.89 | 760 | 743 | 144.0 |
| B | 0 | 219 | 33916 | 230.36 | 760 | 743 | 144.0 |
| B | 0 | 229 | 13707 | 90.03 | 760 | 743 | 144.0 |
| C | 13 | 61 | 5826 | 30.33 | 722 | 724 | 168.2 |
| C | 8 | 222 | 4149 | 20.36 | 722 | 724 | 168.2 |
| C | 14 | 67 | 2385 | 9.87 | 722 | 724 | 168.2 |
| D | 8 | 195 | 949395 | 5501.68 | 710 | 687 | 172.4 |
| D | 14 | 34 | 214911 | 1242.31 | 710 | 687 | 172.4 |
| D | 2 | 14 | 114434 | 659.63 | 710 | 687 | 172.4 |
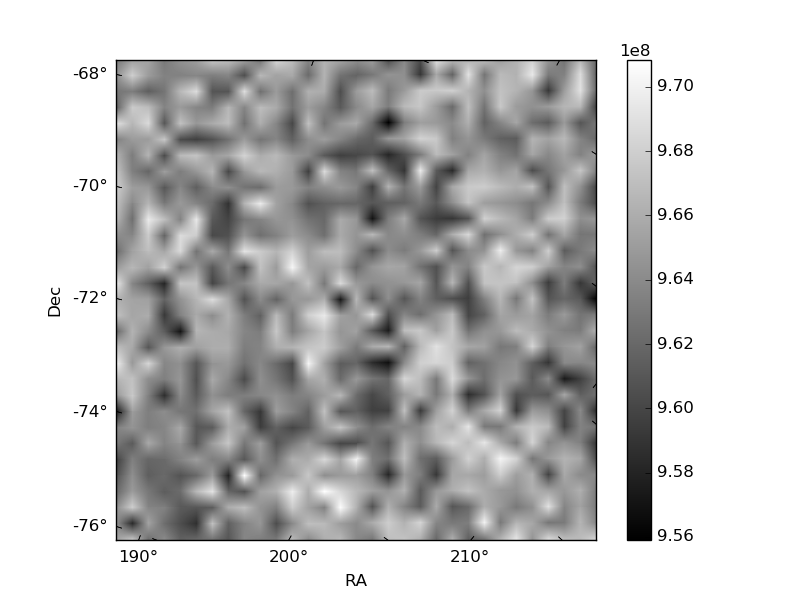
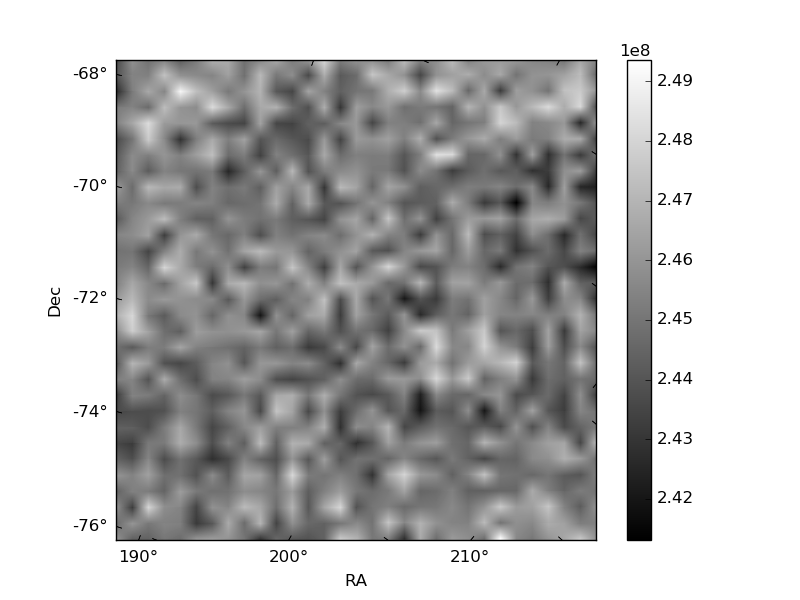
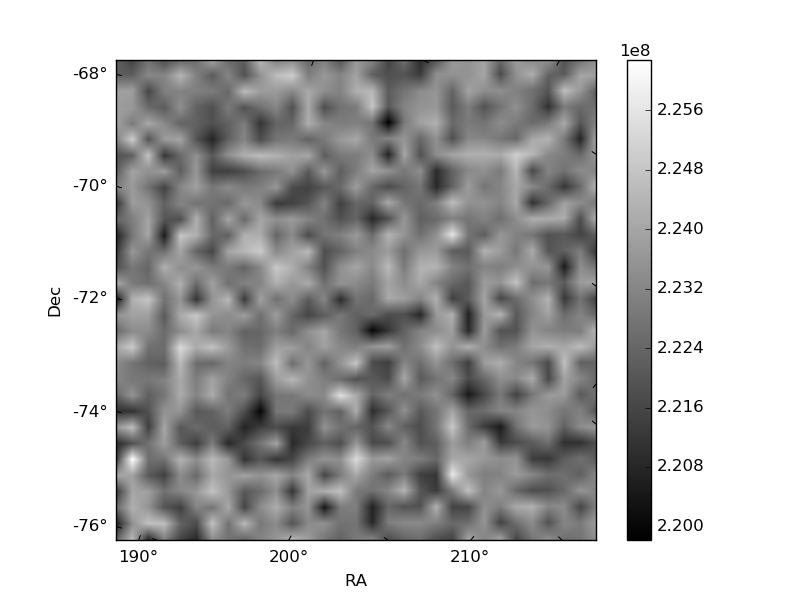
Histogram calculated using DETX and DETY for each event in the final _common_clean file
| Quadrant A | 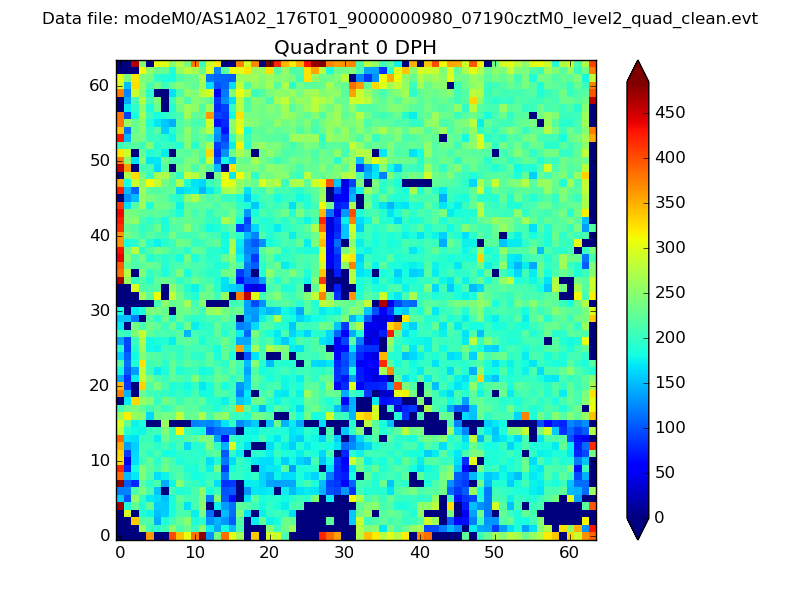 |
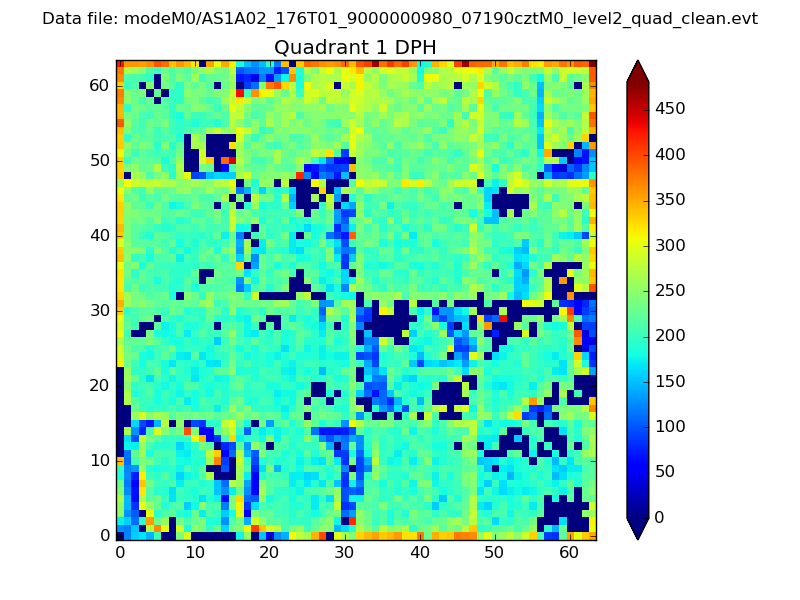 |
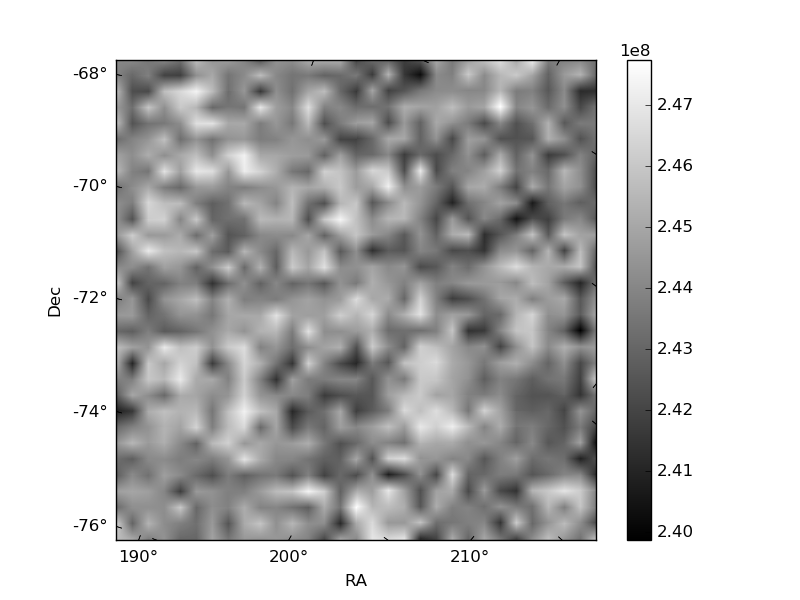
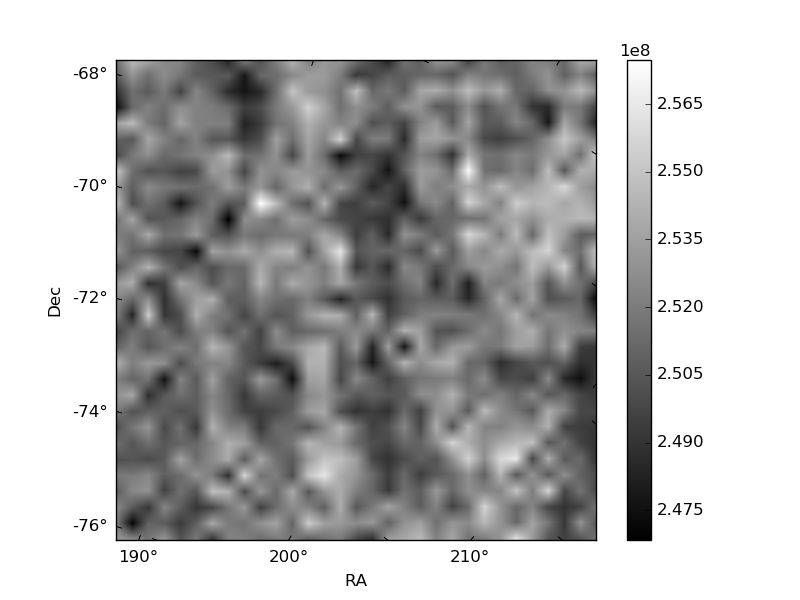
Quadrant B |
|---|---|---|---|
| Quadrant D | 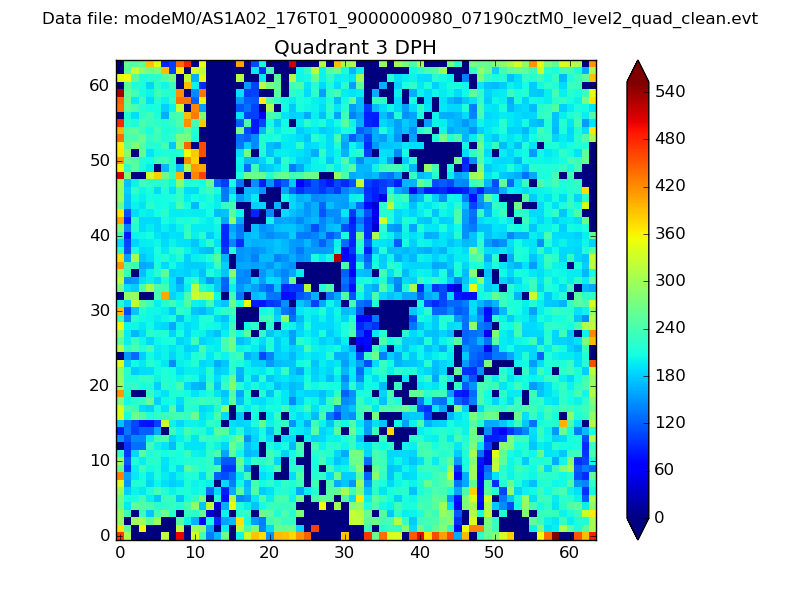 |
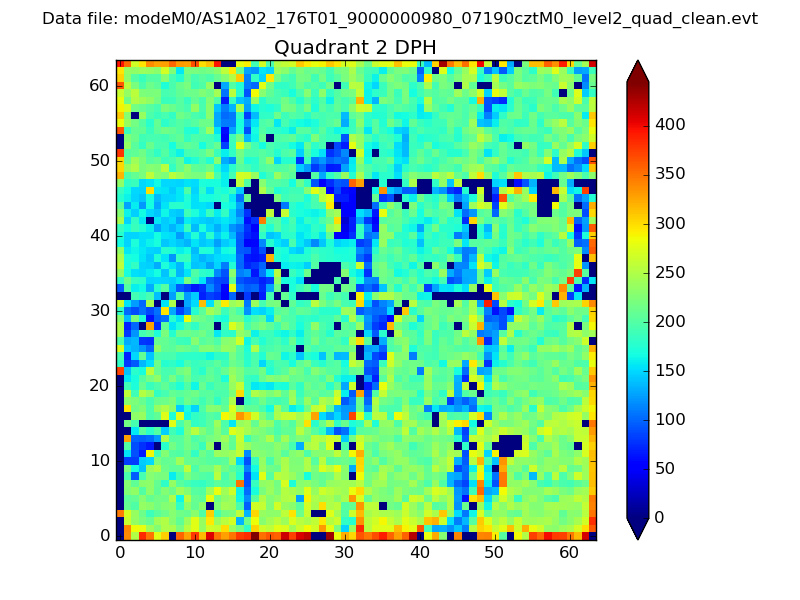 |
Quadrant C |
| Plot type | Count rate plots | Images |
|---|---|---|
| Comparison with Poisson distribution Blue bars denote a histogram of data divided into 1 sec bins. Red curve is a Poisson curve with rate = median count rate of data. |
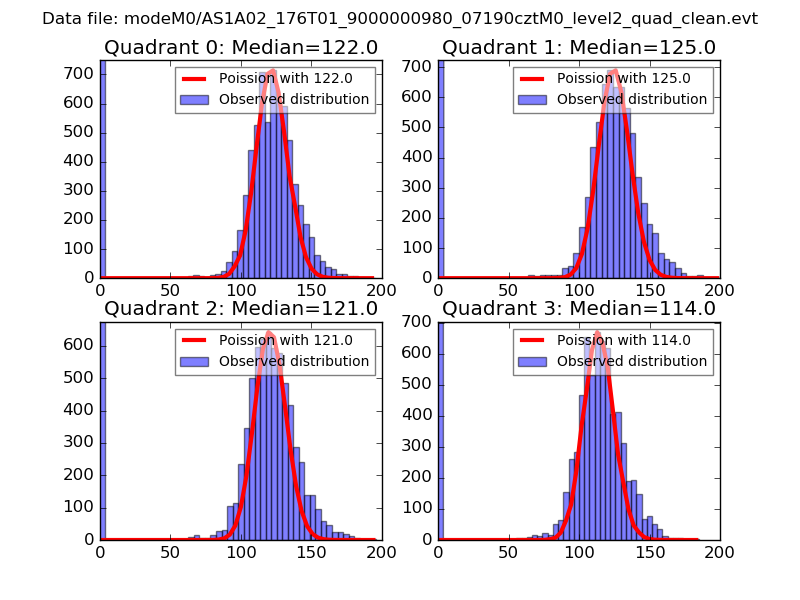 |
 |
| Quadrant-wise count rates Data is divided into 100 sec bins |
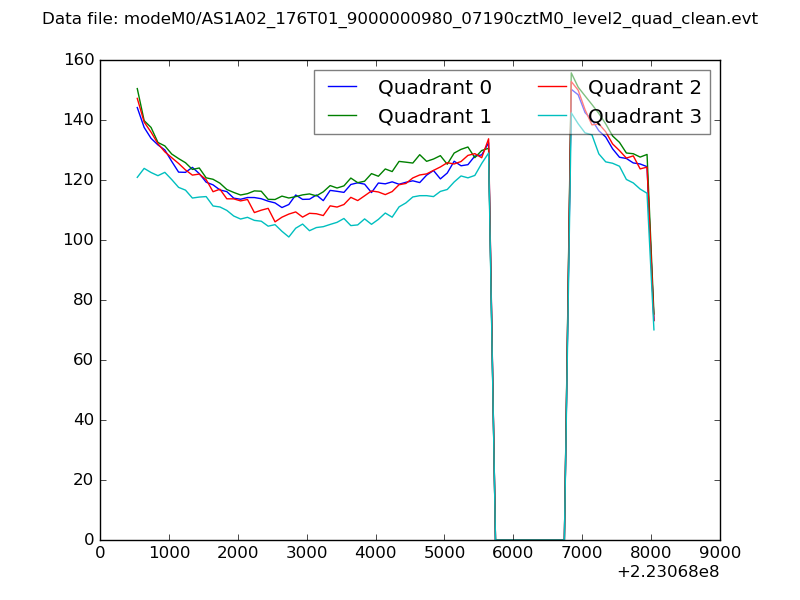 |
|
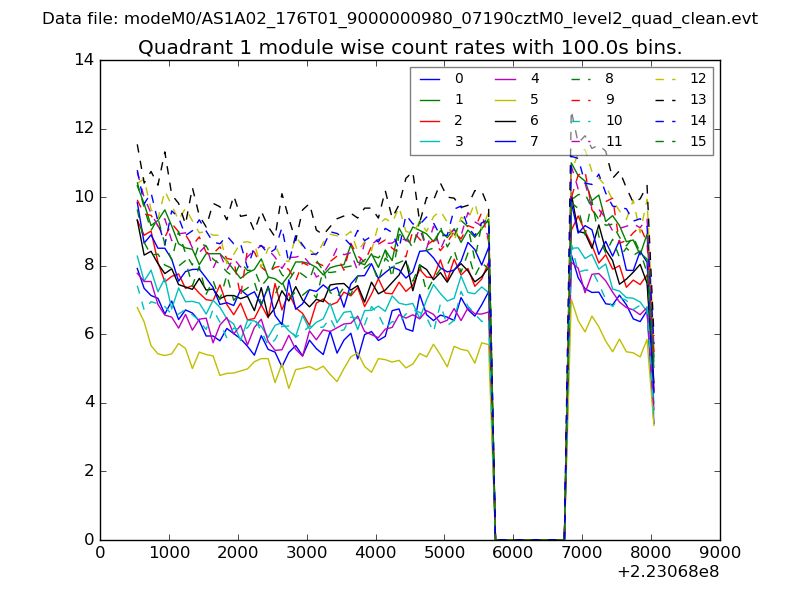
| Module-wise count rates for Quadrant A Data is divided into 100 sec bins |
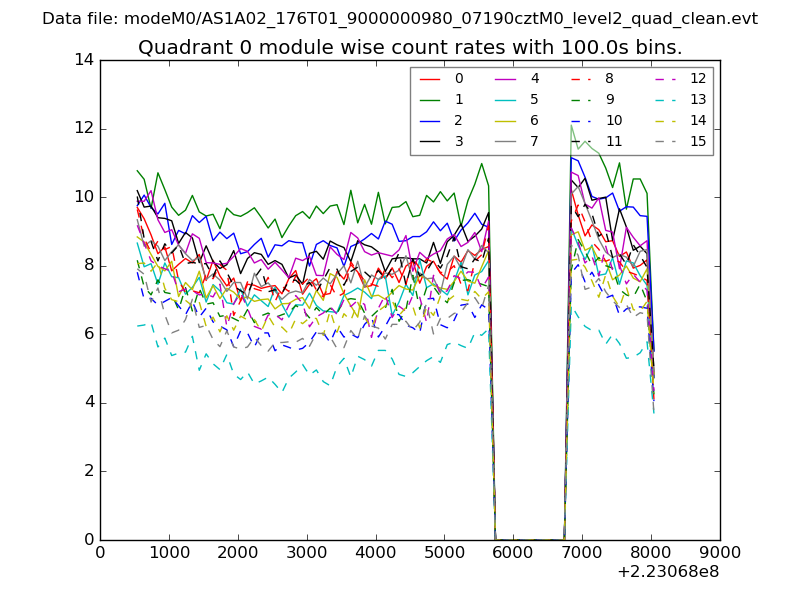 |
 |
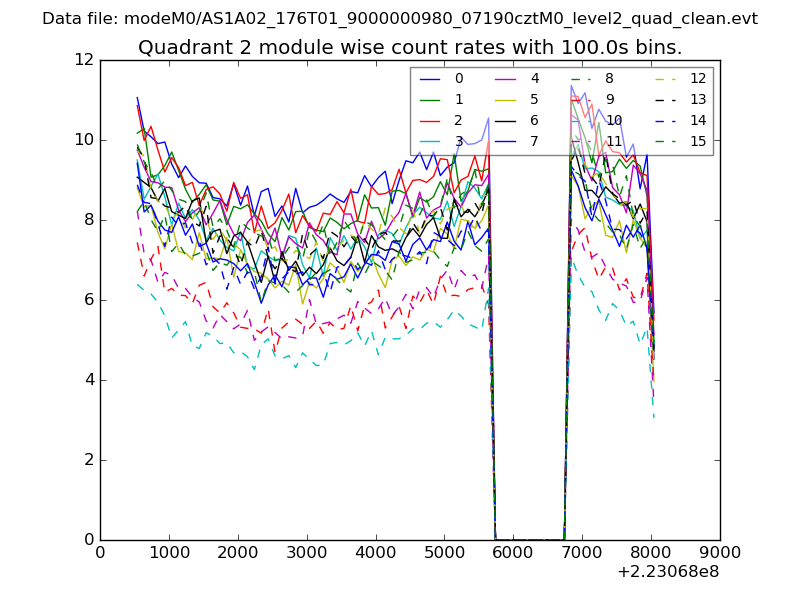
| Module-wise count rates for Quadrant B Data is divided into 100 sec bins |
 |
 |
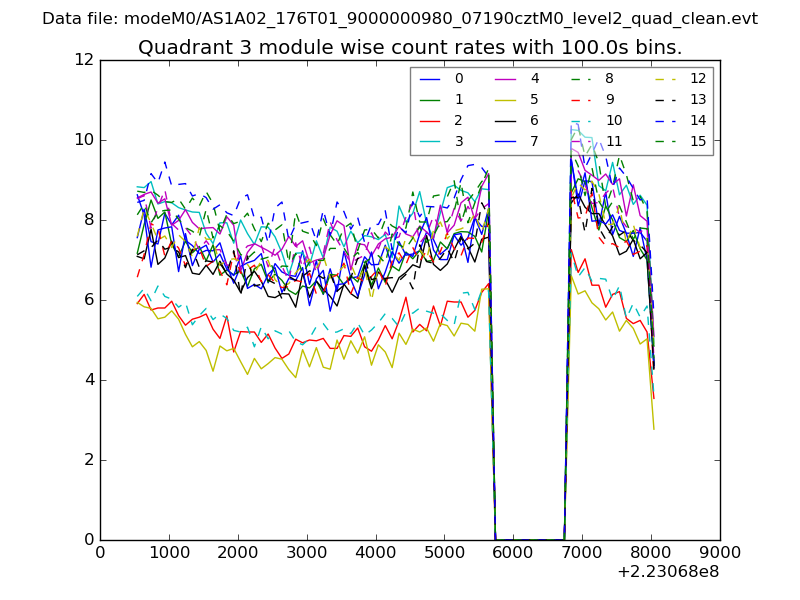
| Module-wise count rates for Quadrant C Data is divided into 100 sec bins |
 |
 |
| Module-wise count rates for Quadrant D Data is divided into 100 sec bins |
 |
 |
| Parameter | Plot |
|---|---|
| CZT HV Monitor | 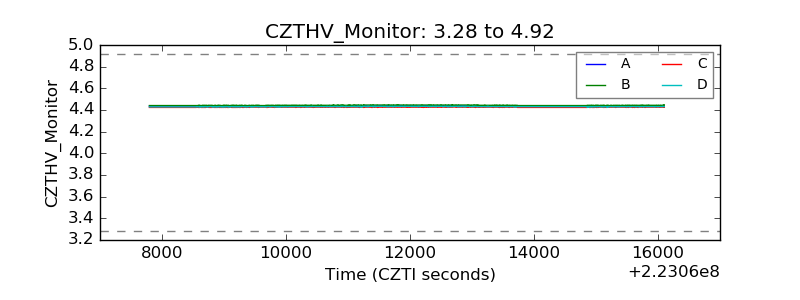 |
| D_VDD | 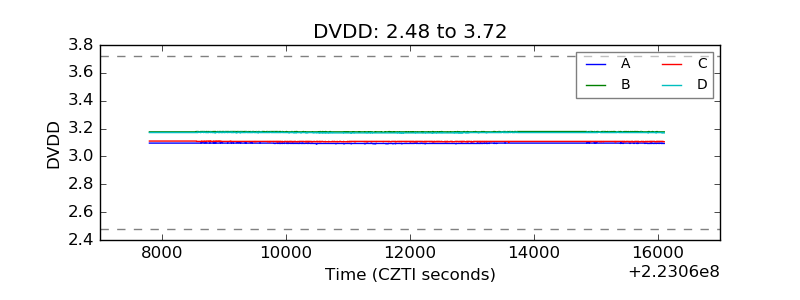 |
| Temperature 1 | 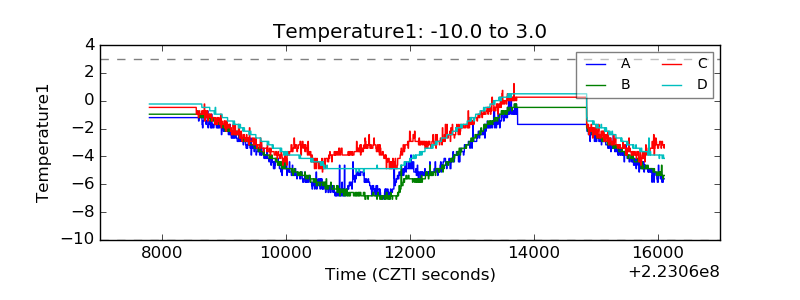 |
| Veto HV Monitor | 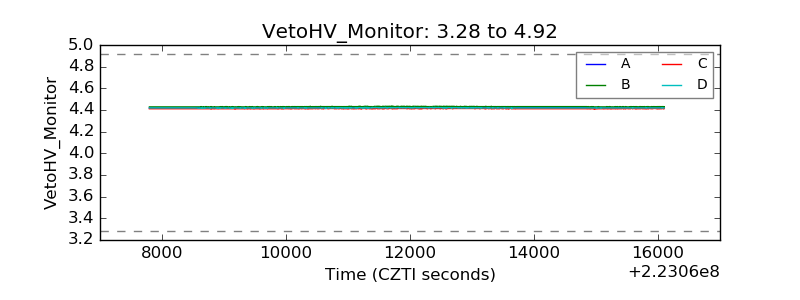 |
| Veto LLD | 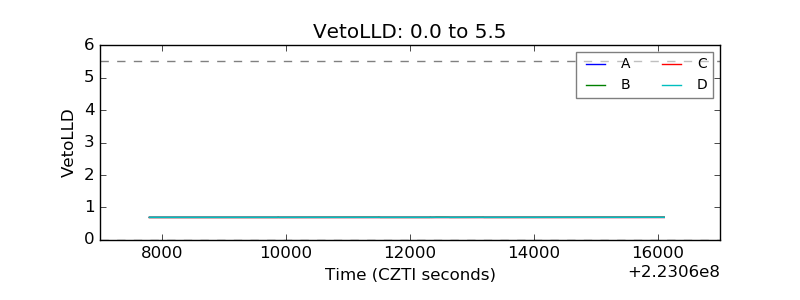 |
| Alpha Counter | 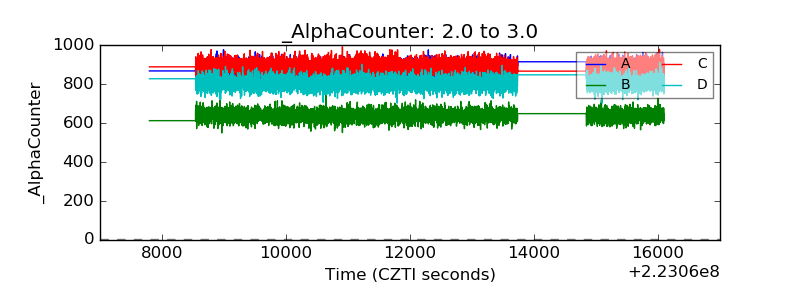 |
| _CPM_Rate | 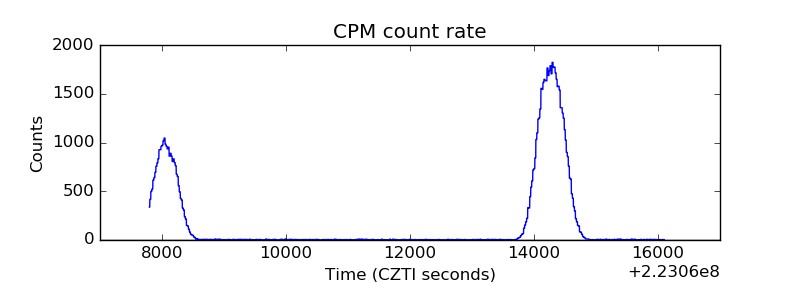 |
| CZT Counter | 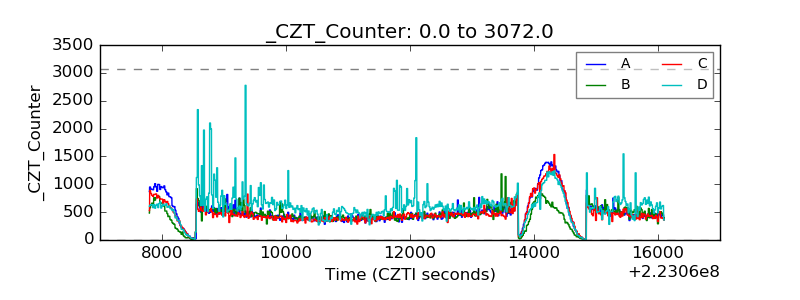 |
| +2.5 Volts monitor |  |
| +5 Volts monitor |  |
| _ROLL_ROT | 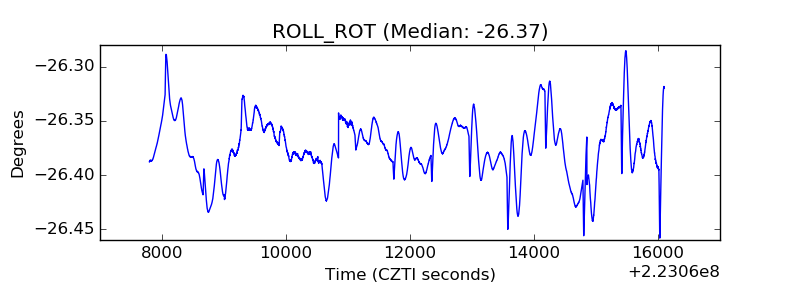 |
| _Roll_DEC | 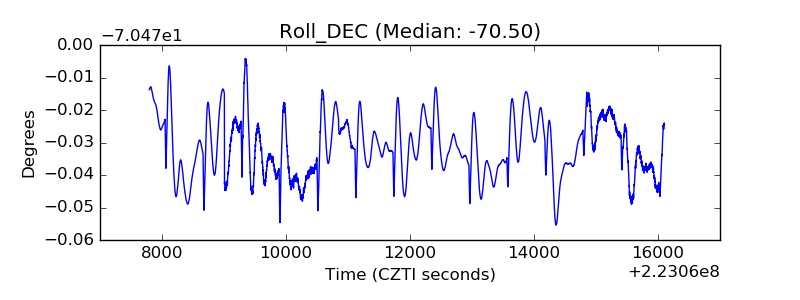 |
| _Roll_RA | 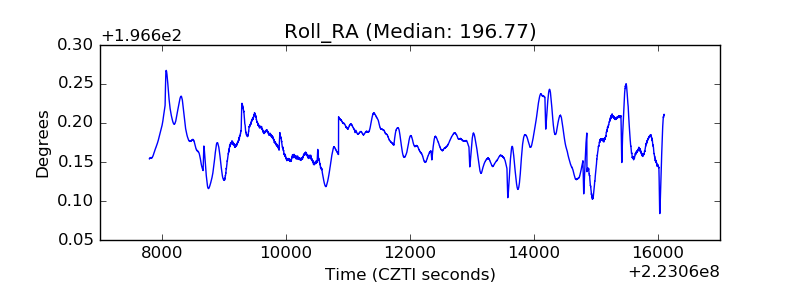 |
| Veto Counter | 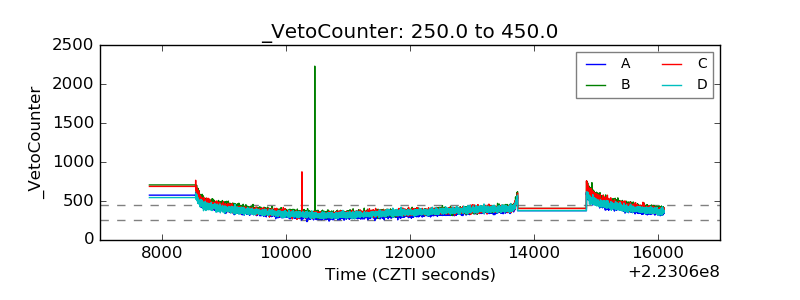 |